Predicting Budget Revenues of the Republic of Congo: Multiple Linear Regression Approach
←
→
Page content transcription
If your browser does not render page correctly, please read the page content below
International Journal of Economics and Finance; Vol. 13, No. 6; 2021
 ISSN 1916-971X E-ISSN 1916-9728
 Published by Canadian Center of Science and Education

 Predicting Budget Revenues of the Republic of Congo: Multiple
 Linear Regression Approach
 Itoba Ongagna Ipaka Safnat Kaito1
1
 College of Science, Gansu Agricultural University, Lanzhou, Gansu, China
Correspondence: Itoba Ongagna Ipaka Safnat Kaito, College of Science, Gansu Agricultural University, Anning
District, 730070, Lanzhou, Gansu, China. Tel: 86-182-1517-5327. E-mail: safnatongagna@outlook.fr

Received: March 9, 2021 Accepted: May 23, 2021 Online Published: May 28, 2021
doi:10.5539/ijef.v13n6p118 URL: https://doi.org/10.5539/ijef.v13n6p118

Abstract
Alongside political, legal and financial suggestions, prognosticating as part of a state's budget planning process
endures a substantial element. An act that furnishes for and authorizing what the State hopes to recover as
earnings along with what it intends to bear as expenditure for a calendar year and, however, which may be
subject to revision during its implementation in reaction to the current economic situation; the state budget
remains tactic for the extant, quality, functioning and organization of its Administration. As an oil-producing
country, the Republic of Congo, which must, among other things, have the financial means to meet these
ambitions, does not escape, like other countries selling hydrocarbons, the preponderance of revenues from this
sector in its budget forecasts. In view of the unpredictability of international oil markets on which government
revenues are largely dependent, the use of artificial intelligence would disclose ornaments in data volumes and
model interdependent systems to generate outcomes synonymous with enhanced decision-making efficiency and
value for money.
In this article, we will have to use Machine Learning to create the prediction model using secondary data from
international organizations and official annals of the Government of the Republic of Congo, that is, the annual
price of a barrel of oil and the budget foresees of state incomes and expenditures entered in various initial and
altering finance laws between the years 1980-2019. This representation is based on the multiple linear
retrogression algorithms that will ascertain the linear relationship between a dependent variable and independent
or explanatory variables. This will also concede us to approximate the foretell of the value “state revenues” from
the values “oil prices” and “state expenses”. As a result of the evaluation, the coefficient of determination (R2) of
the performance of the dummy based on the test data is 99%. Finally, the stereotype will be practiced on a web
interface granting users to enter the new independent data and then click a button to illustrate the result of the
predictions of the dependent value.
Keywords: budget, state revenue and expenditure, linear regression, prediction
1. Introduction
In order to carry out its tasks, the state must have the means of its policy. The Government of the Republic of
Congo, pay attention to the sub-regional directives of the Economic and Monetary Community of Central
Africa (CEMAC) linking to finance laws (CEMAC, 2011) and economic expeditions of the State (CEMAC,
2008), demonstrates a medium-term budgetary substructure that explains, based on realistic economic
assumptions, the evolution over a minimum period of three years of all expenditures and revenues of the State,
including contributions from international donors; the requirement for or ability to finance public administrations,
as well as the overall level of financial indebtedness of the State. Each year on these same principles, the State
budget reflects the financial expression of the economic, social and environmental development orientations of
the Government which are declined through the main categories of public expenditure, by nature, by function
and by Ministry in the National Development Plan (Ministry of Plan, 2018). Each Department prepares a draft
estimate before sending it to the Department of Finance for selection and final improvement. On the other hand,
the foresee of state earnings endures the entire privilege of the Ministry of Finance (Official Journal, 2017). After
observing the financial situation and on the basis of calculations and statistical estimates (Ministry of Economy,
2019), the experts draw up a forecast of state revenues. The budget thus set in the finance bill (the other name of
the budget), reflecting the expected economic assumptions of the government in terms of growth, inflation,

 118
ijef.ccsenet.org International Journal of Economics and Finance Vol. 13, No.6; 2021

revenue and the like, is put to a vote of Parliament. The Parliament may, however, propose amendments before
adopting this initial finance law before it is signed by the President of the Republic and published in the official
journal before the end of the year. This law can be revised during the fiscal year by a conceding law, also called
“Collective” to take into account changes in outlook, unforeseen events or to change the fiscal policy of the state
without waiting for the following year. Finally, when the year has passed, the budget is described as “executed”
because the actual figures of expenditure and revenue have been collected (Cameroon, Ministry of Finance).
In the finance laws, budget revenues are presented and classified into four headings: (i) tax revenues including
taxes, duties and other mandatory transfers other than social security contributions; (ii) donations and bequests,
competition funds including donations from international cooperation; (iii) social contributions, including
contributions to pension and social protection funds and (iv) other income, including income from property, sales
of goods and services, fines, etc. Budgetary expenditures are classified into six headings: (i) financial expenses
of the state debt; (ii) personnel expenses; (iii) Expenditure on goods and services; (iv) transfer expenses; (v)
capital expenses and (vi) other expenses. The estimates of revenue are voted together for the general budget, the
supplementary budgets and the special accounts of the Treasury (CEMAC, 2011) (Official Journal, 2017). Thus,
the budget, as a management tool, allows the State to have a global view of the sources of its revenues and their
allocations to the various expenses. Moreover, although the budget preparation procedure is well designed and
clearly defined in the organic texts, however, the economic situation of the Republic of the Congo has
deteriorated considerably over the past six years. In addition to the unorthodox execution of the state budget, the
complexity of administrative procedures, the volatility of oil prices on international markets, random decisions
and poor strategic choices have more or less a responsibility in the advent of the current economic crisis that is
going through the Republic of Congo. This situation has forced the country to seek loans from international
creditors (International Monetary Fund;, 2019) to support its public finances where expenses are increasingly
widening gap with domestic revenues (Jean, 2016). The accuracy of forecasts is therefore a major problem to be
solved in order to partly improve the work of budget planning. This sector long acquired standard statistical
analysis models and methods has been living for a few years, a real revolution like most sectors with the advent
of predictive analysis enabled by artificial intelligence.
In this article, we will try to initiate predictions of state incomes using a controlled Machine Learning algorithm.
The field of Machine Learning is full of algorithms to meet various requirements within its mathematical and
algorithmic specificities. What was a few years ago still the order of science fiction is now reality. We talk with
computers, our phones direct us and tell us the shortest path, our watches know if we have moved enough in the
day. The technique is increasingly intelligent, and scientists, engineers and programmers become teachers: they
“train” computers to learn autonomously (Digital Guide). Where a traditional computer program performs a task
by following precise instructions, machine learning does not follow instructions, but learns from experiments.
Arthur Samuel defined machine learning as “the set of techniques that allow a machine to learn to perform a task
without having to explicitly program for it.” (Antoine, 2011). Machine learning algorithms are divided into three
broad categories: supervised learning, unsupervised learning, and reinforcement learning. Supervised learning
can be divided into two: regression analysis used to predict numerical values and Classification analysis which is
a series of techniques used to predict categorical values (Eric Biernat, 2015). Some researchers have used
Machine Learning algorithms to address such interesting issues in multiple sectors. On the one hand, researchers
studied the predictive performance of artificial neural networks and nonparametric regression models against the
more conventional Box-Jenkins and structural econometric modeling approaches used in economic time series
forecasting. This study allowed them to demonstrate that the former approach worked better than the latter in
predicting GDP growth in African economies (Chuku et al., 2019). In their work, other researchers have found
the equivalence of multiple linear regression and thermodynamic fluctuations approaches for the calculation of
thermodynamic derivatives from molecular simulation (Ahmadreza et al., 2020). Some, on the other hand,
worked on a Normal least squares Vector Support Machine (NLS-SVM) and its classification learning algorithm
to demonstrate after simulations on artificial and real data that NLS-SVM outperformed LS-SVM on the results
obtained (Xinjun et al., 2009). A researcher proposed a kernel learning machine model associated with the
K-means and firefly clustering algorithms (K-means-FFA-KELM) with several subsets of data to evaluate the
monthly evapotranspiration reference in the Poyang Lake basin in China (Lifeng et al., 2020). Aware of the
impact of Machine Learning in the manufacturing industry, a researcher in his study uses neural networks to
estimate the credibility of decisions leading to the growth of Chinese companies in the sector in the world (Da et
al., 2020). Various scholars tend to argue that in order to apprehend deeply the garbage attitude of the city of
Bogota, an evaluation must be done to combine machine learning based on decision trees, support vector
machines and recurrent neural networks (Johanna et al., 2019) And on the other hand, researchers using their
own algorithm (BNII) sought to mitigate the significant loss of information by using a Bayesian network in

 119
ijef.ccsenet.org International Journal of Economics and Finance Vol. 13, No.6; 2021

intelligent credit rating systems (Qiujun et al., 2020).
The Republic of Congo experienced nearly a dozen budget collectives in the period studied and three of them
between 2014 and 2017. This budgetary instability is sufficient evidence that there is little need to revise the
models and methods utilized in the process of drawing up and forecasting the state budget. This work would
grant policy and administrative frameworks, public finance specialists to give regard the model shifts brought by
artificial intelligence in the public finance sector. Using a combination of Mixed Data Sampling regression
models (MIDAS), the author of a study finds that his approach based on mixed frequency data, composed of
budget series and macroeconomic indicators to forecast in real time the annual federal budget, expenditure and
revenue of the US yields better results compared to traditional models (Eric et al., 2015).
2. Methodology
Limited by the number of sources of information, we will be used the documentary technique to collect
secondary data published on the websites (Ministry of Finance and Budget, 2020) (Official Journal, 2019) of the
Government of the Republic of Congo, documents relating to the state budget, the various initial and/or
amending finance laws between the years 1980-2019 in which the estimates in revenue and expenditure will
enter in the chapter “general budget” will be interested in our work. In view of the significant weight of revenues
from the hydrocarbon sector (EITI Executive Committee, 2017) in the state budget, we will have to associate
with the first data, the annual prices of the barrel of oil of the same period, also online will be collected (Statista
Research, 2020). The Excel software will be necessary for us to sort and retrieve useful data in these masses of
information.
In machine learning, there are two different types of supervised learning methods: classification and regression.
In general, regression is a statistical method that estimates relationships between variables. Classification also
attempts to find relationships between variables, the main difference between classification and regression being
the output of the model (Eric, 2015). In a regression task, the output variable is numeric or continuous in nature,
while for classification tasks, the output variable is categorical or discrete in nature. Linear regression is one of
the most commonly used algorithms. There are two types of linear regression analysis: single and multiple. It is
called simple when it is composed of a dependent variable and an independent variable while it is multiple when
it involves two or more independent variables and a dependent variable.
The multiple linear regression model can be presented as follows:
 Yt = β0 +β1 X1t +β2 X2t +,… +βm Xmt +εt (1)
And for the estimated model we write:
 ̂ = 0 + 1 1 + 2 2 +, … + (2)
Our case uses a model with two independent variables:
 = 0 + 1 1 + 2 2 + (3)
With:
 is the variable dependent on the date «t», called endogenous;
 ̂ is the predicted value of ;
 1 , 2 , … are the so-called exogenous independent variables;
 1 is the coefficient associated with the variable 1 ;
 is the error term that crystallizes all the shortcomings of the model.
This least square method will estimate the relationship between the variables and estimate how the dependent
variable changes as the independent variables change by minimizing the sum of the squares of the deviations .

 120
ijef.ccsenet.org International Journal of Economics and Finance Vol. 13, No.6; 2021

 Figure 1. Representation of the adjustment of point clouds by the regression line

In the course of our research, four performance indices will be calculated: Root Mean Squared Error (RMSE),
Coefficient of Determination (R2), Mean Absolute Error (MAE) and Mean Squared Error (MSE).
In the Root mean squared error, errors are squared before being averaged. Greater weight is assigned to larger
errors.
 1
 = √ ∑ =1 2 (4)

The coefficient of determination is the percentage of the total error on the dependent variable Y (state revenue)
illustrated by the paradigm. This coefficient is formulated by:
 ∑( ̂− ̅)2
 2 = ∑( − ̅)2
 × 100 (5)

The Mean absolute error is one of the most commonly used metrics.
 1
 = ∑ =1| | (6)

The Mean squared error gives a linear value, which averages the weighted individual differences. The lower the
value, the better the performance of the model.
 1
 = ∑ =1 2 (7)

We will use the Python language under Jupyter Notebook with its libraries to model our algorithm before
implementing it on a web page using Flask under PyCharm. This interface will support the processing of the data
entered by the user and also the display of the response to be returned.
2.1 Objective
The broad objective of our work is to propose a web interface associated with a multiple linear regression
algorithm allowing users to make predictions of state budget revenues.
2.2 Specific Objectives
1) Readiness of accumulating features;
2) Pretreatment along with numerical survey of data;
3) Generating the various linear lapse paradigm;
4) Implementation and testing of the model on a web interface.
3. Literature Review
3.1 Budget
Coming from the old French budget, bag serving as a purse. A budget is an approximate of the outlay and
earnings of an organization, a state, a territorial authority, an institution, an association, any financial agent, an

 121
ijef.ccsenet.org International Journal of Economics and Finance Vol. 13, No.6; 2021

individual. The budget is the translation, expressed in monetary terms, of the various assumptions concerning the
environment, activity, operations, investments and action plans envisaged in a given period, usually a year,
corresponding to an accounting year (La Toupie). The state budget consists of the general budget, auxiliary
budgets and special accounts. Once passed by Parliament, it becomes an initial finance law and presents all the
revenues and expenses of the various ministries for a calendar year. By its amount, its orientations and its
implications, the state budget constitutes a real political issue. If the Initial Finance Law (LFI) fixes and
authorize all the resources and expenses of the State before the financial year, the Amending Finance Law (LFR)
or “budget collectives” as for it modifies during the financial year, the provisions of the initial finance law and
finally, the Regulation Law (LR) sets the final amount of revenue and expenditure of the budget, as well as the
budgetary result (deficit or surplus). Table 1 below presents the general budget estimates in revenue and
expenditure for the 2019 fiscal year of the Republic of the Congo.
3.2 Revenue
Revenue is the increase within net worth resulting from a transaction. Revenue transactions have counterpart
inflows, in the form of either an increase in assets or a decrease in liabilities, which has the effect of increasing
net worth (International Monetary Fund, 2014). Revenues can be tax or non-tax. Tax forms refer to all amounts
of money paid to the State for the payment of tax, for example. And non-tax accounts for all proceed from
sources other than taxes.
3.3 Expenditure
Expenses are a decrease in net worth resulting from a transaction. They have counterpart inflows, in the form of
either a decrease in assets or an increase in liabilities, which has the effect of reducing net worth (International
Monetary Fund, 2014). Expenses are authorized only by a finance law. They can support the expenses related to
state investments, the repayment of public debt, the care of its staff, etc.
3.4 Dependence of the Budget on the Oil Sector
The current paradigm based on the exploitation of the oil rent is no longer feasible not only because of the
current crisis but also in view of the high revolutions examined in the sectors of new information and
communication technologies, transport with electric vehicles, green energy and biofuels. The implementation of
regional and organizational strategies is urgently required in order both to meet external needs along with to
correct internal constraints both in terms of economic (short earnings, great debt, large pro-cyclical expenditure)
and public administration management (International Bank for reconstruction, 2018).
3.5 Artificial Intelligence
Artificial intelligence (AI) research is trying to create machines capable of acting like human beings: indeed,
computers and robots are supposed to analyze their environment and thus make the best possible decision.
Robots must therefore behave intelligently according to our standards. But this opens up a problem: what criteria
should we use to judge our own intelligence? Today, AI cannot simulate the whole human being (especially
emotional intelligence). Instead, partial aspects are isolated in order to cope with specific, precise tasks. This is
commonly referred to as weak artificial intelligence (weak AI).
As human analysis capabilities become insufficient in the face of the growing production rate of the amounts of
data created by humans and machines, it is necessary for humans to rely on machine learning systems to perform
sharp analyses. This new paradigm also makes it possible to discover and realize unknown connections between
the different types of data, long unknown and unsuspected by using the application of known models or by the
search for new models of analysis. Thus, being able to offer predictions that are finer and even closer to reality.

Table 1. General budget revenue and expenditure forecast for the 2019 finance act
 Nature of income and expenditure In billions of XAF
 General budget 1,987,150
 Budgetary resources 1987,150
 Tax revenues 831,534
 domestic taxes 694,334
 customs duties and taxes 137,200
 Donations and bequests and contest funds 28,000
 donations from international institutions 28,000

 122
ijef.ccsenet.org International Journal of Economics and Finance Vol. 13, No.6; 2021

 Other income 1,127,616
 forest revenues 10,000
 sale of oil cargoes 1,054,176
 unitization zone 30,000
 oil bonus 10,000
 mining revenue 1,500
 dividend 3,000
 fees and administrative costs 13,840
 fines and monetary sentences 100
 interest on loans 5,000
 Budgetary expenditure 1482985
 Financial debt charges 121,000
 Personnel 374,000
 Goods and services 187,700
 Transfer 470,285
 Investment 293,000
 on internal resources 150,000
 on external resources 143,000
 Other expenditure 37,000
Sourse: Ministry of Finance and Budget (Congo, 2018).

4. Results and Discussion
4.1 Data
We relied on the possibility of making available a web interface associated with a multiple linear regression
algorithm to users to predict state revenues taking into account the overall projections of expenditures and the
price of the current barrel of oil. To carry out this work, we used historical data from the period 1980-2019,
collected on Government websites (Ministry of Finance and Budget, 2020) (Official Journal, 2019) and
sub-regional (CEMAC).

Table 2. Extract from the dataset used for our work. In billions of cfa francs for revenue / expenditure and in us
dollars for oil
 Years Revenue Expenditure Oil
 2019 1987150,00 1482985,00 62,98
 2018 1522629,00 1131501,00 69,52
 2017 1243300,00 1498537,00 52,51
 2016 2156468,00 2454717,00 40,68
 2015 3069750,00 3055340,00 49,49
 1985 311000,00 311000,00 27,01
 1984 412421,00 412421,00 28,20
 1983 388967,00 38896,00 29,04
 1982 279932,00 279932,00 32,38
 1981 159934,00 159934,00 34,00
 1980 86220,00 86220,00 35,52
Source: develop by researcher.

In the course of the work, the missing and unavailable information for the years 1991, 1992 and 1993 at the level
of Income and Expenditure was replaced by the information for the year 1994 in our dataset.
In general, the forecast of state revenue and expenditure remained in balance throughout the period under review.
As shown in figure 2, this balance gradually follows the trend of the price of a barrel of oil. This situation
exposes the fragility of public finances in the face of international oil sector markets and consolidates the label
“economy of rent” to the Republic of Congo, ranked 6th African country according to the volume of oil
produced in 2017 (Ecofin, 2018).

 123
ijef.ccsenet.org International Journal of Economics and Finance Vol. 13, No.6; 2021

 Figure 2. Changes in revenues, expenditures and prices per barrel of oil for the period under study

In Table 3, we illustrate the measures of central trend and propagation that summarizes the characteristics of the
data studied.

Table 3. Descriptive statistics of our dataset
 Revenue Expenditure Oil
 count 4.000000e+01 4.000000e+01 40.00000
 mean 1.143290e+06 1.143290e+06 41.80800
 std 1.152169e+06 9.840682e+05 29.24464
 min 8.622000e+04 8.622000e+04 12.28000
 25% 3.850002e+05 3.850002e+05 18.57500
 50% 5.852375e+05 5.852375e+05 28.62000
 75% 1.432786e+06 1.419075e+06 60.89500
 max 4.117397e+06 3.647897e+06 109.45000
Source: develop by researcher.

After generating the various linear throwback algorithm, we coached it on a sample of 80% of the data. It was
then tested on the remaining data to estimate predictions. Following this, in Table 4 below, we see the difference
between estimates of actual values against forecasts made by the model.

Table 4. Difference between the real values and the values predicted by the developed model
 Years Actual value Predicted Values Difference
 2018 1522629.0 1.521027e+06 1601.898997
 2016 2156468.0 2.366542e+06 -210073.853591
 2014 3932932.0 3.9956050e+06 -62718.071295
 2003 828272.0 8.172449e+05 11027.062336
 1994 389628.0 3.019536e+05 87674.388860
 1991 389628.0 3.347666e+05 54861.446704
 1988 204445.0 1.270659e+05 77379.111077
 1981 159934.0 2.981550e+05 -138221.037299
Source: develop by researcher.

 124
ijef.ccsenet.org International Journal of Economics and Finance Vol. 13, No.6; 2021

By superimposing the actual values and the predicted values in Figure 3, the model shows that the values
predicted by it are close to the trend of the actual values.

 Figure 3. Visualization of actual vs predicted values using a Multiple Linear Regression Model of government
 revenues between 1980-2019

 Figure 4. Visualization of the error rate between predicted values using the multiple linear regression model to
 actual government revenue values between 1980 and 2019

The error rate between actual and forecast values is 86% in 1981, i.e., in the second year of the dataset. In 1988,
this rate rose to -37% before falling to 1.5% in 2014 and finally stabilizing at -0.10% in 2018. In Figure 3 below,
the further we move in time, the less is the difference between the actual and predicted values by the model.

Table 5. Model performance
 RMSE R2 MAE MSE
 Based on learning 279627.82 0.93 187852.26 78191722599.31
 Based on test 279627.82 0.99 80444.60 10497237674.14

In Table 5 above, we can see that the value of the average quadratic error on the test basis is 279627.82, which is
slightly 24.45% lower than the average value of the State revenues of our dataset. This means that our algorithm

 125
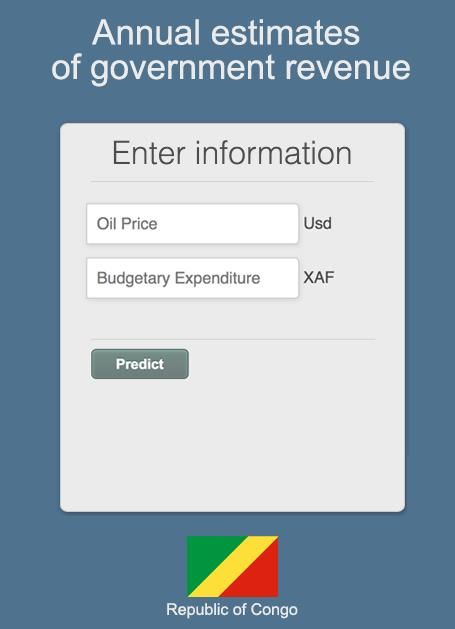
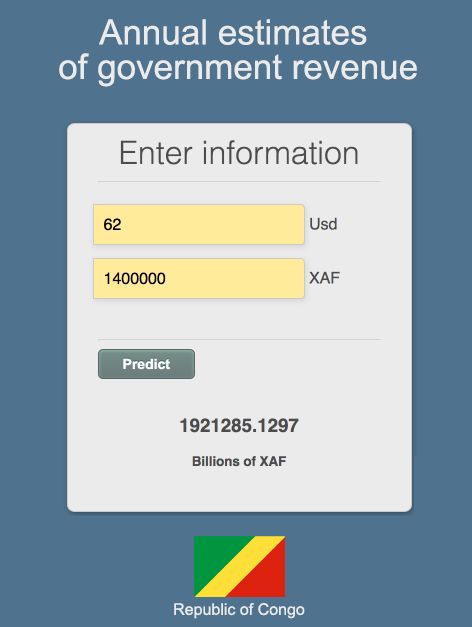
ijef.ccsenet.org International Journal of Economics and Finance Vol. 13, No.6; 2021

can, however, make comparatively good predictions. The web interface implemented grants to enhance the
interaction of users with our model to make predictions using new data. Figure 5 presents the home page of the
web interface before the user enters the data and Figure 6 presents it with the data entered as well as the amount
of state revenues predicted after a click on the “Predict” button.

 Figure 5. User interface home page Figure 6. Government revenues predicted using new data

5. Conclusion
Today, in the face of increasing amounts of data, the interdependence has enlarged in the sectors of working life.
The economic and development prospects of the country on macroeconomic elements alone and standard
statistical techniques are no longer sufficient. The continuous enhancement of the abilities of artificial
intelligence compels us to contemplate it in order to revamp assets in all quarters. Having a quantitative dataset,
this article, which is absorbed in forecasting state economic earnings, favored to maneuver various linear lapse to
model a forecasting algorithm.
In view of the findings obtained, it is sensible to practice awareness in its functioning because of the restrictions
posed by the data collected. Having estimated the test data with an R2 score of 99%, the model is implemented
on a web interface to make predictions using new data. Faced with the current situation in the Republic of Congo,
in addition to reforms such as those proposed by other researchers (Jean, 2016) in order to control public
spending, break the dependence of the state budget on the hydrocarbon sector (EITI Executive Committee, 2017)
and reorient the economy on other sectors such as agriculture and industry (Ministry of Plan, 2018), our work
also emphasizes the need for the State to carry out structural reforms on the budget preparation process taking
into account the evolution of methods and models of analysis offered by Machine Learning. This update would
allow it to be able to maneuver with higher precision in this decision-making. The evolution of the proposed user
interface and a mix of analysis models based on multi-sector and heterogeneous datasets will be the subject of
our future research plans, with the aim of automating the entire process, from data collection to real-time
forecasts of government funding capacity and needs.
6. Recommendations
In view of the situation in this 21st century, it would be wise for the Republic of Congo to adopt new standards
taking into account local specificities in order to modernize the management and control framework of its public
finances.
To break down appropriations by program and no longer by chapter as currently, moving from a logic of
“medium “to a logic of” results” with the application of Results-Based Management (RBM) in order to improve
the performance of public management.
In order to publish adequate information on a regular basis, the public administrations should be aware of the
needs to produce statistical data and to strengthen the role of national specialized structures.
It should be updated and finalized the deployment of the state information system to increase the mechanism for
collecting public revenues, rationalize its spending and direct investments on priority sectors for its economic
and social development.

 126
ijef.ccsenet.org International Journal of Economics and Finance Vol. 13, No.6; 2021

Acknowledgements
We cannot close without thanking the public administrations of the Republic of Congo from whom we were able
to collect data, all these researchers from near and far who have before us worked on the issues related to the
state budget and Machine Learning algorithms. Without their multifaceted contributions, our work would not
have been successful.
References
Ahmadreza, R., Tyler, R., J., Yangzesheng, S., Othonas, A. M., David, D. J., Ilja, S., & Thijs, J. H. V. (2020).
 Multiple linear regression and thermodynamic fluctuations are equivalent for computing thermodynamic
 derivatives from molecular simulation. Fluid Phase Equilibria,
 http://doi.org/10.1016/j.fluid.2020.112785(523).
Antoine, G. (2011). Apprentissage automatisé - quelques notions clefs. Retrieved February 3, 2021, from
 https://blog.octo.com/machinelearning-intro/
Cameroon, Ministry of Finance. (n. d.). DG for Budget. Retrieved January 18, 2021, from
 https://www.dgb.cm/le-budget/cest-quoi-loi-de-finances/
CEMAC. (2008). Directive 04/08-UEAC-190-CM-17 sur les Opérations Financières de l'État. Yaoundé: Bulletin
 officiel de la Communauté.
CEMAC. (2011). Directive 01/11-UEAC-190-CM-22 sur les Lois de Finances. Brazzaville: Bulletin officiel de la
 Communauté.
CEMAC. (n.d.). Traités et Conventions de la CEMAC. Retrieved January 22, 2021, from
 http://www.cemac.int/node/38
Chuku, C., Anthony, S., & Jacob, O. (2019). Intelligent forecasting of economic growth for developing
 economies. International Economics. https://doi.org/10.1016/j.inteco.2019.06.001
Congo, G. (2018). Loi 40-2018 du 28 décembre 2018 portant loi de finances pour l'année 2019. Brazzaville:
 Journal Officiel.
Da, H., & Hassan, R. C. (2020). Using machine learning for evaluating global expansion location decisions: An
 analysis of Chinese manufacturing sector. Technological Forecasting & Social Change.
 https://doi.org/10.1016/j.techfore.2020.120436
Digital Guide, I. (n. d.). Digital Guide IONOS by 1&1. Retrieved February 3, 2021, from
 https://www.ionos.fr/digitalguide/web-marketing/analyse-web/quest-ce-que-lapprentissage-automatique/
Ecofin, A. (2018). Classement des pays africains, selon le volume de pétrole produit en 2017. Retrieved January
 16, 2021, from
 https://www.agenceecofin.com/hydrocarbures/0907-58446-classement-des-pays-africains-selon-le-volume-
 de-petrole-produit-en-2017
EITI Executive Committee, R. O. (2017). EITI Report 2015. Paris: Finergies.
Eric, B. M. (2015). Data Science: Fundamentals and case studies (Blanche ed.). Paris: Eyrolles.
Eric, G., & Nazire, O. (2015). Real-time forecasting of the US federal government budget: A simple mixed
 frequency data regression approach. International Journal of Forecasting, (31), 1009-1020.
 https://doi.org/10.1016/j.ijforecast.2014.12.008
International Bank for reconstruction, a. (2018). Economic Situation of the Republic of the Congo. Washington,
 DC: World Bank Group.
International Monetary Fund. (2014). Handbook of public finance statistics 2014. Washington, D.C.: Joint
 Bank-Fund Library.
International Monetary Fund. (2019). Press Release No 19/274. Washington, D.C: IMF Communications
 Department.
Jean, M. K. (2016). La Soutenabilitédes Finances Publiques au Congo. Annales de l'UniversitéMarien Ngouabi,
 1-2(16), 64-75.
Johanna, K. S., David, O. Y., & Javier, R. I. (2019). Predictive analysis of urban waste generation for the city of
 Bogota, Colombia, through the implementation of decision trees-based machine learning, support vector
 machines and artificial neural networks. Heliyon. http://doi.org/10.1016/j.heliyon.2019.e02810(5).

 127
ijef.ccsenet.org International Journal of Economics and Finance Vol. 13, No.6; 2021

La Toupie. (n. d.). Budget. Retrieved February 4, 2021, from http://www.toupie.org/Dictionnaire/Budget.htm
Lifeng, W., Youwen, P., Junliang, F., Yicheng, W., & Guomin, H. (2020). A novel kernel extreme learning
 machine model coupled with K-means clustering and firefly algorithm for estimating monthly reference
 evapotranspiration in parallel computation. Agricultural Water Management.
 https://doi.org/10.1016/j.agwat.2020.106624
Ministry of Economy, C. (2019). Note de Conjonctures Économiques. Brazzaville: Directorate-General for the
 Economy.
Ministry of Finance and Budget, C. (2020). Documentation. Retrieved February 4, 2021, from
 https://www.finances.gouv.cg/fr/documentation?keys=&term_node_tid_depth=68&field_document_date_v
 alue%5Bmin%5D%5Bdate%5D=&field_document_date_value%5Bmax%5D%5Bdate%5D=&page=2
Ministry of Plan, C. (2018). Plan National de Developpement. In Directorate-General for plan, Cadre
 Stratégique de Développement (pp. 40-41). Brazzaville: Journal Officiel.
Official Journal, C. (2017). Loi organique n36-2017 du 3 octobre 2017 relative aux lois de finances. Brazzaville:
 General Secretariat of the government.
Official Journal, C. (2019). Documentation. Retrieved February 4, 2021, from https://www.sgg.cg/fr/accueil.html
Qiujun, L., Xuqing, X., Haojie, M., & Gang, L. (2020). Multivariable data imputation for the analysis of
 incomplete credit data. Expert Systems With Applications. http://doi.org/10.1016/j.eswa.2019.112926(141).
Statista Research, D. (2020, Mai 4). Prix annuel du pétrole de l'OPEP, 1960-2019. Retrieved August 12, 2020,
 from https://fr.statista.com/statistiques/564926/prix-annuel-du-petrole-de-l-opep-1960/
Xinjun, P., & Yifei, W. (2009). A normal least squares support vector machine(NLS-SVM) and its learning
 algorithm. Neurocomputing, (72), 3734-3741. https://doi.org/10.1016/j.neucom.2009.06.005

Copyrights
Copyright for this article is retained by the author(s), with first publication rights granted to the journal.
This is an open-access article distributed under the terms and conditions of the Creative Commons Attribution
license (http://creativecommons.org/licenses/by/4.0/).

 128
You can also read