Poverty in Morecambe Bay - Research Paper Peace Research | June 2017 - Morecambe Bay Poverty Truth Commission
←
→
Page content transcription
If your browser does not render page correctly, please read the page content below
Research Paper
Peace Research | June 2017

Poverty in Morecambe Bay

1 | Richardson Institute
Contents
                Abbreviations           3
                Introduction            4
                Background              5
                Method                  5
                Poverty Indicators      6
                Case Studies            9
                Statuary Authorities    13
                Charities               19
                Faith Groups            23
                Private Sector          28
                Funding Sources         29
                Conclusion              32
                Bibliography            33
                Table of Figures        39

Authors
                Katia Duru
                Van Bui
                Manshuk Kassymzhanova
                Fabian Fluche
                Patrick Sweeney
                Maria Orbe Murias

Coordinator
                Joshua Hughes

2 | Richardson Institute
Abbreviations MB - Morecambe Bay Morecambe Bay – Morecambe Bay NHS Foundation Trust Area PTC – Poverty Truth Commission UK- United Kingdom 3 | Richardson Institute
Introduction
         Addressing the 66th United Nations General Assembly, Former Secretary-General Ban Ki-Moon said that
“Saving the planet, lifting people out of poverty and advancing economic growth anywhere are one and the same fight
for human security everywhere”. In this way, working to overcome poverty falls well within the remit of the Richardson
Institute’s positive peace agenda. Poverty actively damages the lives of thousands of people within the wider
community which Lancaster University finds itself a part of: the Morecambe Bay NHS Trust Foundation area
(Morecambe Bay hereafter). This paper is a part of a wider research project with the wider goal of the Richardson
Institute attempting to bridge this knowledge gap of poverty in the area, by working on behalf of the Poverty Truth
Commission (PTC hereafter) to contribute to the study of poverty in the local area.

       In the project brief, we were asked to look at four aspects around poverty in the Morecambe Bay area:
    1. To provide as much definitive information on poverty in Morecambe Bay as possible.
    2. To compile a directory of statutory, third sector, faith sector and other relevant agencies working for the
        alleviation of poverty within Morecambe Bay.
    3. To assess the extent to which these agencies fulfil the PTC adage “nothing about us without us is for us.”
    4. To discover possible funding sources available for the alleviation of poverty in Morecambe Bay.

         The aim of this investigation is thus to provide the PTC with information regarding the level of poverty, current
sectors and other relevant agencies tackling poverty, and reveal further potential for the PTC to promote their
conviction. This report is relevant because Morecambe Bay has substantial areas of multiple deprivation visible in the
high percentage of poverty.
         Firstly, we define Morecambe Bay geographically and provide as much definitive information on poverty
in Morecambe Bay as possible. Hereafter, a categorisation of poverty applied to Morecambe Bay will illustrate the
prevailing situation of poverty. Several case studies of certain areas are also provided. Based on the awareness of
existing poverty, we identify different agencies working for the alleviation of poverty in Morecambe Bay. To concretise
this, the report compiles a directory of statutory and private sector initiatives, along with third sector organisations
which are actively engaged in overcoming poverty. Moreover, the report will evaluate the extent to which these
agencies fulfil the PTC adage “nothing about us without us is for us”.
         The overall view of poverty in Morecambe Bay shows that some areas exhibit significant poverty whereas
others are relatively affluent. Although poverty and related issues are present all around the Bay from Barrow to
Fleetwood, due to being separated by a number of administrative boundaries, there is no unified plan for issues
affecting many residents in the area. There are several initiatives from the public, private, and charity sectors present
throughout Morecambe Bay which attempt to overcome poverty; most focus on relieving the effects of poverty, rather
than tackling its root causes. Although the scale of poverty and related issues in Morecambe Bay is very large, so too
is the energy and enthusiasm of individuals and groups working with, and helping people to overcome the poverty in
which they find themselves.

4 | Richardson Institute
Background
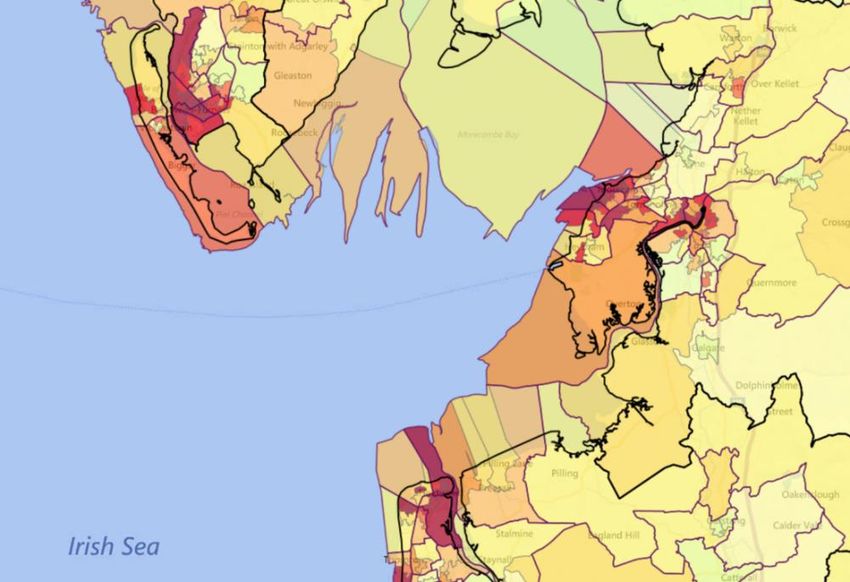
Figure 1: Map from Indices of Deprivation 2015. The darker colours indicate more deprived areas. (source:
http://dclgapps.communities.gov.uk/imd/idmap.html)
Morecambe Bay is almost 200 square miles (518 sq km), the second largest bay in the UK. 1 Morecambe Bay
stretches from the south west coast of Cumbria to Fleetwood in Lancashire, taking in coastal towns such as Grange
Over Sands, Morecambe and Heysham.2 Most populated cities of Morecambe Bay are Barrow-in-Furness
(69,100), Morecambe (33,400) and Fleetwood (26,000).
Barrow-in-Furness has 13 communities that rank within the 10% most deprived of areas in England.
Furthermore, six of Barrow-in-Furness’s communities are classified as being within the 3% most deprived nationally.3
Fleetwood is the most deprived area in the Wyre with unemployment twice the Lancashire rate, the highest number of
Houses of Multiple Occupancy/social housing, the lowest life expectancy and household income, along with the
highest benefit dependency and crime rate.4 Many local rural communities highlight that younger groups – particularly
families – are moving away. This is often due to a lack of affordable housing, or not having suitable employment and
training opportunities. These groups are often replaced by more affluent older families, for example moving in from
urban areas. The population in urban areas is decreasing, which is a marked contrast to the 20th century when these
areas were seen to be prosperous and developed.
Method
This report uses a mixture of quantitative and qualitative methods to work with both primary and secondary
resources. The approach was chosen consciously to integrate different perspectives regarding the diverse problem of
poverty.
We use quantitative methods including statistical and numerical analysis of data to provide broad patterns of
poverty in Morecambe Bay as well as to present problems and situations in a precise manner. Numerical evidence is
1 Spicker, P., 2007. Poverty: An International Glossary. London: ZedBooks.
2 Bramley, G., 2016. Structure rather than behaviour: on the causes of poverty. [online] Available at:
http://blogs.lse.ac.uk/politicsandpolicy/what-causes-poverty/ [Accessed 15 March 2017].
3 The Lankelly Chase Foundation, 2015. Hard Edges Mapping severe and multiple disadvantage England. [online] Available at:
http://lankellychase.org.uk/wp-content/uploads/2015/07/Hard-Edges-Mapping-SMD-2015.pdf [Accessed 15 March 2017].
4 Briggs, S., 2015. Holiday in Morecambe and its history. [online] Available at: http://www.stuartbriggs.co.uk/holiday-in-morecambe-
and-its-history/ [Accessed 15 March 2017].
5 | Richardson Instituteneeded to illustrate and support our findings.
Qualitative methods are used to analyse interviews, non-numerical data and to evaluate whether multiple
agencies that work to alleviate poverty in the area fulfil the PTC motto "nothing about us without us is for us".
The primary resources were mainly based on interviews with the Chief Executive Officer of the Lancaster
District Community & Voluntary Solutions and a development worker of the Church Urban Fund in central and west
Lancashire. The researchers tried to integrate personal views and professional knowledge of those who have been
working in the alleviation of poverty in Morecambe Bay.
Secondary resources are websites, social media, books, reports, articles, news, and statistics from national
agencies. This research provides a wider range of information and a practical insight of agencies, which tackle poverty.
Poverty Indicators
In order to better understand how the population of Morecambe Bay is affected by poverty, in this section we
discuss three broad definitions of poverty and five specific types of poverty that shows the level of deprivation of the
area: structural poverty, relative poverty, absolute poverty, child-poverty, fuel-poverty, migration-poverty, health-poverty
and economic deprivation.
Structural Poverty
Structural poverty refers to poverty caused by social or economic structures. 5 This inclusive definition
accounts for poverty from a systemic perspective, inviting a society-wide inquiry into the nature of poverty.
Lankelly Chase Foundation reports that severe and multiple disadvantage adults who are most likely to display
dysfunctional behaviours, only account for a small proportion (around 4 percent) of the proportion of the population in
overall poverty.6
The local economies in Morecambe Bay have traditionally relied heavily on seaside tourism, especially from
the early to mid 20th century.7 However, a report from The Office for National Statistics (ONS) in 2013 reveals that
many English seaside destinations are suffering from high levels of deprivation since people increasingly choose to go
abroad for their holidays.8 Rising wages and emerging cheap airlines allow for budget holidays to competitive resorts
where the weather is more ideal for holidays. Coastal towns in Morecambe Bay have suffered from the loss of tourists.
There is an evident link between a decline in tourism and deprivation, including income deprivation and employment
deprivation.9 According to the ONS report, Barrow-in-Furness is the 9th most deprived larger seaside destination in
England (out of 31). While Morecambe is the 6th most deprived mid-sized seaside destinations in England; Fleetwood
is the 11th most deprived (out of 26).10
Relative poverty
An individual suffers from ‘relative poverty’ if they lack the minimum amount of income needed in order to
maintain the average standard of living in society, leading to exclusion from ordinary living patterns, customs and
activities.11 While absolute poverty refers to a set standard which is the same in all countries and which does not
change over time, the standard for relative poverty depends on which country the individual is living in. 12 In the
5 Spicker, P., 2007. Poverty: An International Glossary. London: ZedBooks.
6 The Lankelly Chase Foundation, 2015. Hard Edges Mapping severe and multiple disadvantage England. [online] Available at:
http://lankellychase.org.uk/wp-content/uploads/2015/07/Hard-Edges-Mapping-SMD-2015.pdf [Accessed 15 March 2017].
7 Briggs, S., 2015. Holiday in Morecambe and its history. [online] Available at: http://www.stuartbriggs.co.uk/holiday-in-morecambe-
and-its-history/ [Accessed 15 March 2017].
8 Office for National Statistics, 2013. A Profile of Deprivation in Larger English Seaside Destinations, 2007 and 2010. [online]
Available at: http://webarchive.nationalarchives.gov.uk/20160105160709/http:/www.ons.gov.uk/ons/dcp171766_324196.pdf
[Accessed 15 March 2017].
9 Office for National Statistics, 2013. A Profile of Deprivation in Larger English Seaside Destinations, 2007 and 2010. [online]
Available at: http://webarchive.nationalarchives.gov.uk/20160105160709/http:/www.ons.gov.uk/ons/dcp171766_324196.pdf
[Accessed 15 March 2017].
10 Office for National Statistics, 2013. A Profile of Deprivation in Larger English Seaside Destinations, 2007 and 2010. [online]
Available at: http://webarchive.nationalarchives.gov.uk/20160105160709/http:/www.ons.gov.uk/ons/dcp171766_324196.pdf
[Accessed 15 March 2017].
11 Poverty.org.uk., 2017. Social exclusion - The Poverty Site. [online] Available at:
http://www.poverty.org.uk/summary/social%20exclusion.shtml#note3 [Accessed 15 March 2017].
12 Poverty.org.uk., 2017. Social exclusion - The Poverty Site. [online] Available at:
6 | Richardson InstituteUK, people in relative poverty live in households with income below 60% of the median household income.
The 2013 median household income in the UK 2013 is £28,024.13 The median household income in Barrow-
in-Furness is £22,685, in South Lakeland is £25,780. 14 Cumbria is a low pay economy where employees tend to be
paid lower wages, particular for part-time employment.15 In 2015, the percentage of jobs in Lancaster not paying the
living wage was 26.9%, compared to 23% in the UK.16 Many areas in towns such Barrow-in-Furness, Morecambe,
Fleetwood, Heysham and Lancaster are among most 10% to 40% deprived areas in England, according to the Indices
of Deprivation 2015.17 These statistics indicate the extent of low income and relative poverty in Morecambe Bay.
The indicators of relative poverty include no access to a vehicle, not being able to pay for energy bills and fuel
for vehicle, joblessness and ill health. 18 Barrow-in-Furness has a very high rate on poverty indicators: 16.8% of
households earn less than £10000 per year, 19.8% are workless, and 29.9% don’t have access to a vehicle. 19 Many
villages in South Lakeland are also suffering from deprivation. 20 Experiencing relative poverty, many people in Barrow-
in-Furness suffer from poor housing, poor diet and poor quality of life. 21
Cumbria County Council has attempted to tackle relative poverty by promoting the living wage, supporting
people to access well-paid employment as well as bringing together services that support people on low incomes such
as crisis support and money advice. 22 Charities such as Citizens Advice North Lancashire and Christian Against
Poverty offer advice and support for people in relative poverty.
Absolute poverty
In the World Summit on Social Development in Copenhagen in 1995, absolute poverty was defined as “a
condition characterised by severe deprivation of basic human needs, including food, safe drinking water, sanitation
facilities, health, shelter, education and information. It depends not only on income but also on access to services” 23.
This is absolute in the sense that it is measured relative to a fixed standard of living, rather than the rest of the
population. However, this definition is not used by UK government to define poverty since it is used as a measurable
system based on disposable household income (see relative poverty above).
Income can be measured before or after housing cost are deducted. Poverty levels tend to be higher based on
income measured after housing costs, because poorer households tend to spend a higher proportion of their income
on housing. Over the longer-term, there has been a reduction in poverty rates since the late 1990s for children,
pensioners and working-age parents, although the likelihood of being in relative low income has increased for working-
age adults without dependent children24.
According to the House of Commons briefing paper on poverty in the UK, the rate of absolute low income after
housing costs is projected to stay flat to 2020/21.25 However, the Institute for Fiscal Studies estimates the proportion
of children in absolute low income will increase by around 3% points to 30% in 2021/22. 26 All of the increase in
absolute child poverty is attributed to the impact of tax and benefit reforms. 27
http://www.poverty.org.uk/summary/social%20exclusion.shtml#note3 [Accessed 15 March 2017].
13 Parliament.uk., 2008. [online] Researchbriefings.parliament.uk. Available at:
http://researchbriefings.parliament.uk/ResearchBriefing/Summary/SN07096 [Accessed 15 March 2017].
14 Parliament.uk., 2008. [online] Researchbriefings.parliament.uk. Available at:
http://researchbriefings.parliament.uk/ResearchBriefing/Summary/SN07096 [Accessed 15 March 2017].
15 Cumbria Observatory, 2016. [online] Available at: https://www.cumbriaobservatory.org.uk/deprivation-further-information/
[Accessed 15 March 2017].
16 Lancashire.gov.uk., 2016. [online] Available at: http://www.lancashire.gov.uk/media/897300/the-living-wage-article.pdf
[Accessed 15 March 2017].
17 Open Data Blog, 2015. English Indices of Deprivation: map explorer, [online] OpenDataCommunities.org. Available at:
http://dclgapps.communities.gov.uk/imd/idmap.html [Accessed 15 March 2017].
18 Cumbria Observatory, 2016. [online] Available at: https://www.cumbriaobservatory.org.uk/deprivation-further-information/
[Accessed 15 March 2017].
19 Cumbria Observatory, 2016. [online] Available at: https://www.cumbriaobservatory.org.uk/deprivation-further-information/
[Accessed 15 March 2017].
20 Cumbria Observatory, 2016. [online] Available at: https://www.cumbriaobservatory.org.uk/deprivation-further-information/
[Accessed 15 March 2017].
21 Cumbria Observatory, 2016. [online] Available at: https://www.cumbriaobservatory.org.uk/deprivation-further-information/ pdf
[Accessed 15 March 2017].
22 Cumbria.gov.uk., 2014. [online] Available at: https://www.cumbria.gov.uk/eLibrary/Content/Internet/535/4177311347.pdf
[Accessed 15 March 2017].
23 Gordon, D. 2005 [pdf]] Available at: ttp://www.un.org/esa/socdev/unyin/documents/ydiDavidGordon_poverty.pdf
24 McGuinness, F. (2017). Poverty in the UK: statistics. House of Commons Briefing paper. House of Commons Library.3
25 McGuinness, F. (2017). Poverty in the UK: statistics. House of Commons Briefing paper. House of Commons Library.4
26 McGuinness, F. (2017). Poverty in the UK: statistics. House of Commons Briefing paper. House of Commons Library.4
27 McGuinness, F. (2017). Poverty in the UK: statistics. House of Commons Briefing paper. House of Commons Library.4
7 | Richardson InstituteChild poverty
The current measure and definition of child poverty is the Children in Low-Income Families Local Measure
which shows the proportion of children living in families in receipt of out-of-work (means-tested) benefits or in receipt
of tax credits where their reported income is less than 60 per cent of UK median income. 28 The impact of poverty for
children is life-long. Experiences of poverty can lead to long term harm on health and educational engagement,
affecting their prospects of employment, the quality of social relationships and can lead to low self-esteem and
intergenerational lack of aspiration.29
Many areas in Morecambe Bay display a substantial rate of child poverty. Percentage of children in poverty in
Barrow-in-Furness is 22%; in Morecambe is 21% and 18% in Lancaster. 30 The national average is 20.2%. 31 The
Children’s Society’s recent survey into children in poverty and free school meals estimated 1,100 children across
Furness who were in poverty but not eligible for free school meals. 32
Lancashire County Council recently launched Lancashire Children and Young People’s Trust, aiming to
improve the lives of children and young people. Action for children in Barrow-in-Furness helps disadvantaged children
through fostering, support for parents and intervening in case of neglect or abuse.
Fuel poverty
Fuel poverty is defined as a household that needs to spend more than 10% of income on fuel to reach a
standard of warmth. The adequate standard of warmth in the Morecambe Bay area is 21°C in the living room and
18°C in other occupied rooms.33 According to this definition, 11.3% of the households in Morecambe Bay were in
poverty in 2014, while the national average is 10.6%.34 This means that as many as one in eight households in
Morecambe and Lancaster are struggling to pay their heating cost. Lancaster County Council and the Cumbria
Observatory highlight that almost 7,000 people are suffering from fuel poverty, especially those living in the rural
areas. This may be caused by the high percentage of households without central heating. The national average is 3%
compared to 8% in Barrow-in-Furness.35
Migration-poverty
The Migration Observatory 2017 defines migrants as foreign-born, foreign nationals, or people who have
moved to the UK for a year or more. Migration has been included as a potential type of poverty due to the multiples
challenges and burdens that migrant households frequently must face. These include language barriers, the severing
of support networks to the low-paid and a lack of contract jobs. Morecambe Bay has a lower rate of immigrants than
the national average; 92.7% of its population are from the UK. 36 Although there are not many immigrants in the area,
there is a considerably big Eastern Europe community that should be taken into account when considering poverty in
relative terms, as they are often a target and suffer from racism and discrimination. 37
Health-poverty
28 Cumbriaobservatory.org.uk, 2017. Childpoverty. [online] Available at:
http://www.cumbriaobservatory.org.uk/antipoverty/childpoverty.asp [Accessed 15 May 2017].
29 Cumbria.gov.uk, 2017. Content. [online] Available at:
https://www.cumbria.gov.uk/eLibrary/Content/Internet/535/41773113514.pdf [Accessed 23 May 2017].
30 Barnardos.org.uk, 2017. [online] Available at: https://www.barnardos.org.uk/130212_ecp_local_report_final__2_.pdf [Accessed
23 May 2017].
31 Barnardos.org.uk, 2017. [online] Available at: https://www.barnardos.org.uk/130212_ecp_local_report_final__2_.pdf [Accessed
23 May 2017].
32 Cumbria.gov.uk [online] Available at: https://www.cumbria.gov.uk/eLibrary/Content/Internet/535/41773113514.pdf [Accessed
23 May 2017].
33Energy-uk.org.uk, 2017. Fuel-poverty [online] Available at: http://www.energy-uk.org.uk/policy/fuel-poverty.html [Accessed 15
March 2017].
34 Lancashire County Council’s Business Intelligence Team, 2016. Fuel poverty figures for 2014 and winter fuel payment statistics
for 2015/16. [pdf] Available at: http://www.lancashire.gov.uk/media/899668/fuel-poverty-2014-winter-fuel-payments-
2015to2016-article.pdf [Accessed 15 March 2017].
35 Lancashire County Council’s Business Intelligence Team, 2016. Fuel poverty figures for 2014 and winter fuel payment statistics
for 2015/16. [pdf] Available at: http://www.lancashire.gov.uk/media/899668/fuel-poverty-2014-winter-fuel-payments-
2015to2016-article.pdf [Accessed 15 March 2017].
36iLiveHere - Britain's worst places to live, 2017. [online] Available at: http://www.ilivehere.co.uk/statistics-morecambe-lancashire-
26319.html [Accessed 15 March 2017
37 Yakub Patel, Interview on poverty in Morecambe Bay. Lancaster, 17th February 2017
8 | Richardson InstituteThe World Health Organization defines health as a state of complete physical, mental and social well-being
and not merely the absence of disease or infirmity. 38 Thus, it is sensible to conclude that poverty is both a cause and a
consequence of poor health.39 This type of poverty encompasses many subcategories of poor people with additional
issues that may aggravate their well-being, such as those who are suffering from homelessness, or drug and alcohol
addiction issues. However, this reports looks at these categories as a whole and not through specific sub/categories
or individual issues. The percentage of people in the studied area that rated their health as “very good” is lower than
the national average. Furthermore, the average rating of health was “very bad”, higher than the national average.40
Economic deprivation
Economic deprivation is defined as the lack of sufficient income for people to play roles, participate in the
relationships, and take part in the accepted behaviour expected of them by society. 41 This type of poverty could be
measured by several indicators such as: economic activity rate, employment and unemployment and Incapacity
Benefits Claimants. According to these indicators, Morecambe Bay presents clear indications of deprivation since its
economic activity rate and employment rate are lower than the national average: 69.7% compared to 77.3% and
63.9% compared to 71.1% respectively. Surprisingly, the unemployment rate indicator shows than Lancaster is slightly
lower (7.6%) than the rest of England (7.8%). This information could be used to explain the high migration of young
people to urban areas due to the lack of jobs. Finally, Lancaster is in line with the national average in people claiming
incapacity benefits.42
Case Studies
To give a better insight to the specific causes and problems of poverty in Morecambe Bay, this section will
compare two of the most deprived areas of Morecambe Bay with two of the wealthiest towns in the studied area. As an
effect, economic and social inequalities between different areas of the Bay will become apparent.
Morecambe and Kendall
Morecambe, as other towns in the area, has relied heavily on seaside resort tourism. Seaside tourism was at
its peak from the early to mid-20th century. However, nowadays Morecambe suffers from a deep problem of structural
poverty since people increasingly choose to go abroad for their holidays. Moreover, there are other factors that have
also contributed to the town’s decline in tourism. Morecambe has lost two major holiday maker attractions: The West
End Pier through a storm in 1978 and the Central Pier in 1992. This fact contributed to the town’s decline in tourism.
Likewise, the local government reorganisation in 1974 pushed many resorts into larger districts that did not give them
priority. Morecambe was put under the jurisdiction of Lancaster city council, who paid little attention to developing
tourism in the town since it had its own problems from industrial decline and unemployment. 43 Tourism-oriented
projects in Morecambe Bay received limited funding compared to projects in Lancaster for example. 44
The decline of income in Morecambe has affected the population and the town itself. Some historical
buildings are in ruin, there are many empty houses and the recreational and leisure businesses, such as cinemas, are
closing. Also, there are several poverty indicators that suggest that Morecambe is one of the most deprived areas of
the UK.
Kendal is the third largest town in Cumbria just behind Carlisle and Barrow-in-Furness. Although a relatively
38 Huber, M., et al., 2017. How should we define health?. BMJ, 343(Jul26 2), D4163-d4163.
39 Health Poverty Action, 2017. [online] Available at: https://www.healthpovertyaction.org/info-and-resources/the-cycle-of-poverty-
and-poor-health/key-facts/ [Accessed 15 March 2017].
40 iLiveHere - Britain's worst places to live, 2017. [online] Available at: http://www.ilivehere.co.uk/statistics-morecambe-lancashire-
26319.html [Accessed 15 March 2017].
41 Cuizon, G., 2017. Economic Deprivation [online] Available at: http://www.bukisa.com/articles/14003_economic-deprivation
[Accessed 15 March 2017].
42 Neighbourhood.statistics.gov.uk, 2017. [online] Available at:
http://www.neighbourhood.statistics.gov.uk/dissemination/LeadTableView.do?a=7&b=6095491&c&e=4&g=1&i=1001x1003x100
4&m=0&r=1&s=1489616694683&enc=1&dsFamilyId=1204&nsjs=true&nsck=false&nssvg=false&nswid=1366 [Accessed 15
March 2017].
43 Heathcote, E., 2017. Boom and bust. Independent, [online] Available at: http://www.independent.co.uk/news/business/boom-
and-bust-a-tale-of-two-resorts-blackpool-and-morecambe-may-be-neighbours-but-economically-they-1537916.html [Accessed 15
March 2017].
44 Ibid.
9 | Richardson Institutesmall town, it is an important commercial centre for a wide area thanks to its rural location. It is affectionately referred
to as "The Gateway to The Lakes". Kendal is famous for the “Kendal mint cake” and for Tobacco and Snuff production.
Today it is known largely as a centre of tourism due its castle. Furthermore, its economy also relies on the IT and
design sector.
Life expectancy
The life expectancy in Morecambe compared to the life expectancy of the highest area of the country shows a
stark reality. The life expectancy of men in Morecambe is 74 years old compared to a life expectancy of 93 years old in
other areas. Likewise, women live an average of 81 years old in Morecambe. This is 14 years less than those who live
in the richest areas of the UK.45 In Kendal, the life expectancy of men is 80 years; 6 years more than in Morecambe.
The women’s life expectancy in Kendal is 83 years; 2 years more than Morecambe. 46
Child Poverty, working age and pensioner poverty
Child poverty is another factor that shows the level of poverty. 30% of the children in Morecambe are in
poverty. This data correlates with both the large number of people in working age (24%) which are in poverty and the
number of pensioner (30%) which are also in poverty.47 These same indicators reveal that Kendal has to face another
reality. 7% of the Children are in poverty. The percentage of people at working age in poverty is 8% and pensioner in
poverty 12%.48
Education and social housing
Other indicators suggest that Morecambe is an underprivileged town, with a high percentage of people with
no qualifications (30%) and a significant number of people in social housing (10%). 49 Kendal also shows higher levels
of educated people since the percentage of citizens with no qualification is 24%. However, the percentage of social
housing is higher than in Morecambe (11%). 50
Crime
Morecambe presents an important level of crime compared to Kendal. While in March of 2017 Kendal had 7
crime incidents51 in total among 28,586 population, Morecambe that same month had 37 incidents 52 among a
population of 34,768. This means that Kendal has a crime every 4,083 people whilst Morecambe has a crime every
939 people.
Environment
Morecambe exhibits a poor quality physical environment. Many of the buildings are falling apart. Many shops
are shuttered and it lacks recreational places. Nevertheless, Kendal is a well taken care of town with many cultural
and recreational activities and places such as museums, galleries, cinemas, theatres amd Europe’s biggest festival of
mountain cultures.53
Barrow-in-Furness and Grange-over-Sands
Barrow-in-Furness (Barrow) is a town and borough in Cumbria. In the 19th century, Barrow was the biggest
45 Church Urban Fund, 2017. [online] Available at: https://www.cuf.org.uk/ [Accessed 15 March 2017].
46 Ibid
47 Ibid
48 Ibid
49 Ibid
50 Ibid
51 Thelancasterandmorecambecitizen.co.uk, 2017. Crime in Morecambe. [online] Available at:
http://www.thelancasterandmorecambecitizen.co.uk/li/crime.in.Morecambe/ [Accessed 24 May 2017].
52 Thelancasterandmorecambecitizen.co.uk, 2017. Crime in Kendal [online] Available at:
http://www.thelancasterandmorecambecitizen.co.uk/li/crime.in.Kendal/ [Accessed 24 May 2017].
53 Dyckhoff, T. 2017. Let’s move to… Kendal, Cumbria. TheGuardian. [online] Available at:
https://www.theguardian.com/money/2009/jul/18/lets-move-kendal-cumbria [Accessed 24 May 2017].
10 | Richardson Instituteiron and steel centre in the world and a major ship-building force, providing military ships and submarines. 54 However,
the town has been in a decline since the mid 20th century due to the exhaustion of all hematite deposits and the
decrease in military spending. The workforce shrank from 14,500 in 1990 to 5,800 in February 1995, with overall
unemployment in the town rising over that period from 4.6% to 10%.55 In the present day, manufacturing remains the
largest employment in area, with 33% of male employment in Barrow being in manufacturing and engineering (the
majority with BAE systems).56 Barrow is the only district in Cumbria among the 50 most deprived districts in the
Country.57 Cumbria contains eight areas² ranked among the 3% most deprived in England and of these, six are in
Barrow.58
Grange-over-sands (Grange) is a town in South Lakeland District. It is part of the County Palatine of Lancashire
and is part of the Duchy of Lancaster.59 From a small fishing village, the town developed in the Victorian era into a
popular seaside resort with the arrival of the Furness Railway in 1887. The 20th century saw further expansion of the
town and its facilities including spa hotels, gardens, and an extension of the promenade. The town now has a strong
independent retail sector and demand for shop units now outstrips supply.60
Among 37 of England’s smaller seaside towns, Grange is one of the areas with the least economic problems. 61 It is
among the 40% least deprived areas across the country. 62
Employment Deprivation
According to The Indices of Deprivation 2015, Barrow is the 189th most deprived area in the country (out of
32844 areas).63 19.8% of the local population is unemployed, compared with 14.4% nationwide. 64 Barrow has 20%
fewer Higher and Intermediate managerial, administrative or professional households than the national average.65
Grange is the 17,812th most deprived area. The rate of unemployment in Grange-Over-Sands was 0.4% in 2007, both
lower than the average for Cumbria and lower than the national average, suggesting that finding a job in this area may
be easier than most places. The rate of claiming any form of welfare payment (which includes in work benefits) is more
than 10% lower in Grange-Over-Sands than the national average, suggesting higher salaries than the average in the
area.66
Income Deprivation
In Barrow, the Median Household Income is £22,835, compared to £29,000 nationwide (2012). 67 16.8% of
54 Visit Cumbria (2017). Barrow-in-Furness. [online] Visit Cumbria. Available at: https://www.visitcumbria.com/sl/barrow-in-furness/
[Accessed 2 Jun. 2017].
55 Office for National Statistics, 2013. A Profile of Deprivation in Larger English Seaside Destinations, 2007 and 2010. [online]
Available at: http://webarchive.nationalarchives.gov.uk/20160105160709/http:/www.ons.gov.uk/ons/dcp171766_324196.pdf
[Accessed 15 March 2017].
56 The Economist (2013). The last of the metal-bashers. [online] Economist.com. Available at:
http://www.economist.com/news/britain/21574513-odd-corners-country-british-industry-clings-last-metal-bashers [Accessed 2
Jun. 2017].
57 visitcumbria.com. [online] Available at: http://www.visitcumbria.com/sl/barrow-in-furness/ [Accessed 23 May 2017].
58 visitcumbria.com., 2017. Barrow-in-Furness. [online] Available at: http://www.visitcumbria.com/sl/barrow-in-furness/ [Accessed
23 May 2017].
59 ilivehere.co.uk., 2010. Statistics Barrow-in-Furness. [online] Available at: http://www.ilivehere.co.uk/statistics-barrow-in-furness-
cumbria-2585.html [Accessed 23 May 2017].
60 Apho.org.uk., 2017. Public Health England - GOV.UK. [online] Available at:
http://www.apho.org.uk/resource/view.aspx?RID=142128 [Accessed 23 May 2017].
61 Cumbria.gov.uk., 2017. Community Learning and Skills : Cumbria County Council. [online] Available at:
https://www.cumbria.gov.uk/learningandskills/ [Accessed 23 May 2017].
62 Btp-cumbria.co.uk., 2017. Barrow Training Partnership | BTP Cumbria | Construction Industry Training And Assessment. [online]
Available at: http://www.btp-cumbria.co.uk/ [Accessed 23 May 2017].
63 Indices of Deprivation explorer. [online] Available at: http://dclgapps.communities.gov.uk/imd/idmap.html [Accessed 23 May
2017].
64 Cumbria.gov.uk, 2017. [pdf] Available at:
https://www.cumbria.gov.uk/elibrary/Content/Internet/538/755/1929/42116163528.pdf [Accessed 23 May 2017].
65 ilivehere.co.uk., 2010. Statistics Barrow-in-Furness [online] Available at: http://www.ilivehere.co.uk/statistics-barrow-in-furness-
cumbria-2585.html [Accessed 23 May 2017].
66 Findahood, 2017. The top ten crime hotspots for North West England[online] Available at:
https://www.findahood.com/articles/crime/the-top-ten-crime-hotspots-for-north-west-england/107 [Accessed 23 May 2017].
67 Office for National Statistics, 2013. A Profile of Deprivation in Larger English Seaside Destinations, 2007 and 2010. [online]
Available at: http://webarchive.nationalarchives.gov.uk/20160105160709/http:/www.ons.gov.uk/ons/dcp171766_324196.pdf
[Accessed 15 March 2017].
11 | Richardson Institutethe local population earns less than £10,000 per year. 68 The rate of claiming any welfare payment (which includes in
work benefits) is more than 25% higher in Barrow-in-Furness than the national average.69
In Grange, 5.7% of all people live in income deprivation (England average = 13.5%). 18.8% of households earn below
60% of the median income (England Average = 21.5%).
Education, Skills, and Training
Barrow-in-Furness has a high level of residents with either no qualifications or qualifications equal to 1 or
more GCSE at grade D or below, compared to the national average. 70 There are frequent community learning and
skills events in Cumbria by Cumbria County Council, ranging from Glass Fusion Workshop, Functional Skills Maths to
Business Administration.71 There are also courses and programmes such as Construction Industry Training by Barrow
Training Partnership from 2004 in Cumbria. 72
Grange has a lower than national average level of residents with either no qualifications or qualifications
equal to 1 or more GCSE at grade D or below. It also has a high level of residents with a higher education qualification
than the national average, suggesting that the residents of Grange are better educated than the average England
citizen.73
Health and Disability
The NHS identified Barrow as having significantly worse figures than the England average in terms of health
deprivation, over 65s ‘not in good health and life expectancy. 74 In Year 6, 21.5% (136) of children are classified as
obese.75 The rate of alcohol related harm hospital stays was 908, worse than the average for England. 76 The rate of
self-harm hospital stays was 372.9, worse than the average for England.77 The rate of smoking related deaths was
346, worse than the average for England.78 Estimated levels of adult smoking are worse than the England average. 79
Yet, rates of sexually transmitted infections, people killed and seriously injured on roads and TB are lower than
average.80 The percentage of residents in Grange rating their health as 'very good' in the 2011 Census is less than the
national average (46.75% compared to 47.17%). The percentage of people with ‘very bad’ health is also lower (0.96%
compared to 1.25%).81
68 ilivehere.co.uk., 2010. Barrow-in-Furness [online] Available at: http://www.ilivehere.co.uk/statistics-barrow-in-furness-cumbria-
2585.html [Accessed 23 May 2017].
69 ilivehere.co.uk., 2010. Barrow-in-Furness [online] Available at: http://www.ilivehere.co.uk/statistics-barrow-in-furness-cumbria-
2585.html [Accessed 23 May 2017].
70 ilivehere.co.uk., 2010. Barrow-in-Furness [online] Available at: http://www.ilivehere.co.uk/statistics-barrow-in-furness-cumbria-
2585.html [Accessed 23 May 2017].
71 Cumbria.gov.uk., 2017. Community Learning and Skills : Cumbria County Council. [online] Available at:
https://www.cumbria.gov.uk/learningandskills/ [Accessed 23 May 2017].
72 Btp-cumbria.co.uk., 2017. Barrow Training Partnership | BTP Cumbria | Construction Industry Training And Assessment. [online]
Available at: http://www.btp-cumbria.co.uk/ [Accessed 23 May 2017].
73 Findahood, 2017. The top ten crime hotspots for North West England [online] Available at:
https://www.findahood.com/articles/crime/the-top-ten-crime-hotspots-for-north-west-england/107 [Accessed 23 May 2017].
74 Office for National Statistics, 2013. A Profile of Deprivation in Larger English Seaside Destinations, 2007 and 2010. [online]
Available at: http://webarchive.nationalarchives.gov.uk/20160105160709/http:/www.ons.gov.uk/ons/dcp171766_324196.pdf
[Accessed 15 March 2017].
75 Apho.org.uk., 2017. Public Health England - GOV.UK. [online] Available at:
http://www.apho.org.uk/resource/view.aspx?RID=142128 [Accessed 23 May 2017].
76 Apho.org.uk., 2017. Public Health England - GOV.UK. [online] Available at:
http://www.apho.org.uk/resource/view.aspx?RID=142128 [Accessed 23 May 2017].
77 OpenDataCommunities, 2015. English Indices of Deprivation: map explorer. [online] Available at:
http://dclgapps.communities.gov.uk/imd/idmap.html [Accessed 15 Mar. 2017].
78 Apho.org.uk., 2017. Public Health England - GOV.UK. [online] Available at:
http://www.apho.org.uk/resource/view.aspx?RID=142128 [Accessed 23 May 2017].
79 Apho.org.uk., 2017. Public Health England - GOV.UK. [online] Available at:
http://www.apho.org.uk/resource/view.aspx?RID=142128 [Accessed 23 May 2017].
80 Apho.org.uk., 2017. Public Health England - GOV.UK. [online] Available at:
http://www.apho.org.uk/resource/view.aspx?RID=142128 [Accessed 23 May 2017].
81 Apho.org.uk., 2017. Public Health England - GOV.UK. [online] Available at:
http://www.apho.org.uk/resource/view.aspx?RID=142128 [Accessed 23 May 2017].
12 | Richardson InstituteCrime
Barrow rates 8th in the top ten areas for crime in North West England (2014). 82 Barrow's busiest shopping
street, Dalton Road, comes out as the third most likely street for crime to happen in the county. 83
Living Environment
Barrow has areas with a poor quality physical environment and where housing is in low demand, especially in
the town centre.84 Grange has a strong environment with a distinct sense of space. However, there are weaknesses
with regard to traffic, parking, pedestrian comfort and connections with the promenade. 85
Child Poverty
Child poverty is a problem in Barrow, with 23.66% of children living in poverty after housing costs.86 Head
teachers in Barrow reported a generation of children with poor diets, lacking warm coats and fitted shoes, living in cold
homes and not having adequate PE/swimming kits 87. In Grange, 12.8% of children live in poverty after housing
costs.88
What these case studies show us is that there are significant areas of inequality across Morecambe Bay.
Some areas are well-off with good local economies and low levels of poverty and associated problems. However, other
areas are in dire need of assistance to improve the local economy and the wellbeing of the people in those areas.
Statutory Authorities
The areas in Morecambe Bay are governed by a three tier authority: the County level, the City level and the
Town level. The area is also covered by four local authority districts: Wyre; Lancaster; South Lakeland and Barrow-in-
Furness.89 Moreover, Morecambe Bay has its own NHS trust that crosses over several administrative borders.
The mentioned councils and local authorities have some responsibility in tackling the poverty situation in Morecambe
Bay, with the NHS having an impact upon poverty through dealing with, and improving the lives of many people in
poverty. This section will explore the different initiatives available by statutory authority such as Fire Service, police
and NHS, as well as in the Lancashire County Council and the Cumbria County Council, which cover areas of
Morecambe Bay.
Fire Service
Lancashire Fire and Rescue Service90 (LFRS) work to mitigate the effect of fuel poverty, which is when fuel
costs are above the national median, as this can have adverse health effects, winter deaths, and rise in fire risk from
people using alternative unsafe methods of heating. LFRS runs annual winter safety campaigns in order to help those
most affected by fuel poverty, and the most vulnerable are offered a free Home Fire Safety Check.
82 Findahood, 2017. The top ten crime hotspots for the North West England [online] Available at:
https://www.findahood.com/articles/crime/the-top-ten-crime-hotspots-for-north-west-england/107 [Accessed 23 May 2017].
83 Nwemail.co.uk., 2017. Revealed eight Barrow streets ranked in Cumbrias top 30 crime hot spots. North-West EveningMail,
[online] Available at: http://www.nwemail.co.uk/news/barrow/Revealed-Eight-Barrow-streets-ranked-in-Cumbrias-top-30-crime-hot-
spots-43ecfc46-9487-4642-b1f0-cc350937e9bc-ds [Accessed 23 May 2017].
84 Cumbria.gov.uk., 2017. [online] Available at: https://www.cumbria.gov.uk/elibrary/Content/Internet/536/41794164147.pdf
[Accessed 23 May 2017].
85 Nwemail.co.uk., 2017. Revealed eight Barrow streets ranked in Cumbrias top 30 crime hot spots. North-West EveningMail,
[online] Available at: http://www.nwemail.co.uk/news/barrow/Revealed-Eight-Barrow-streets-ranked-in-Cumbrias-top-30-crime-hot-
spots-43ecfc46-9487-4642-b1f0-cc350937e9bc-ds [Accessed 23 May 2017].
86 Office for National Statistics, (2013). A Profile of Deprivation in Larger English Seaside Destinations, 2007 and 2010. [pdf]
Available at: http://webarchive.nationalarchives.gov.uk/20160105160709/http:/www.ons.gov.uk/ons/dcp171766_324196.pdf
[Accessed 15 March 2017].
87 Cumbria.gov.uk., 2017. [pdf] Available at: https://www.cumbria.gov.uk/elibrary/Content/Internet/536/41794164147.pdf
[Accessed 23 May 2017].
88 Apho.org.uk., 2017. Public Health England - GOV.UK. [online] Available at:
http://www.apho.org.uk/resource/view.aspx?RID=142128 [Accessed 23 May 2017].
89 Child and Poverty Action Group (2009). ONS Map UK local authorities 2009. [online] Available at:
http://www.cpag.org.uk/sites/default/files/ONS%20Map%20UK%20local%20authorities%202009.pdf [Accessed 2 Jun. 2017].
90 Lancashire Fire and Rescue Service. 2016. Lancashire Fire and Rescue Service Strategic Assessment of Risk 2016. [pdf]
Available at: https://lancsfirerescue.org.uk [Accessed 3 June 2017].
13 | Richardson InstituteThe Cumbria Fire and Rescue Service91 will tackle issues related to poverty through:
● Working with partners to tackle root causes of inequality through the Community Safety Partnerships, which is
a statutory body made of Councilors and independent people that work together to make the area safer.
● Reduce the economic and social impact of fires in non-residential premises.
As there is lack of detailed information on their role in tackling poverty, there cannot be an assessment on whether
they follow the PTC’s adage.
Police
Cumbria Constabulary is involved in tackling poverty by providing help for the Cumbria Children and Young
People’s Plan92 by ensuring wellbeing of first time entrants in the criminal system, ensuring the wellbeing of children in
custody and providing local authority accommodation for children.
The local police force play a key role in mediating and regulating crime associated with some of the more extreme
forms of poverty faced in the area. Overall Cumbria faces relatively less crime in comparison to Lancashire and indeed
the rest of the United Kingdom, though the area is diverse in its dispersion of rural and urban areas. 93
Cumbria Constabulary interacts with communities dealing with poverty through initiatives such as:
● Non-emergency mental health support.
● “Do the Right Thing” anti-sexual violence campaign.
● Antisocial behaviour and substance abuse prevention.
● Alcohol diversion schemes provided in conjunction with TTC 2000 Ltd aimed at mitigating the causes of
alcoholism and addiction.
● Cumbria Community Messaging consortium of neighbourhood and community watch schemes aimed at
bringing areas together to prevent crime.
Cumbria Constabulary actively supervise the Morecambe Bay NHS Foundation Trust and are bound to put
information about their activities and crimes in the area online and so are a valuable, though less explored authority to
understand the link between poverty, community and crime.94
Information on the police’s involvement in tackling poverty is limited, therefore it is unclear whether they adhere by the
PTC’s adage.
NHS
The NHS looks to reduce health inequality, which can often lead to increased poverty, so the NHS is part of
economic and social policy. They offer:
● Free mental health services.
● Primary care for everyone.
● Aid in the implementation of the Cumbria Health and Wellbeing Strategy.
Moreover, the NHS runs Better Care Together for the Morecambe Bay Health Community95, which include:
Improved consistency and quality of care, both in and out of hospital.
91 Cumbria Fire and Rescue Service. Integrated Risk Management Plan 2016-2020. [pdf] Available at
https://cumbria.gov.uk [Accessed 3 June 2017].
92 Cumbria Children’s Trust. Cumbria Children and Young People’s Plan 2016-19. [pdf] Available at: https://cumbria.gov.uk
[Accessed 3 June 2017].
93 Police.uk. Cumbria Constabulary. [online] Available at: https://www.police.uk/cumbria [Accessed 16 March 2017].
94 Cumbria Constabulary. Services. [online] Available at: https://www.cumbria.police.uk/Services [Accessed 16 March 2017].
95 NHS. 2016. New care models: Vanguards – developing a blueprint for the future of NHS and care services. [pdf] Available at:
https://www.england.nhs.uk [Accessed 3 June 2017].
14 | Richardson Institute People to be cared for as close to home as they can be, with hospitals concentrating on those patients who
need specialist treatment or emergency care.
A health system with exciting and innovative teams working together.
There is not much detailed information on how they tackle poverty, therefore it is unclear whether they satisfy
the PTC’s adage.
Lancashire County Council
One initiative launched by Lancashire County Council to combat poverty is the Lancashire Children and Young
People's Trust. This is a key partnership that has the aim to improve the lives of children and young people, and
therefore tackles child poverty. The Trust has set out a 3-year strategy, the Children and Young People's Plan 2014-17,
which has children and young people in the driving seat, as they provide feedback about what they would like to see in
the future of Lancashire; in this sense, it fulfils the PTC adage in part. The Trust helps in the commission of services to
help and support young people in the county.
The things that the County will do are:
Develop and deliver integrated services so that children and young people receive effective and timely early
help and protection.
Work alongside families so that they can build their resilience and cope better.
Ensure that the right children and young people become looked after and manage the increase in demand
whilst delivering safe child protection.
Develop and embed early support approach so that families can access coherent support through
multiagency hubs.
Ensure that travelling on roads is as safe as possible for children and young people.
Ensure that children and young people can develop the skills, experiences and aspirations to be successful in
the future workforce.
Support parents so that they can better help their children to fulfil their potential.
Ensure that young people leaving care receive the support they need.
Implement the SEND reforms so that children and young people with special educational needs or disabilities
receive effective care and support.
Ensure that support is available for vulnerable children and young people so that they can perform well in
education. Understand child poverty in Lancashire and target resources and support to those in most need.
Use the Healthy Child Programme as a basis for their activity.
Ensure that mother have a healthy pregnancy.
Reduce infant mortality.
Reduce the number of emergency admissions due to asthma, diabetes and epilepsy.
Ensure that children and young people can access a range of quality sports activities.
Ensure that the way they provide support to children and young people is driven by what they tell them.
Ensure that children and young people are listened to, practice is focused on their needs and experiences
and influenced by their wishes and their feelings or, where they cannot represent their view themselves, that
these are advocated for upon their behalf.
Moreover, Lancashire Council supports other community projects, such as the West End Million Partnership
15 | Richardson Institutecharity. Similarly, Lancaster City Council, ' leads on the physical regeneration initiatives in the West End 96'
Overall, it appears that the Lancashire County Council fulfils the PTC adage to some extent, as it consults the
people it is meant to help in order to know what services to provide. However, they do not seem to be in any decision-
making role within the Council, and this is the reason it falls short of the adage.
Cumbria County Council
Cumbria County Council has also taken steps to reduce the poverty in the region. As a commitment to this, it
formulated a Cumbria County Council Anti-Poverty Strategy 2014-17.97 Their strategy is to run activities and services
that will enable the local people to use local assets and resources to their advantage. Its priorities are to maximise
household income, build community resilience and to tackle child poverty in the area. The type of poverty they tackle,
therefore are child poverty and economic deprivation.
It will achieve its aims through the implementation of certain methods:
Maximising household income – this will involve supporting people to access well paid employment,
promoting the living wage and introducing a living wage within the Council. The Council will also bring together
services that support people on low incomes, including crisis support, money advice and advocacy under the
Director of Public Health.
Building community resilience – this will involve offering basic budgeting skills, supporting social enterprises
in areas with high levels of poverty, establishing toy libraries and supporting people to grow their own food or
save money by reducing food waste. The Council will also support people to develop personal resilience so
that they can mitigate the effects that poverty might have on their lives.
Tackling child poverty – this will involve the continued narrowing of the educational attainment gap between
children in poverty and the county average, free school meals to 5-7 year olds, and the new free early years
nursery offer to 2 year olds.
Another way that the Council is tackling poverty is through health; it commissioned the Cumbria Health and
Well-being Strategy 2016-1998. The main challenges it seeks to address are the health and wellbeing gap, the care
and quality gap and the funding and efficiency gap. This strategy, therefore, deals with health poverty. Health
inequality is very evident in Cumbria, as life expectancy in the county is lower than the England average 99, with life
expectancy being 9.5 years lower for men and 7.3 years lower for women in the most deprived areas of Cumbria than
in the least deprived areas. This disproportion can be linked to poverty, as individuals in the most deprived area
generally do not have the right conditions for a good life and often suffer from low income and higher levels of smoking
and drinking. Some of the strategies that will be employed to achieve this include an economic plan for economic
growth, improving the environment to include green spaces and active play areas, and mobilising communities.
One of the desired outcomes is that children have the best start in life. Cumbria County Council aim to
achieve this by:
Tackling childhood obesity, this is related to poverty because families from poorer backgrounds do not always
have enough money to prepare healthy meals and might only be able to afford meals with poor nutrition –
this will involve gathering data on trends of childhood obesity and inform the local services that cater to
children about the findings, implementing the Active Cumbria Early Years Programme by providing sport and
96 West End Million Community, 2017. [pdf] Available at: http://westendmillion.co.uk/wem-comm-prof-v2.4.pdf, [Accessed 15
March 2017]
97 Cumbria County Council, 2017. Anti-Poverty Strategy 2014-17. [online] Available at:
https://www.cumbria.gov.uk/eLibrary/Content/Internet/535/4177311347.pdf [Accessed 5 March 2017].
98 Cumbria County Council, 2017. Health & Wellbeing Strategy 2016-19. [online] Available at:
http://www.cumbriaccg.nhs.uk/news/2015/october/HealthandWellbeingStrategy-Oct2015/healthwellbeingstrategy.pdf [Accessed
05 March 2017].
99 Public Health England, 2015. Cumbria County Health Profile 2015. [online]
http://www.apho.org.uk/resource/item.aspx?RID=171649 [Accessed 05 March 2017].
16 | Richardson Institutephysical activities to the communities, having, and the Continuation of Smile4Life in Children’s Centres to
promote good oral health.
Improving the mental wellbeing of children and young people, this is related to poverty because children from
poorer backgrounds tend to suffer more from mental health issues and feel less optimistic about their
future100 – the County will work to understand the mental health needs of children and young people and
make sure they are able to access help, make sure that children and young people as well as their parents
are contributing to the design and delivery of these services and that the workforce is trained adequately 101, it
will work to improve access to specialist services and enhance fast-track access to Child and Adolescent
Mental Health Services (CAMHS) for Looked After Children, it will also develop a multi-agency maternal mental
health pathway.
Another desired outcome of the Strategy is for adults to lead healthy and fulfilling lives. This will enable them
to contribute more to the workforce and it will be achieved through:
Reducing unhealthy levels of alcohol consumption – to achieve this, the Council will deliver the Cumbria
Alcohol Strategy by making sure that families can find support for alcohol issues and providing drug and
alcohol awareness to young people102, develop alcohol harm reduction plans, develop an alcohol related
harm pathway through The Health and Social Wellbeing System, develop communications plan in conjunction
with National campaigns to reduce alcohol related harm, and increase the quantity of unsafe drinkers
accessing the Unity Substance Misuse Service in Cumbria.
Reducing the prevalence of smoking – measures to achieve this will be through developing smoking
cessation activity through the 6 Local Health and Wellbeing Forums, promoting and delivering community
pharmacy based smoking cessation services throughout Cumbria as part of the Health and Social Wellbeing
System, developing structured communications plans to maximise National Campaigns aimed at reducing
smoking prevalence
Tackling obesity – this will be achieved by delivering weight management programmes, developing actions
targeted at reducing obesity through the 6 Local Health and Wellbeing Forums, developing structured
communications plans to maximise National Campaigns aimed at reducing obesity, promoting Physical
Activity Care Pathway for adults to include previously operated Exercise on Referral Scheme, encouraging
employees of targeted businesses to become more physically active and healthy through the Active
Workplace awards.
Improving the mental health and wellbeing of adults - support people with low level mental health problems
through the Health and Social Wellbeing System, improve access to mental health assessment and support
for people experiencing a mental health issue.
100Ayer,D. (2016). Poor Mental Health. 1st ed. The Children's Society. Available at:
https://www.childrenssociety.org.uk/sites/default/files/poor_mental_health_report.pdf [Accessed 05 June 2017]
101 Cumbria County Council, Cumbria Transformation Plan Final V.03. [pdf] Available at:
http://councilportal.cumbria.gov.uk/documents/s45673/Appendix%201%20HWBB%201.12.15%20CAHMS%20Transformation%2
0Plan.pdf [Accessed 15 March 2017].
102 Cumbria County Council, Cumbria Alcohol Strategy. [pdf] Available at:
http://councilportal.cumbria.gov.uk/documents/s25322/Draft%20Cumbria%20Alcohol%20Strategy%20FINAL.pdf [Accessed 15
March 2017].
17 | Richardson InstituteYou can also read