Portofolio Optimization Through MPT on any Economic Situation on Indonesian Stock Exchange (2010-2020)
←
→
Page content transcription
If your browser does not render page correctly, please read the page content below

Journal of Physics: Conference Series

PAPER • OPEN ACCESS

Portofolio Optimization Through MPT on any Economic Situation on
Indonesian Stock Exchange (2010-2020)
To cite this article: M Rosha and Arnellis 2021 J. Phys.: Conf. Ser. 1742 012016

View the article online for updates and enhancements.

                               This content was downloaded from IP address 46.4.80.155 on 06/07/2021 at 07:52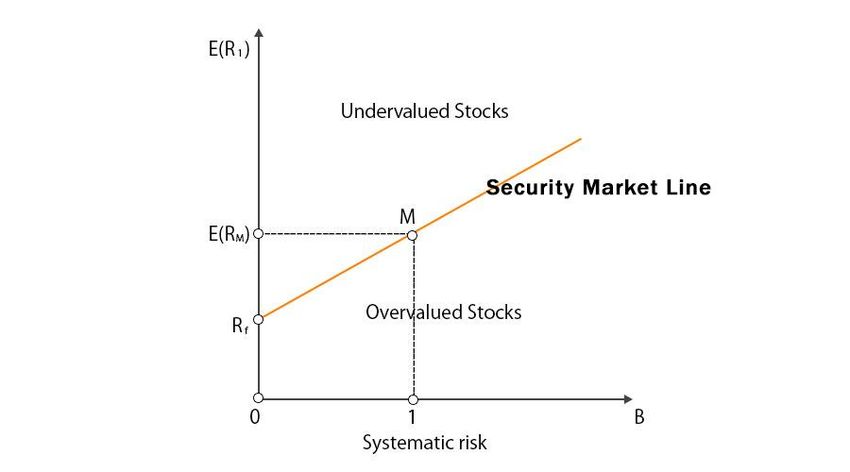
ICM2E 2020                                                                                                      IOP Publishing
Journal of Physics: Conference Series                         1742 (2021) 012016          doi:10.1088/1742-6596/1742/1/012016

Portofolio Optimization Through MPT on any Economic
Situation on Indonesian Stock Exchange (2010-2020)

                     M Rosha1*, Arnellis2
                     1,2
                        Department of Mathematics, Universitas Negeri Padang, Padang City, Indonesia

                     *corresponding author: mediarosha_mat@fmipa.unp.ac.id

                     Abstract. Modern portfolio theory told us that investors are tend to optimize the expected
                     return of investment subject to a target of risk perception. In the real world, risks are depend on
                     may factors, such as systematic risk (market risk and macroeconomics risk which can not be
                     controlled to diversification) and non-systematic risk (specific company risk which can not be
                     controlled through diversification). Applying Security Market Line Approach, constrained
                     maximization and considering changes in economic situation between 2010-2020, we found
                     that Modern Portfolio Theory can improve portfolio performance when limited impact is
                     spotted on minimizing systematic risk of portfolio.

1. Introduction
Investment is an activity conducted by economic agent to maintain the asset value against dropping
value of money (inflation) and as a form of wealth accumulation. Maximizing investment return is the
sole target of any investment activity. As economic agent delay their today’s consumption and keep
the money in the other form (investment), improving wealth is the main target of this activity.
    In relations to investment activity, economic agent invest their money in Portfolio, which defined
as pool of funds which invest in wide range of investment product, which in this paper will be
specifically doing analysis in stock market. Currently Indonesia Stock Exchange (IDX) have more
than 500 listed companies which will be an option for the investment activity. Everyday, professional
investment manager and retail investor face many possibilities of market movement and investment
choice.
    During the investment process, investor could pick one of so many available investment approach.
In general, we have two analysis of stock market. The first is fundamental analysis which dig deeper
the underlying situation of the company. The second method, we have technical analysis who analyze
price pattern and momentum of the stock price.
    In practice, Investment Manager performance is measured in the return of the investment and the
risk. Good performance is associated with appropriate return for every risk added to the portfolio.
High return investment but followed by high risk may not be considered as a good investment, while
smaller return investment with low risk could be considered as good investment is the ratio is oke. In
this research, we will analyze one of the option to optimized the portfolio value, through Modern
Portfolio Theory, Capital Asset Pricing Model and Security Market Line.
    Modern Portfolio Theory tell us about maximizing optimum investment result subject to specific
desired risk level (portfolio return mean-variance). In this theory, investor should not invest only in
one instrument, but spread out the portfolio in several instrument to lower the risk profile of portfolio
              Content from this work may be used under the terms of the Creative Commons Attribution 3.0 licence. Any further distribution
              of this work must maintain attribution to the author(s) and the title of the work, journal citation and DOI.
Published under licence by IOP Publishing Ltd                          1
ICM2E 2020 IOP Publishing Journal of Physics: Conference Series 1742 (2021) 012016 doi:10.1088/1742-6596/1742/1/012016 In this theory, every investment instrument has their own properties and specific correlation with market and between the instrument. MPT assume that investors are tend to have risk aversion in nature, which means when investor faced several investment set who have similar profile of expected return, investor will put their money into investment set who has lower overall risk profile. Effort made by investors to minimized the risk are called diversification. By definition, Diversification is a risk management strategy that mixed a variety of investments within a portfolio. A diversified portfolio contains a mix of distinct asset types and investment in an attempt at limiting exposure to any single asset or risk. The rationale behind this is that a portfolio constructed of different kinds of assets will, on average, yield higher long-term returns and lower the risk of overall portfolio. Diversification should be considered good and necessary if correlation between instrument is less than one (
ICM2E 2020 IOP Publishing
Journal of Physics: Conference Series 1742 (2021) 012016 doi:10.1088/1742-6596/1742/1/012016
Cov ( Ri , Rm )
i = ( 4)
Var ( Rm )
Practically,expected return of investment is related with beta. The higher the beta, the higher
volatility of instrument, relative to overall market situation. The lower the beta, the lower the expected
return of the investment. Explantion on this situation will be de discussed on Security Market Line
Topic, which is application of CAPM.
Security Market Line (SML), is a graphic which explain the equation in Capital Asset Pricing
Model and explaining risk and return of instrument relative to systematic risk (Market Risk). The
application of graphical explanation on CAPM through SML could be explained below:
SML : E ( Ri ) = R f + i E ( Rm ) − R f ( 5 )
In the graphical explanation of the SML, Y axis is the expected return (Ri), while the X axis is the
systematic risk of the instrument, while the intercept (Rf) is the risk free rate (central bank interest rate
or government bond yield). Example of Security Market Line is explained below:
Figure 1. Security Market Line
The higher Beta of the instrument, the higher expected return required, vice versa. For stock market
picking criteria, the return of the stock should be higher than security market line to be considered
undervalued and worth investing. In the other hand, if the instrument return is below Security Market
Line, the investment is not to be considered as worthy as the return is not paying its expected
volatility.
2. Methods
In building the portfolio, we should define the target that aimed on the research. In this paper, we
divide the methods in four parts: 1. Defining the characteristic of every instrument, both in Beta,
Expected Return and Real Return for every year, 2. Defining the market expected return (Rm), 3.
Creating Security Market Line every year to define stock that are included on the portfolio, 4. Doing
optimization technique to create investment weighting. Here is the details of the methods:mathematics
anxiety questionnaire. The questionnaire was arranged by using the Likert Scale. We use the Pearson
correlation formula, SPSS, and Microsoft excel to analyze the data.
1. Defining the instrument characteristic. In this phase, we calculate Beta, expected
return and real return of each individual stock.
2. Defining market expected return. In this phase, we define market expected return by using
growth of stock market Index (IHSG) that year.
3. Creating Security Market Line. In this phase, we calculate the security market line for
every year and pick the stock based on the security market line, based on equation (5).
3ICM2E 2020 IOP Publishing
Journal of Physics: Conference Series 1742 (2021) 012016 doi:10.1088/1742-6596/1742/1/012016
Stock will be categorized as worth investing (to be included on portfolio) or not worth
investing (not to be included on portfolio).
4. Portfolio Optimization. In this phase, based on the worth investing phase we found in 3rd
phase, we create optimization model based on the Modern Portfolio Theory (maximizing
expected return subject to constraint). In this case, we use market β as a constraint.
In this research, we optimize portfolio assuming β =1 to create a portfolio which perfectly have similar
volatility level with stock market but with optimized return.
3. Results and Discussions
In this research, we pick the optimum portfolio out of 100 largest stock in Jakarta Composite Index
(IHSG). 100 largest stock is a category used by major fund manager on defining ready to invest stock
as largest stock tend to have better liquidity profile. Here is the list of 100 largest stock by market
capitalization in Jakarta Composite Index.
No. Code No. Code No. Code No. Code No. Code
1 BBCA 21 MEGA 41 BDMN 61 NISP 81 SLIS
2 BBRI 22 INKP 42 EXCL 62 BBTN 82 APIC
3 UNVR 23 DNET 43 PTBA 63 KAEF 83 MEDC
4 TLKM 24 MAYA 44 RMBA 64 BSDE 84 POWR
5 BMRI 25 INTP 45 TCPI 65 DSSA 85 ASMI
6 ASII 26 BYAN 46 AALI 66 MKPI 86 ITMG
7 HMSP 27 EMTK 47 CASA 67 JPFA 87 GOOD
8 TPIA 28 INCO 48 SIDO 68 CTRA 88 STTP
9 ICBP 29 ADRO 49 TKIM 69 ISAT 89 INAF
10 SMMA 30 MDKA 50 BNGA 70 MNCN 90 HEAL
11 CPIN 31 BNLI 51 ULTJ 71 LIFE 91 BRIS
12 BBNI 32 MIKA 52 FREN 72 CARE 92 SMRA
13 GGRM 33 PGAS 53 ANTM 73 IPTV 93 BBKP
14 UNTR 34 POLL 54 MLBI 74 AKRA 94 SMAR
15 BRPT 35 ARTO 55 PWON 75 MAPI 95 PLIN
16 KLBF 36 BTPS 56 PNBN 76 WIKA 96 BJTM
17 INDF 37 AMRT 57 BTPN 77 DMAS 97 DMND
18 SMGR 38 TBIG 58 BNII 78 IBST 98 BSIM
19 MYOR 39 JSMR 59 SCMA 79 LPKR 99 WSKT
20 TOWR 40 ACES 60 FASW 80 BJBR 100 KPIG
Figure 2. 100 Largest Stock in Indonesia Stock Exchange
In the stock picking for optimum portfolio, we have to include also change in yearly economic
variable such as risk free rate and market return during period of the reserch (2010-2019). On this
case, we mention the details of those variable value below:
4ICM2E 2020 IOP Publishing
Journal of Physics: Conference Series 1742 (2021) 012016 doi:10.1088/1742-6596/1742/1/012016
2010 2011 2012 2013 2014 2015 2016 2017 2018 2019
Em (Market Return), % 43.8 -0.4 11.9 -1.0 24.4 -20.3 16.2 24.3 0.2 1.9
Rf (Risk Free Rate), % 7.6 6.0 5.2 8.5 7.8 9.0 7.7 6.3 8.0 7.1
GDP Growth, % 6.1 6.2 6.0 5.6 5.0 4.9 5.0 5.1 5.2 5.0
Inflation, % 6.7 3.8 3.7 8.1 8.4 3.4 3.0 3.6 3.1 2.7
Real Interest Rate 0.9 2.2 1.5 0.4 -0.6 5.6 4.6 2.7 4.9 4.3
Figure 3. Stock Market Return and Economic Indikator, 2010-2019
From the data, we could see that market return move in volatile manner. The general tendency is,
when GDP growth higher and Real Interest Rate lower, stock market return tend to be higher, vice
versa. It indicates the overall trend on systematic risk in the system which relate to Capital Asset
Pricing Model, but do not explain the stock picking, as we need to define expected return of each
instrument.
As an early part of the research, we conduct calculation of expected return of each stock using
Capital Asset Pricing model. The first pahse is by calculating the value of the stock beta. We get Beta
by doing linier regression between daily stock market return as independent variable and specific stock
retun as dependent variable, as formulated below:
Cov ( Ri , Rm )
i =
Var ( Rm )
Based on the calculation, we find the yearly Beta of each stock as follows:
5ICM2E 2020 IOP Publishing
Journal of Physics: Conference Series 1742 (2021) 012016 doi:10.1088/1742-6596/1742/1/012016
Figure 4.Stock Beta, 2010-2019
Post Beta calculation, by knowing the market return, risk free rate and beta, we could
calculate the expected return of each instrument. The result as follows:
6ICM2E 2020 IOP Publishing
Journal of Physics: Conference Series 1742 (2021) 012016 doi:10.1088/1742-6596/1742/1/012016
Figure 5.Stock Expected Return, 2010-2019
After that, we calculate position for each stock at Security Market Line, by calculating difference
between the return and expected return (Real Return – Ri). Stock with real return higher than the
expected is qualified to be included on the portfolio. The details is below, with negative value means
the stock is not qualified for the portfolio at the specific years.
7ICM2E 2020 IOP Publishing
Journal of Physics: Conference Series 1742 (2021) 012016 doi:10.1088/1742-6596/1742/1/012016
Figure 6.Stock Excess Return, 2010-2019
After getting the qualified stock, we start to conduct optimization function as below:
Max E ( Rp ) = wi E ( Ri ) s.t. =1
i
Stock picking conducted by assuming portfolio beta should be equal to market (β = 1). From the
optimization, we get the weighting of investment for each year as below:
8ICM2E 2020 IOP Publishing
Journal of Physics: Conference Series 1742 (2021) 012016 doi:10.1088/1742-6596/1742/1/012016
9ICM2E 2020 IOP Publishing
Journal of Physics: Conference Series 1742 (2021) 012016 doi:10.1088/1742-6596/1742/1/012016
Figure 7. Weighting of Selected Stock, 2010-2019
Based on the calculation above, we get the portfolio return in 2010-2019 reflected in table below.
Figure 8. Comparison between portfolio return and market return, 2010-2019
4. Conclusion
From the results above, we can conclude that:
1. Applying the modern portofolio theory and CPAM CPAM could reduce the risk profile of
portfolio and add return enhancement as overall return is above market benchmark
2. The portfolio could reduce the unsystematic risk as return edged higher at lower volatility.
3. Systematic risk in term of Beta could be lower, but the overall correlation between return
of portfolio and overall market remain high, providing indication that we can not fight
agains some economic downturn, such us downturn during current market volatility
4. We need to recalibrate and upgrade the Portfolio Model periodically to sustain long-term
superior return.
10ICM2E 2020 IOP Publishing
Journal of Physics: Conference Series 1742 (2021) 012016 doi:10.1088/1742-6596/1742/1/012016
References
[1] Ahmad, Kamaruddin, 1996 Dasar – Dasar ManajemenInvestasi. RinekaCipta
[2] Ang, Robert, 1997 BukuPintar Pasar Modal Indonesia. Mediasoft Indonesia
[3] Darmadji,T danFakhrudin, H.M., 2001 Pasar Modal Di Indonesia. EdisiPertama. Jakarta:
SalembaEmpat
[4] Fabozzi, Frank J., 2003 Capital Market Institution and Instrument, New Jersey, Prentice Hall
[5] Husnan, Suad, 1994 Dasar – Dasar TeoriPortofolio dan AnalisisSekuritas. PenerbitAMP YKPN
[6] Martalena, 2011 Instrumen Pasar Modal.Penerbit Andi
[7] Nasuha, Rizky. 2013 AnalisisMetode Capital Asset Pricing Model Dalam Upaya Pengambilan
Keputusan Terhadap Investasi Saham. Jurnal Administrasi Bisnis (JAB), Universitas
Brawijaya
[8] Rosha, Media, 2018 Value of Perfect Information IN Stock Picking, ICOMSET-3, Padang
[9] Tandelilin, Eduardus, 2010 Analisis Investasi dan ManajemenPortofolioEdisiPertama. BPFE
11You can also read


