Pore- and Core-Scale Insights of Nanoparticle-Stabilized Foam for CO2-Enhanced Oil Recovery - MDPI
←
→
Page content transcription
If your browser does not render page correctly, please read the page content below
nanomaterials

Article
Pore- and Core-Scale Insights of
Nanoparticle-Stabilized Foam for
CO2-Enhanced Oil Recovery
Zachary Paul Alcorn 1, *, Tore Føyen 1,2 , Jarand Gauteplass 1 , Benyamine Benali 1 ,
Aleksandra Soyke 1 and Martin Fernø 1
 1   Department of Physics and Technology, University of Bergen, 5007 Bergen, Norway; tore.foyen@uib.no (T.F.);
     Jarand.Gauteplass@uib.no (J.G.); Benyamine.benali@uib.no (B.B.); aleksandra.soyke@uib.no (A.S.);
     Martin.Ferno@uib.no (M.F.)
 2   SINTEF Industry, 7034 Trondheim, Norway
 *   Correspondence: zachary.alcorn@uib.no

 Received: 4 September 2020; Accepted: 17 September 2020; Published: 25 September 2020

 Abstract: Nanoparticles have gained attention for increasing the stability of surfactant-based foams during
 CO2 foam-enhanced oil recovery (EOR) and CO2 storage. However, the behavior and displacement
 mechanisms of hybrid nanoparticle–surfactant foam formulations at reservoir conditions are not well
 understood. This work presents a pore- to core-scale characterization of hybrid nanoparticle–surfactant
 foaming solutions for CO2 EOR and the associated CO2 storage. The primary objective was to identify
 the dominant foam generation mechanisms and determine the role of nanoparticles for stabilizing CO2
 foam and reducing CO2 mobility. In addition, we shed light on the influence of oil on foam generation
 and stability. We present pore- and core-scale experimental results, in the absence and presence of oil,
 comparing the hybrid foaming solution to foam stabilized by only surfactants or nanoparticles. Snap-off
 was identified as the primary foam generation mechanism in high-pressure micromodels with secondary
 foam generation by leave behind. During continuous CO2 injection, gas channels developed through
 the foam and the texture coarsened. In the absence of oil, including nanoparticles in the surfactant-laden
 foaming solutions did not result in a more stable foam or clearly affect the apparent viscosity of the foam.
 Foaming solutions containing only nanoparticles generated little to no foam, highlighting the dominance
 of surfactant as the main foam generator. In addition, foam generation and strength were not sensitive
 to nanoparticle concentration when used together with the selected surfactant. In experiments with oil
 at miscible conditions, foam was readily generated using all the tested foaming solutions. Core-scale
 foam-apparent viscosities with oil were nearly three times as high as experiments without oil present
 due to the development of stable oil/water emulsions and their combined effect with foam for reducing
 CO2 mobility

 Keywords: nanoparticles; foam; CO2 EOR; CO2 mobility control

1. Introduction
     An energy transition to a net-zero society is a global challenge in need of affordable, low-risk
technologies. Carbon capture, utilization and storage (CCUS) is a crucial technology for substantial
emission cuts for many energy-intensive industries to achieve the ambitious climate goals of the Paris
Agreement [1]. CCUS involves capturing CO2 from industrial sources and injecting it into subsurface
reservoirs for simultaneous storage and energy production, via CO2 -enhanced oil recovery (EOR).
Permanent CO2 storage coupled with CO2 EOR can provide affordable and reliable energy for our
developing world while reducing the life-cycle carbon emissions of fossil fuels.

Nanomaterials 2020, 10, 1917; doi:10.3390/nano10101917                      www.mdpi.com/journal/nanomaterials
Nanomaterials 2020, 10, 1917                                                                         2 of 15

     CO2 EOR has been developed and widely implemented over the past 50 years. CO2 is an
excellent solvent in EOR processes because it is miscible with most crude oils at reservoir conditions.
Above miscibility conditions, CO2 swells the oil and reduces its viscosity resulting in increased recovery.
Laboratory corefloods have reported high microscopic displacement efficiency and oil recoveries of
nearly 100% [2]. However, field-scale operations often report lower than expected recoveries due to
poor sweep efficiency and high CO2 mobility [3,4]. These issues stem from reservoir heterogeneity and
the low viscosity and density of CO2 compared to reservoir fluids.
     CO2 foam can mitigate the impacts of high CO2 mobility and reservoir heterogeneity by effectively
increasing CO2 viscosity, reducing its relative permeability and diverting CO2 flow from high
permeability zones [5]. CO2 foam is generated in porous media by injecting foaming solution with
CO2 , either simultaneously or in alternating slugs. The foam is a dispersion of CO2 in liquid where
stable liquid films, called lamellae, block some of the pathways for CO2 flow [6]. Lamellae are
commonly stabilized by surfactants. However, surfactant-stabilized foams can break down in the
reservoir due to surfactant adsorption, the presence of oil, and at elevated temperatures and salinities.
Therefore, their ability to reduce CO2 mobility can be limited. The addition of silica nanoparticles to
the surfactant-stabilized CO2 foam has been shown to increase the strength and stability of the foam
system and provide increased oil recovery [7,8].
     Spherical silica nanoparticles are the most commonly used for EOR applications [9]. They are
particles with a size up to 100 nm with intrinsic properties different from those found in the bulk of the
material due to their high surface-to-volume ratio. Stable emulsions are generated using nanoparticles
because a rigid monolayer is formed on the droplet surface and the particles are irreversibly attached
to the interface. These emulsions may withstand high-temperature reservoir conditions without
agglomeration and the nanoparticles may be further surface-treated to improve stability in harsh
conditions. In addition, the small size of the particles, two orders of magnitude smaller than colloidal
particles, make them suitable for flow through small pore throats in rock [10,11].
     Whether stabilized by surfactants, nanoparticles, or a combination of both, bulk foams are typically
composed of bubbles smaller than the containers they are within whereas foam in porous media
is composed of bubbles about the same size or larger as the pore space [12]. For foam to generate,
lamella creation must exceed lamella destruction. Capillary forces dominate lamella creation by three
main mechanisms: leave behind, snap-off and lamella division [5,13].
     An issue with foam for EOR applications is the impact of oil on foam (lamellae) stability.
Many studies report that oil hinders foam generation and can destabilize already generated
foam [14–16]. However, these findings are mostly based upon bulk tests at immiscible conditions
with surfactant-stabilized foam, which may not necessarily represent foam in porous media and at
miscible conditions for CO2 and oil. In any case, foam behavior in the presence of oil involves several
interactions between the foam, oil, and rock, which may be either detrimental or beneficial to the foam
process [17,18]. These interactions include emulsification–imbibition, pseudo emulsions, and entering
and spreading [19,20].
     In the absence of oil, foam coalescence can reduce the number of bubbles by two mechanisms:
texture (bubble size) coarsening by diffusion, often referred to as Ostwald ripening, or capillary
suction drainage [21]. Diffusion occurs by the transport of gas from smaller bubbles to larger bubbles,
with lower internal pressure, which results in fewer bubbles [22,23]. Capillary suction drainage occurs
when the water saturation approaches a saturation value where the lamellae are no longer stable,
as the capillary pressure exceeds the maximum disjoining pressure of the foam film and drains the
lamellae [24,25].
     The majority of earlier work has focused on foam generation and the coalescence of
surfactant-stabilized CO2 foams in the absence and presence of oil at immiscible conditions. However,
much less is known about the role of nanoparticles in the absence and presence of oil at miscible
conditions. Thus, this study aimed to thoroughly characterize the dominant foam generation
mechanisms and determine the role of nanoparticles for stabilizing CO2 foam and reducing CO2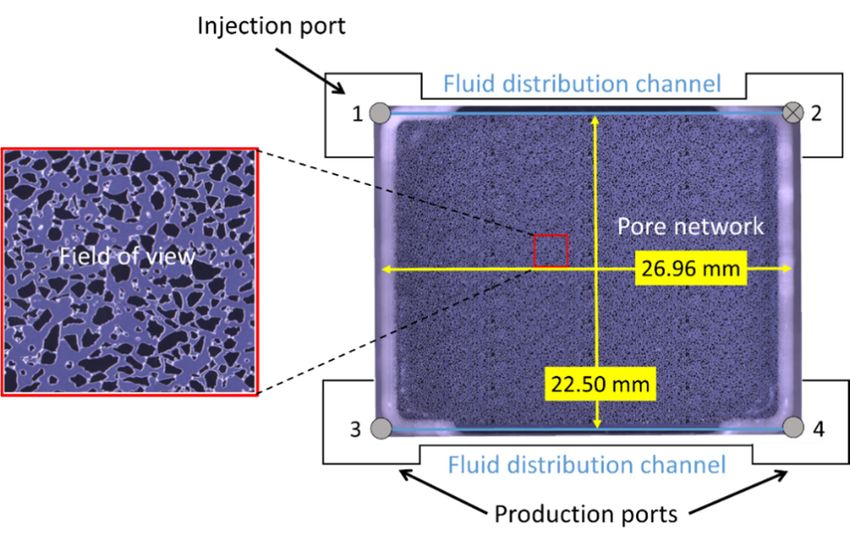
Nanomaterials 2020, 10, 1917                                                                                                                                       3 of 15

mobility. In addition, we shed light on the influence of oil on foam generation and stability. We present
a pore- to core-scale characterization of hybrid nanoparticle–surfactant foam formulation for CO2
mobility control for CO2 EOR and CO2 storage. Experimental results compared the hybrid foaming
solution to foam stabilized by only surfactant or nanoparticles, in the presence and absence of oil.

2. Materials and Procedures

2.1. Pore-Scale System
     Two foaming agents were used to study foam generation, stability and coalescence. One was
a nonionic surfactant (Huntsman Surfonic L24-22, Houston, TX, USA), a linear ethoxylated alcohol.
The other foaming agent was a surface-modified spherical silica nanoparticle (Nouryon Levasil CC301,
Amsterdam, The Netherlands). Foaming solutions were made by dissolving each foaming agent,
either separately or combined, in 35,000 ppm NaCl brine at the concentrations shown in Table 1.
CO2 with 99.999% purity was used. The pore space was cleaned between injection cycles using
2-proponal-water azeotrope (IPA). For experiments in the presence of oil, a refined oil (n-Decane, C10 H22 )
was used to obtain first-contact miscibility with CO2 .

              Table 1. Composition of the foaming solutions used in pore- and core-scale experiments.

          Foaming Agents                                           Concentration, Component                                                            Scale
         Nanoparticle (NP)                                           1500 ppm, Levasil CC301                                                           Pore
                                                                    3500 ppm, Surfonic L24-22                                                          Core
            Surfactant (SF)
                                                                    5000 ppm, Surfonic L24-22
                                                                                                                                                   Pore and Core
                                              3500 ppm, Surfonic L24-22 + 1500 ppm, Levasil CC301
                                              5000 ppm, Surfonic L24-22 + 1500 ppm, Levasil CC301
         Hybrid (SF + NP)                                                                                                                              Pore
                                              5000 ppm, Surfonic L24-22 + 150 ppm, Levasil CC301
                                              3500 ppm, Surfonic L24-22 + 150 ppm, Levasil CC301                                                       Core

     The micromodel was composed of a rectangular etched silicon wafer with an irregular porous
structure bonded to a transparent borosilicate glass with dimensions of 26.96 mm × 22.50 mm (Figure 1)
and a constant etching depth of 30 µm. The pore pattern was a simplified two-dimensional projection
of real pore structures with connected pores that allow flow with discontinuous, irregularly shaped
grains that provide tortuosity. The chemical composition of the crystalline silicon and borosilicate
glass are similar to sandstone and are chemically inert to the injected fluids. Complete manufacturing
procedures can be found elsewhere [26,27].
                              Nanomaterials 2020, 10, x FOR PEER REVIEW                                                                  4 of 15

                                   Figure 1. Dimensions of the micromodel, location of the flow ports and the fluid distribution channels.
      Figure 1. Dimensions       of the micromodel, location of the flow ports and the fluid distribution channels.
                             The focused field of view is shown on the left. Injection was into port 1 and production was from
      The focused field of ports
                             view      is 4.shown
                                   3 and     Port 2 wason   theTheleft.
                                                        closed.     entireInjection
                                                                           pore network was    into
                                                                                        consisted of 36port   1 and
                                                                                                       repetitions       production
                                                                                                                   of a single 749-       was from ports
                             grain pore pattern. The grain size distribution ranged from 100 to 79,000 μm and the pore throat
      3 and 4. Port 2 was closed.        The    entire     pore    network        consisted      of  36  repetitions
                             distribution ranged from 10 to 200 μm. The average pore throat length was 89 μm.               of  a   single 749-grain pore
      pattern. The grain    size distribution ranged from 100 to 79,000 µm and the pore throat distribution2
                       2.2. Pore-Scale Procedure
      ranged from 10 to 200  Theµm.       The average
                                   micromodel                   pore throat
                                                  system was pressurized           length
                                                                              to 100 bar usingwas     89 µm. system at 25 °C for
                                                                                                a backpressure
                              experiments in the absence and presence of oil. For experiments in the absence of oil, foaming
                              solution was first injected to completely saturate the micromodel before injecting dense (liquid) phase
                              CO2 at a constant volumetric flow rate of 4 μL/min. The foaming solutions consisted of 1500 ppm
                              nanoparticles, 5000 ppm surfactant, and two hybrid solutions with 5000 ppm surfactant combined
                              with 1500 ppm or 150 ppm nanoparticles. An overview of the foaming solutions are listed in Table 1.
                              A baseline, without foaming solution, was also conducted for comparison. For experiments in the
                              presence of oil, the micromodel was initially saturated with distilled water before injecting six pore
                              volumes of oil. Distilled water was then injected for an additional six pore volumes to achieve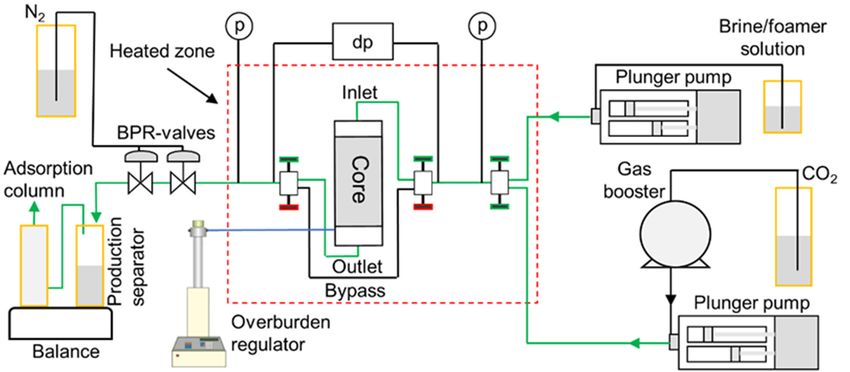
Nanomaterials 2020, 10, 1917                                                                      4 of 15

     The micromodel had a porosity of 61%, permeability of 3000 mD and pore volume (PV) of 11.1 µL.
The porous pattern (27,000 grains) had 36 (4 × 9) repetitions of a pore network with 749 unique grains.
The grain size distribution of the 749-grain pattern ranged between 100 and 79,000 µm2 and the pore
throat width distribution ranged from 10 to 200 µm. Flow ports were located at each corner of the
micromodel with the inlet at ports 1 and 2 and the outlet at ports 3 and 4. The micromodel was
positioned in the bottom part of a two-piece polyether ether ketone (PEEK) plastic micromodel holder.
The top part had an open window for direct visual observation. The micromodel holder was placed on a
motorized stage below a microscope (Axio Zoom. V16, Zeiss, Jena, Germany). The microscope software
controlled the zoom, focus, illuminator intensity, imaging, and the motorized stage. Additional details
on the micromodel set-up can be found in [28].

2.2. Pore-Scale Procedure
      The micromodel system was pressurized to 100 bar using a backpressure system at 25 ◦ C for
experiments in the absence and presence of oil. For experiments in the absence of oil, foaming solution
was first injected to completely saturate the micromodel before injecting dense (liquid) phase CO2 at a
constant volumetric flow rate of 4 µL/min. The foaming solutions consisted of 1500 ppm nanoparticles,
5000 ppm surfactant, and two hybrid solutions with 5000 ppm surfactant combined with 1500 ppm
or 150 ppm nanoparticles. An overview of the foaming solutions are listed in Table 1. A baseline,
without foaming solution, was also conducted for comparison. For experiments in the presence of oil,
the micromodel was initially saturated with distilled water before injecting six pore volumes of oil.
Distilled water was then injected for an additional six pore volumes to achieve residual oil saturation.
The micromodel was then saturated with the hybrid 3500 ppm surfactant and 1500 ppm nanoparticle
foaming solution before CO2 injection began at a constant rate of 1 µL/min. For all experiments,
CO2 was injected in port 1 (inlet), port 2 was closed and ports 3 and 4 (outlet) were open and kept at
100 bar using the backpressure system (Figure 1). The microscope settings (light intensity, aperture,
and shutter time) were optimized for image processing and remained constant. Images were acquired
of the entire micromodel with high spatial resolution (4.38 µm/pixel) by stitching multiple overlapping
images. The image acquisition time of the porous pattern (121 separate images) was 73 s. A focused
field of view was selected, which was representative of the remainder of the micromodel, for detailed
analysis and to minimize the capillary end effects. Raw images from the experiments show the grains
as dark and opaque and the pore space in a grayish-blue hue. The gas/liquid interfaces (lamellae) were
white due to the diffusive ring-illuminator of the microscope. Foam generation and coalescence were
also analyzed by utilizing the Python Library OpenCV [29] to identify bubble number and size.

2.3. Core-Scale System
     The core-scale experiments used the same brine as the pore-scale work. In experiments with only
surfactant in the foaming solution, a 3500 ppm or 5000 ppm concentration was used. In experiments
with the hybrid foaming solutions, a 3500 ppm surfactant concentration was used with either 1500 ppm
or 150 ppm nanoparticles to evaluate the concentration sensitivity for foam stabilization. See Table 1
for an overview of the foaming solutions. A single outcrop Bentheimer sandstone core was used for all
experiments to eliminate the impacts of variable core properties. The core was cleaned and dried before
being 100% saturated with brine under vacuum. Porosity and pore volumes were calculated based
on the weight differential before and after saturation. Absolute permeability was measured between
each experiment by injecting brine until a stable differential pressure was obtained for three different
injection rates. The permeability of the core was 1400 millidarcy with a porosity of 24% (Table 2).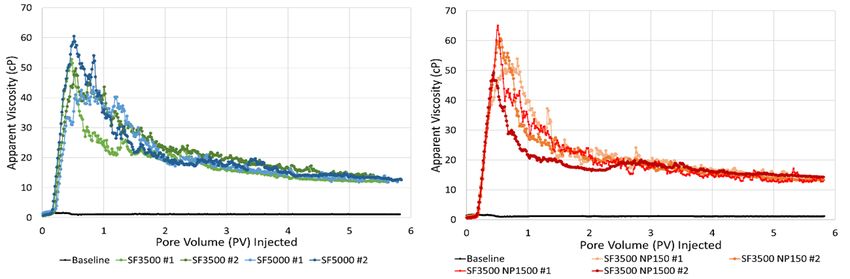
and dried before being 100% saturated with brine under vacuum. Porosity and pore volumes were
calculated based on the weight differential before and after saturation. Absolute permeability was
measured between each experiment by injecting brine until a stable differential pressure was
obtained for three different injection rates. The permeability of the core was 1400 millidarcy with a
Nanomaterials 2020, 10, 1917 5 of 15
porosity of 24% (Table 2).
Table2.2. Core
Table Coreproperties
propertiesof
ofthe
theBentheimer
Bentheimersandstone
sandstoneused
usedin
inthe
theexperimental
experimentalwork.
work.
Core
Core Properties
Properties ValueValue
Length (cm)
Length (cm)
24.624.6
± 0.01
± 0.01
Diameter
Diameter (cm)(cm) 3.643.64
± 0.01
± 0.01
Pore
Pore Volume
Volume (mL)(mL) 68.23
68.23
Porosity
Porosity 0.240.24
Permeability (mD) 1400
Permeability (mD) 1400
2.4.
2.4. Core-Scale
Core-Scale Procedure
Procedure
The
Thebrine-saturated
brine-saturatedsandstone
sandstone core
corewas wrapped
was wrappedin ain
0.1-mm thickthick
a 0.1-mm nickelnickel
foil tofoil
reduce the radial
to reduce the
CO diffusion
radial
2 CO2 diffusion into the confinement oil before installation into the Viton rubber sleeve.core
into the confinement oil before installation into the Viton rubber sleeve. The The was
core
then
was mounted
then mountedin a vertically oriented
in a vertically Hassler-type
oriented core holder
Hassler-type core and
holderplaced
and inside
placeda inside
heatinga cabinet.
heating
Experimental conditions were set to 40 ◦ C and 200 bar with a net overburden pressure of 70 bar.
cabinet. Experimental conditions were set to 40 °C and 200 bar with a net overburden pressure of 70
At these
bar. At conditions, CO2 is supercritical
these conditions, and has aand
CO2 is supercritical similar
has density
a similaras in the pore-scale
density as in the experiments.
pore-scale
A differential pressure transducer and two absolute pressure transducers monitored
experiments. A differential pressure transducer and two absolute pressure transducers monitored pressure response
at the inlet and outlet. Figure 2 shows the experimental set-up, modified from [30].
pressure response at the inlet and outlet. Figure 2 shows the experimental set-up, modified from [30].
Figure2.2. Experimental
Figure Experimental setup
setup used
used for
for the
the core-scale
core-scalefoam
foamexperiments.
experiments. Green
Green lines
lines indicate
indicate the
the fluid
fluid
flowdirections
flow directionsduring
duringthe
theinjection
injectionofofCO andthe
CO22and thefoaming
foamingsolution.
solution.Pure
PureCOCO22 was
was pressurized
pressurizedby byaa
gasbooster
gas boosterandandinjected
injectedusing
usingaaQuizix
QuizixQ6000-10k
Q6000-10kplunger
plungerpump.
pump. Foaming
Foamingsolutions
solutions were
wereinjected
injected
usingaaQuizix
using QuizixQ5000-10k
Q5000-10kplunger
plungerpump.
pump. Injection
Injection was
was performed
performed through
through aa series
seriesofofneedle
needlevalves
valves
(marked green for open, red for closed) to the top of the core. Produced fluids were
(marked green for open, red for closed) to the top of the core. Produced fluids were depressurized depressurized
downstreamthrough
downstream throughaaseries
seriesof
ofbackpressure
backpressureregulator
regulator(BPR)
(BPR)valves
valvesand
andmeasured
measuredin inthe
theproduction
production
separatorand
separator andassociated
associatedwater
wateradsorption
adsorptioncolumn
columnusing
usingaadigital
digitalbalance.
balance.Modified
Modifiedfromfrom[30].
[30].
Foam
Foam apparent
apparent viscosity
viscosity is
is aa measure
measureof offoam
foamgeneration,
generation, strength
strength and
and stability.
stability. An
An increase
increase in
in
apparent
apparentviscosity
viscosityindicates a generation
indicates a generationof foam
of and
foama higher
and avalue of apparent
higher value ofviscosity corresponds
apparent viscosity
to a stronger foam.
corresponds Foam apparent
to a stronger foam. Foam viscosity
apparent(µapp ) was quantified
viscosity ( ) wasfrom the experimental
quantified superficial
from the experimental
velocities and
superficial measured
velocities andpressure
measured drop [31] bydrop [31] by
pressure
k∇p (1)
µapp = (1)
where is the absolute permeability of the porousumedia,l + ug is the measured pressure gradient and
and are the superficial velocities of liquid and gas, respectively [32]. The effect of nanoparticles
where k is the absolute permeability of the porous media, ∇p is the measured pressure gradient and ul
and u g are the superficial velocities of liquid and gas, respectively [32]. The effect of nanoparticles on
foam strength and stability was evaluated by comparing dynamic experimental apparent viscosity
results using foaming solutions with and without nanoparticles.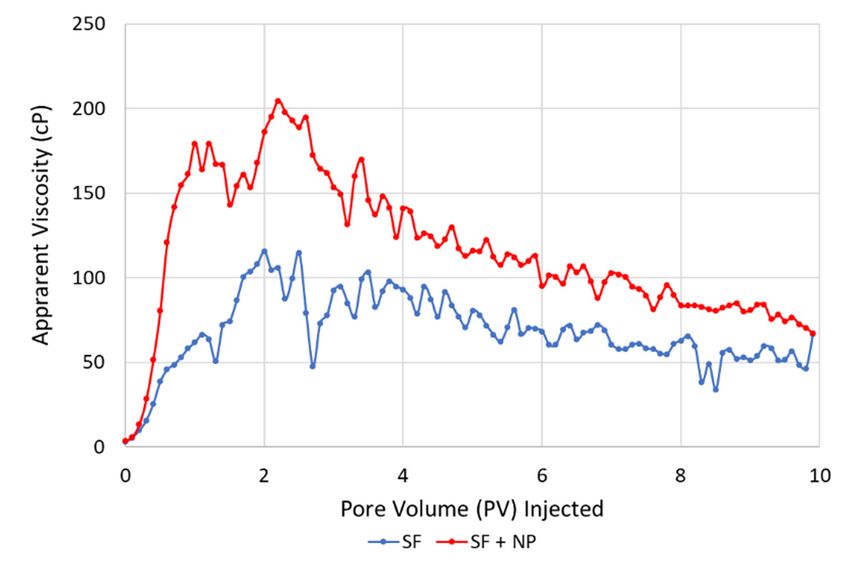
Nanomaterials 2020, 10, 1917                                                                          6 of 15

      The injection scheme for the core-scale experiments in the absence of oil was adapted from [33]. First,
a minimum of three PVs of foaming solution was injected to satisfy adsorption, displace the initial brine
and fully saturate the pore space. Then, CO2 was injected from the top of the vertically mounted core
at a superficial velocity of 4 ft/day for approximately six PVs. Unsteady state apparent foam viscosities
were calculated as a function of time (PVs injected) using Equation (1). A minimum of two experiments
were performed for each individual foaming solution. A baseline experiment, without foaming
solution, was also conducted for comparison. The core was cleaned between experiments by injecting
solutions of IPA before being re-saturated with brine and then foaming solution.
      The core-scale procedure in the presence of oil was developed to obtain approximately 30%
residual oil before evaluating foam generation and stability. First, a primary drainage with n-Decane
for nearly one PV was conducted followed by a waterflood for one PV. Foaming solution was then
injected for at least three PVs at a low and high rate. Finally, CO2 was continuously injected at 4 ft/day
for 10 to 14 PVs. A minimum of two experiments was performed for each individual foaming solution.

3. Results and Discussion

3.1. Pore-Scale: Foam in the Absence of Oil
      Figure 3 shows pore-scale images from four experiments with different foaming solutions.
Three time steps are shown which correspond to pre-foam generation (PV = 1.3), peak foam generation
and post-foam generation (PV = 20.1). The images show a focused field of view with CO2 injection
from the top to the bottom for each image. The dark opaque areas are grains, the grayish-blue open
areas are the pore space and the thin white films are lamellae.
      The experiment with only nanoparticles present (1500 NP) generated weak foam as indicated by
the continuous distribution of open flow paths and very few lamellae or bubbles (Figure 3, left column).
Thus, CO2 mobility remained high and was comparable to the baseline without any foaming agent.
CO2 injection with the three surfactant-laden foaming solutions resulted in the generation of densely
distributed, finely textured foam, which significantly reduced CO2 mobility during the peak foam
generation stage (5000 SF, 5000 SF + 1500 NP and 5000 SF + 150 NP). Individual bubbles were located
near the ends of pore throats and several bubbles filled individual pore bodies, suggesting snap-off as
the primary foam generation mechanism. Because the pore bodies had a larger area than the pore
throats, repeated snap-off occurred until the pore body was filled with bubbles, a phenomenon also
described by [34]. Dynamic observations also revealed many individual lamellae spanning across pore
throats. These lamellae may have formed from the leave-behind mechanism because CO2 was injected
into a surfactant saturated porous media in a drainage-like process. The rise in capillary pressure
during drainage can cause lamellae generation by both leave-behind and snap-off as gas enters the
pore network [35].
      Direct visual observations of the experiment with the hybrid foaming solution containing 5000 ppm
surfactant and 1500 ppm nanoparticles revealed a continuous open flow path for CO2 throughout the
duration of the experiment (Figure 3, red line, 5000 SF + 1500 NP). No lamellae impeded CO2 flow in
this region and the CO2 relative permeability was reduced by the presence of lamellae in the remainder
of the pore network. Therefore, within this focused field of view, a continuous gas-foam was generated.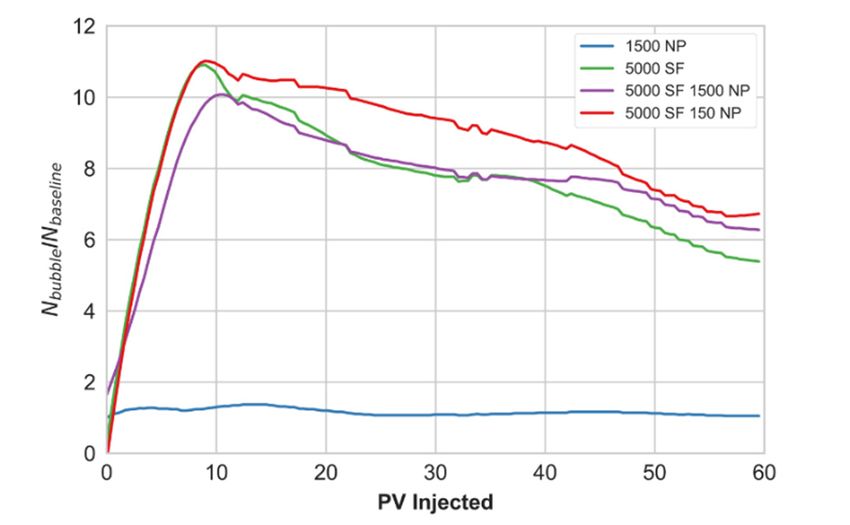
Nanomaterials 2020, 10, 1917 7 of 15
Nanomaterials 2020, 10, x FOR PEER REVIEW 7 of 15
FigureFigure 3. The
3. The pore-scale
pore-scale images
images of aoffocused
a focused field
field ofof viewduring
view duringthetheinjection
injection ofof dense
dense phase
phase CO
CO22 into
into a micromodel saturated with four different foaming solutions at 100 bar
a micromodel saturated with four different foaming solutions at 100 bar and 25 C. Experiments withand 25
◦ °C. Experiments
with foaming
different different foaming
solutions solutions are shown
are shown acrossacross the 1500
the top: top: 1500
ppmppm nanoparticles
nanoparticles (1500NP),
(1500 NP),5000
5000 ppm
ppm surfactant (5000 SF), hybrid 5000 ppm surfactant and 1500 ppm nanoparticles (5000 SF + 1500
surfactant (5000 SF), hybrid 5000 ppm surfactant and 1500 ppm nanoparticles (5000 SF + 1500 NP) and
NP) and hybrid 5000 ppm surfactant and 150 ppm nanoparticles (5000 SF + 150 NP). Injection was
hybrid 5000 ppm surfactant and 150 ppm nanoparticles (5000 SF + 150 NP). Injection was from top to
from top to bottom in each image. The dark opaque areas are grains, the grayish-blue open areas are
bottom in each image. The dark opaque areas are grains, the grayish-blue open areas are the pore space
the pore space and the thin white films are lamellae. Individual image dimensions are 2190 × 2190
and the
μm. thin whitesize
The grain films are from
ranged lamellae.
100 to Individual
79,000 μm image and thedimensions are 2190 ×ranged
pore throat distribution 2190 µm.
from The
10 tograin
size ranged from 100 to 79,000 µm 2 and the pore throat distribution ranged from 10 to 200 µm for the
200 μm for the entire micromodel.
entire micromodel.
Direct visual observations of the experiment with the hybrid foaming solution containing 5000
Figure
ppm 4 quantifies
surfactant the number
and 1500 of bubblesrevealed
ppm nanoparticles versus the bubble size
a continuous open forflow
the path
images for shown
CO2 in
Figure 3. Bubble number and size were used as indications of foam generation and strength where
throughout the duration of the experiment (Figure 3, red line, 5000 SF + 1500 NP). No lamellae
impeded
a higher bubbleCO2number
flow in this region and the
corresponded to CO 2 relative
a finer permeability
textured foam. was reduced by
All foaming the presence
solutions of
containing
lamellae in the remainder
surfactant-generated small bubbles of the
(≤10pore
3 µm network.
2 ) at theTherefore, within stage.
peak generation this focused field of view,
In the post-foam a
generation
continuous gas-foam was generated.
stage, the total number of bubbles decreased and their size increased; hence, the foam texture coarsened,
Figure 4 quantifies the number of bubbles versus the bubble size for the images shown in Figure
increasing CO2 mobility as CO2 was continuously injected. The hybrid foaming solutions with either
3. Bubble number and size were used as indications of foam generation and strength where a higher
1500 ppm or 150 ppm nanoparticles showed similar behavior, indicating that foam strength and stability
bubble number corresponded to a finer textured foam. All foaming solutions containing surfactant-
was not sensitive
generated smallto bubbles
nanoparticle
(≤103 µmconcentration
2) at the peakwhen usedstage.
generation togetherIn thewith the selected
post-foam surfactant.
generation stage,
Pore-scale foam behavior was also analyzed by examining the total
the total number of bubbles decreased and their size increased; hence, the foam texture coarsened, bubble number (Ni ) as a
function of theCO
increasing PV2 mobility
of CO2 injected.
as CO2 was The number ofinjected.
continuously bubbles during
The hybridfoam generation
foaming solutionsand
withcoalescence
either
(Nbubble
1500) were
ppm or normalized to baseline (N
150 ppm nanoparticles showed ) for the
baselinesimilar four foaming
behavior, indicating solutions.
that foam Figure 5 shows
strength and the
stability bubble
normalized was notnumber
sensitiveastoa nanoparticle
function of PV concentration
injected forwheneachusedfoamingtogether with the
solution for selected
the focused
field surfactant.
of view. Foam generation (as indicated by bubble number) increased from approximately 9 to
11 times the baseline for all foaming solutions. Peak foam generation was reached after approximately
seven PVs of the CO2 injected. After peak foam generation, the number of bubbles steadily decreased
from bubble coarsening as the dominant coalescence mechanism as observed in Figure 3. The hybrid
foaming solutions, containing nanoparticles and surfactant, had a limited impact on the number of
bubbles and foam stability during continuous CO2 injection.Nanomaterials 2020, 10, 1917 8 of 15
Nanomaterials 2020, 10, x FOR PEER REVIEW 8 of 15
Figure 4. The number of bubbles (Nbubble) versus bubble size for the micromodel experiments with
four different foaming solutions. Foaming solutions are shown across the top and include 1500 ppm
nanoparticles (1500 NP), 5000 ppm surfactant (5000 SF), hybrid 5000 ppm surfactant and 1500 ppm
nanoparticles (5000 SF + 1500 NP) and hybrid 5000 ppm surfactant and 150 ppm nanoparticles (5000
SF + 150 NP).
Pore-scale foam behavior was also analyzed by examining the total bubble number (Ni) as a
function of the PV of CO2 injected. The number of bubbles during foam generation and coalescence
(Nbubble) were normalized to baseline (Nbaseline) for the four foaming solutions. Figure 5 shows the
normalized bubble number as a function of PV injected for each foaming solution for the focused
field of view. Foam generation (as indicated by bubble number) increased from approximately 9 to
Figure 4.
Figure 4. The
The number
number ofof bubbles
bubbles(N
(Nbubble
bubble)) versus
versus bubble size
size for
bubblePeak for the micromodel
the micromodel experiments
experiments with
with
11 times the baseline for all foaming solutions. foam generation was reached after
four different
different foaming
foaming solutions.
solutions. Foaming solutions are shown across the top and include 1500 ppm
approximately seven PVs of the CO2 injected. After peak foam generation, the number of bubbles
nanoparticles (1500 NP), 5000 ppm surfactant (5000 SF), hybrid 5000 ppm surfactant and 1500 ppm ppm
steadily decreased from bubble coarsening as the dominant coalescence mechanism as observed in
nanoparticles (5000 SF++1500
(5000 SF NP)
1500 and
NP) hybrid
and 5000
hybrid ppmppm
5000 surfactant and and
surfactant 150 ppm nanoparticles
150 ppm (5000
nanoparticles
Figure 3. The hybrid foaming solutions, containing nanoparticles and surfactant, had a limited impact
(5000 SF +
SF + 150 NP).
150 NP).
on the number of bubbles and foam stability during continuous CO2 injection.
Pore-scale foam behavior was also analyzed by examining the total bubble number (Ni) as a
function of the PV of CO2 injected. The number of bubbles during foam generation and coalescence
(Nbubble) were normalized to baseline (Nbaseline) for the four foaming solutions. Figure 5 shows the
normalized bubble number as a function of PV injected for each foaming solution for the focused
field of view. Foam generation (as indicated by bubble number) increased from approximately 9 to
11 times the baseline for all foaming solutions. Peak foam generation was reached after
approximately seven PVs of the CO2 injected. After peak foam generation, the number of bubbles
steadily decreased from bubble coarsening as the dominant coalescence mechanism as observed in
Figure 3. The hybrid foaming solutions, containing nanoparticles and surfactant, had a limited impact
on the number of bubbles and foam stability during continuous CO2 injection.
Figure5.5.Development
Figure Developmentininnormalized
normalizedbubble
bubblenumber
numberas asaafunction
functionof
ofpore
porevolume
volume(PV)
(PV)injected
injectedusing
using
four different foaming solutions for the focused field of view. The blue curve represents the foaming
four different foaming solutions for the focused field of view. The blue curve represents the foaming
solution
solutionwith
with1500
1500ppm
ppmnanoparticles
nanoparticles(1500
(1500NP),
NP),the
thegreen
greencurve
curverepresents
representsthe
the5000
5000ppm
ppmsurfactant
surfactant
solution (5000 SF), the purple curve represents the hybrid solution with 5000 ppm surfactant and
1500 ppm nanoparticles (5000 SF + 1500 NP) and the red curve represents the hybrid solution with
5000 ppm surfactant and 150 ppm nanoparticles (5000 SF + 150 NP).
The two-dimensional geometry of the micromodel likely resulted in multiple bubbles per pore
because the widths of some of the pore throats were narrower than the pore throat depths. Therefore,
pore-scale foam texture may not have a direct relation to foam in three-dimensional porous media.
Many studies report that in situ foam usually consists of bubbles about the same size or larger than
pore Figure
bodies5.based
Development in normalized
upon effluent bubble
analysis number
during as a function
laboratory of pore volume
experiments and the(PV) injected
large using
flow resistance
four different foaming solutions for the focused field of view. The blue curve represents the foaming
solution with 1500 ppm nanoparticles (1500 NP), the green curve represents the 5000 ppm surfactant3.2. Pore-Scale: Foam in the Presence of Oil
Dynamic foam generation in the presence of oil was evaluated by injecting CO2 into a
micromodel saturated with a hybrid foaming solution and oil. The aim was to evaluate the impact of
oil on foam 2020,
Nanomaterials generation
10, 1917 and gain insight on the influence of oil/water emulsions during CO2 foam 9 of 15
processes. Figure 6 shows the pore-scale images of the unsteady-state CO2 injection in the presence
of oil with the hybrid foaming solution containing 3500 ppm surfactant and 1500 ppm nanoparticles.
for bubbles
Three stages smaller than pores [12,36,37].
of the experiment are shown In addition,
which most mechanistic
correspond to before CO foam models [38–40] assume a
2 injection, the start of CO2
single bubble per pore and that discrete bubbles flow through the porous
injection, and during CO2 injection. Each image was acquired with 75 s between each media, where foam
time strength
step.
is controlled
Before CO by foam texture
2 injection, the (bubble size). was
micromodel The initially
latter assumptions are supported
saturated with by the pore-scale
foaming solution and oil
observations reported here.
(Figure 6a). Foaming solution appears as the continuous liquid phase, whereas oil is seen as isolated
globules in interconnected pores. At the start of CO2 injection (Figure 6b), the oil globules faded due
3.2. Pore-Scale: Foam in the Presence of Oil
to miscibility between CO2 and oil. As CO2 injection continued, the oil was displaced by CO2 and
foam Dynamic foam generation
readily generated in areasin the presence
where oil wasof oil
not was evaluated
present. Oilby
notinjecting CO2formed
displaced into a micromodel
oil/water
saturatedand
emulsions withoccupied
a hybrid foaming
pores solution
without and oil.(Figure
foam present The aim
6c).was
The to
foamevaluate the impact
(CO2/water emulsion)of oil
hadon
foam generation
thicker and gain insight
lamellae compared on the influence
to the oil/water emulsions of oil/water
likely dueemulsions during
to interfacial CO2 foam
tension processes.
differences at
Figureconditions
these 6 shows the aspore-scale imagesinof[41].
also observed the unsteady-state
Compared toCO 2 injection
foam in the presence
(CO2/water emulsion) of alone,
oil withthe
the
hybrid foaming
combined effect of solution containing
oil/water emulsions3500and
ppm surfactant
foam furtherand 1500 ppm
reduced CO2 nanoparticles.
mobility. This Three stages
resulted in
of the experiment
increased are shown
“foam” strength as which correspond
also observed to before
in the CO2experiments
core-scale injection, theinstart
the of CO2 injection,
presence of oil
and during
(discussed inCO 2 injection.
Section 3.4). Each image was acquired with 75 s between each time step.
(a) (b) (c)
Figure
Figure6.6.Pore-scale
Pore-scaleimages
imagesofofa afocused
focusedfield
fieldofofview
viewduring
duringthe theinjection
injectionofofdense
densephase
phaseCOCO2 2into
intoaa
micromodel
micromodel saturated with a hybrid foaming solution and oil at 100 bar and 25 C. Three stages of of
saturated with a hybrid foaming solution and oil at 100 bar and 25
◦ °C. Three stages the
the experiment
experiment areare shown
shown whichcorrespond
which correspondto: to:(a)
(a)before
beforeCO injection; (b)
CO22 injection; (b) the
the start
startof
ofCO
CO2 2injection;
injection;
and
and(c)
(c)during
duringCOCO2 2injection.
injection.Injection
Injectionwas
wasfrom
fromtop toptotobottom
bottominineacheachimage.
image.TheThedark
darkopaque
opaqueareasareas
are
aregrains,
grains, the grayish-blueopen
the grayish-blue openareas
areasareare
thethe
porepore
spacespace
filledfilled andthin
and the thewhite
thin white films
films are are the
the lamellae.
Individual image dimensions are 2190 × 2190 µm. The grain size ranged from 100 to 79,000 µm2 and
the pore throat distribution ranged from 10 to 200 µm for the entire micromodel.
Before CO2 injection, the micromodel was initially saturated with foaming solution and oil
(Figure 6a). Foaming solution appears as the continuous liquid phase, whereas oil is seen as isolated
globules in interconnected pores. At the start of CO2 injection (Figure 6b), the oil globules faded due to
miscibility between CO2 and oil. As CO2 injection continued, the oil was displaced by CO2 and foam
readily generated in areas where oil was not present. Oil not displaced formed oil/water emulsions and
occupied pores without foam present (Figure 6c). The foam (CO2 /water emulsion) had thicker lamellae
compared to the oil/water emulsions likely due to interfacial tension differences at these conditions as
also observed in [41]. Compared to foam (CO2 /water emulsion) alone, the combined effect of oil/water
emulsions and foam further reduced CO2 mobility. This resulted in increased “foam” strength as also
observed in the core-scale experiments in the presence of oil (discussed in Section 3.4).
3.3. Core-Scale: Foam in the Absence of Oil
Dynamic foam generation and stability in the absence of oil was evaluated by injecting CO2
into cores saturated with different foaming solutions. This set of experiments established conditions
to investigate foam behavior during prolonged periods of CO2 injection in a drainage-like process.
Figure 7a shows the apparent viscosity versus pore volume of CO2 injected for the CO2 foam stabilityFor all experiments, the rapid and linearly increasing apparent viscosity until 0.2 PV injected
indicated that foam was generated as CO2 invaded the core saturated with foaming solution.
Apparent viscosity steadily increased, from 0.2 to 0.5 PV injected, as foam continued to generate and
propagate into the core. A peak in apparent viscosity (foam strength) was achieved after
Nanomaterials
approximately 10, 1917
2020, 0.5 PV was injected. The magnitude of the peak apparent viscosity varied from1045
of 15
to
65 cP for all experiments. The peak in apparent viscosity indicated a transition from a period of
predominantly foam generation to predominantly foam coalescence. The development of a
scans with foaming solutions containing only surfactant at concentrations of 3500 ppm (green curves)
continuous CO2 flow path not impeded by lamellae caused the foam to coalesce, likely related to a
and 5000 ppm (blue curves). Figure 7b shows the results from the experiments using the two hybrid
combination of bubble rupture and foam displacement. The CO2 flow path rapidly reduced the
foaming solutions with 3500 ppm surfactant and 150 ppm nanoparticles (orange curves) and 3500 ppm
apparent viscosity just before one PV was injected. After about six PVs were injected, the initial CO2
surfactant and 1500 ppm nanoparticles (red curves). A baseline scan, without foaming solution, is also
viscosity was not fully recovered due to trapped bubbles in the pore space, which continued to reduce
shown in each figure for comparison (black curves).
CO2 mobility.
(a) (b)
Figure 7.7.Apparent
Figure Apparentviscosity
viscosity versus
versus porepore volume
volume of theof
COthe CO2 injected for the unsteady state CO2
2 injected for the unsteady state CO2 injections
injections
into cores into cores pre-saturated
pre-saturated withsolutions
with foaming foaming solutions
containing:containing: (a) 3500
(a) 3500 ppm ppm surfactant
surfactant (green
(green curves)
curves)
and 5000and
ppm5000 ppm surfactant
surfactant (blue(b)
(blue curves); curves);
hybrid(b) hybridsolutions
foaming foaming containing
solutions containing 3500 ppm
3500 ppm surfactant
surfactant
and 150 ppm andnanoparticles
150 ppm nanoparticles (orange
(orange curves) and curves)
3500 ppm and 3500 ppm
surfactant andsurfactant
1500 ppmand 1500 ppm
nanoparticles
nanoparticles (red curves). The black curve is the baseline
(red curves). The black curve is the baseline with only brine. with only brine.
The all
For difference in dynamic
experiments, foamand
the rapid generation
linearly and coalescence
increasing processes
apparent for the
viscosity foaming
until 0.2 PVsolutions
injected
with and without
indicated that foam nanoparticles
was generated were asinsignificant.
CO2 invaded Including
the core nanoparticles
saturated with in thefoaming
surfactant-laden
solution.
foaming solution
Apparent viscositydid not result
steadily in a more
increased, from 0.2stable foam
to 0.5 and the type
PV injected, of foaming
as foam continued solutions did and
to generate not
clearly affect
propagate intothe
theapparent viscosity
core. A peak of the foam.
in apparent Therefore,
viscosity the surfactant
(foam strength) contributed
was achieved aftermostly to foam
approximately
generation
0.5 PV was and the nanoparticles
injected. The magnitude had of
only
theminor
peak impacts
apparentonviscosity
the foamvaried
strength and45stability
from to 65 cPinfor
these
all
experiments. The The experiments with viscosity
peak in apparent the hybrid foamingasolutions
indicated transition(Figure
from a7b) revealed
period similar foam
of predominantly
behavior
foam independent
generation of nanoparticle
to predominantly foam concentration.
coalescence. The Despite an order
development of aofcontinuous
magnitudeCO difference
2 flow pathin
nanoparticle
not impeded by concentration, the measured
lamellae caused the foam toapparent
coalesce,viscosities andto
likely related stability of the foam
a combination were rupture
of bubble similar.
Thus,
and thedisplacement.
foam nanoparticle concentrations
The CO2 flow path of 150 ppmreduced
rapidly gave similar performance
the apparent viscosity asjust
thebefore
nanoparticle
one PV
was injected. After about six PVs were injected, the initial CO2 viscosity was not fully recovered due to
trapped bubbles in the pore space, which continued to reduce CO2 mobility.
The difference in dynamic foam generation and coalescence processes for the foaming solutions
with and without nanoparticles were insignificant. Including nanoparticles in the surfactant-laden
foaming solution did not result in a more stable foam and the type of foaming solutions did not
clearly affect the apparent viscosity of the foam. Therefore, the surfactant contributed mostly to
foam generation and the nanoparticles had only minor impacts on the foam strength and stability
in these experiments. The experiments with the hybrid foaming solutions (Figure 7b) revealed
similar foam behavior independent of nanoparticle concentration. Despite an order of magnitude
difference in nanoparticle concentration, the measured apparent viscosities and stability of the foam
were similar. Thus, the nanoparticle concentrations of 150 ppm gave similar performance as the
nanoparticle concentrations of 1500 ppm when used with the selected surfactant. The next set of
experiments focused on evaluating the same foaming solutions in the presence of oil, a condition
known to destabilize some surfactant-based foams.The core contained a residual oil saturation of around 30% prior to being flooded with foaming
solution and then CO2. Each experiment was conducted a minimum of two times for reproducibility.
Figure 8 shows the average apparent viscosity (cP) versus the pore volume of CO2 injected for the
unsteady state CO2 foam
Nanomaterials stability
2020, 10, 1917 scans in the presence of oil. Experiments using the foaming 11 of 15 solution
with only surfactant are shown with the blue curve and experiments with the hybrid foaming
solution are 3.4.
shown withFoam
Core-Scale: theinred curve. of Oil
the Presence
Both typesDynamic
of foaming solutionsandgenerated
foam generation stability for foam
foamingwithin
solutionsthe first
with and 0.2 PV nanoparticles
without injected. However,
in the
the presence of oil was evaluated
hybrid foaming solution generated foam more rapidly by injecting CO 2 into a core saturated with each foaming solution.
(faster increase in apparent viscosity) than the
The core contained a residual oil saturation of around 30% prior to being flooded with foaming solution
solution containing only surfactant. In addition, the hybrid foaming formulation generated a stronger
and then CO2 . Each experiment was conducted a minimum of two times for reproducibility. Figure 8
(higher apparent
shows viscosity) foam, compared
the average apparent viscosity (cP)to the solution
versus containing
the pore volume only surfactant.
of CO2 injected The increased
for the unsteady
apparent viscosity
state CO2for both
foam types
stability of solution
scans indicated
in the presence that each formulation
of oil. Experiments generated
using the foaming foam with the
solution with
only surfactant are shown with the blue curve and experiments with the hybrid foaming solution are
residual oil present.
shown with the red curve.
Figure 8. Apparent viscosity versus pore volume of the CO2 injected for the unsteady state CO2
Figure 8. Apparent
injections inviscosity versusoilpore
cores with residual volume
(Sor ) and of the
pre-saturated CO
with 2 injected for the unsteady state CO2
a hybrid foaming solution containing
injections insurfactant
cores with and residual oil (SF
nanoparticles (Sor+) NP,
andred pre-saturated withsolution
curve) or a foaming a hybrid foaming
containing only solution
surfactant containing
(SF, blue curve).
surfactant and nanoparticles (SF + NP, red curve) or a foaming solution containing only surfactant
(SF, blue curve).
Both types of foaming solutions generated foam within the first 0.2 PV injected. However,
the hybrid foaming solution generated foam more rapidly (faster increase in apparent viscosity)
thanfoam
Apparent the solution containing
viscosity only surfactant.
values with the Inhybrid
addition, the hybridin
solution foaming formulationofgenerated
the presence oil (Figure 8, red
a stronger (higher apparent viscosity) foam, compared to the solution containing only surfactant.
curve) wereThenearly three times as high as the experiments without oil present (Figure 7b). In the
increased apparent viscosity for both types of solution indicated that each formulation generated
presence of foam
oil, the
withfoaming
the residualsolution
oil present.with only surfactant (Figure 8, blue curve) had foam-apparent
viscosity valuesApparent
about twice as high
foam viscosity as experiments
values with the hybrid in the absence
solution of oil
in the presence (Figure
of oil (Figure 7a).
8, redThis
curve)is related to
were nearly three times as high as the experiments without oil present (Figure 7b). In the presence of
the development of oil/water emulsions, which were likely stabilized by each respective foaming
oil, the foaming solution with only surfactant (Figure 8, blue curve) had foam-apparent viscosity values
agent. The emulsions
about twice asinfluenced the calculated
high as experiments in the absenceapparent
of oil (Figureviscosities (differential
7a). This is related pressure) and are
to the development
indistinguishable from
of oil/water foam (CO
emulsions, which2/water emulsion).
were likely stabilized byNonetheless, the oil/water
each respective foaming agent. Theemulsions
emulsions highlight
influenced the calculated apparent viscosities (differential pressure)
an important facet of the CO2 foam process, which can be beneficial to enhancing oil and are indistinguishable from
recovery by
foam (CO2 /water emulsion). Nonetheless, the oil/water emulsions highlight an important facet of
increasing the capillary number (increased viscous forces and lower interfacial tension) [42].
the CO2 foam process, which can be beneficial to enhancing oil recovery by increasing the capillary
number (increased viscous forces and lower interfacial tension) [42].
3.5. From Pore- to Core-Scale
The similarity in foam generation and coalescence during unsteady-state CO2 injections at the
pore- and core-scale is striking. Figures 5 and 7 reveal dynamic foam generation and coalescenceNanomaterials 2020, 10, 1917 12 of 15
3.5. From Pore- to Core-Scale
The similarity in foam generation and coalescence during unsteady-state CO2 injections at the pore-
and core-scale is striking. Figures 5 and 7 reveal dynamic foam generation and coalescence processes
with similar behavior at two different length scales. The experiments in this work were characterized by
a period of rapid foam generation during drainage-like CO2 injection and a period of foam coalescence
during prolonged CO2 injection. The decline in foam strength, at both scales, was related to the
development of open CO2 flow paths through the generated foam. This phenomenon was a result of
bubble coarsening from diffusion. The pore-scale observations unlocked real-time insights on in situ
foam behavior that may help explain the observations from the core-scale experiments. Since foam
was rapidly generated at both scales (due to ideal conditions for foam generation), the coalescence
mechanisms during continued CO2 injection at the pore-scale may be applied at the core-scale with
some level of confidence. It is understood that foam will dry out as more CO2 is injected and not
supplemented with additional surfactant solution. Here, we showed one of the physical mechanisms
responsible for such behavior.
In addition, the experiments in the presence of oil revealed the importance of stable oil/water
emulsions on the CO2 foam process. The insights from pore-scale experiments with oil shed light on
the influence of oil/water and CO2 /water emulsions on CO2 mobility reduction. Higher foam apparent
viscosities were calculated for the core-scale experiments with oil present and were likely related to the
development of the oil/water emulsions. Because apparent viscosity is used as an indication of foam
generation and strength in laboratory experiments, care must be taken when interpreting the results
from coreflood studies with the presence of stable oil/water emulsions. These emulsions can influence
the calculated apparent viscosities (based on differential pressures) and may contribute to reducing
CO2 mobility.
4. Conclusions
This work presented a multi-scale investigation of hybrid nanoparticle–surfactant foam for
CO2 mobility control for CO2 EOR and CO2 storage. High-pressure micromodel experiments and
high-pressure/high-temperature core floods evaluated a hybrid surfactant and nanoparticle foaming
solution and foaming solutions with only surfactant or nanoparticles, in the presence and absence of
oil. The following conclusions can be drawn:
• Direct pore-scale observations of dense phase CO2 injection into a micromodel saturated with
foaming solutions containing only surfactant or a hybrid nanoparticle–surfactant foaming solution
revealed snap-off as the primary foam generation mechanism and leave-behind as a secondary
foam generation mechanism.
• At the pore-scale, foam readily generated in areas where oil was not present and oil/water
emulsions initially occupied pores without foam present.
• All foaming solutions containing surfactant generated foam in the presence and absence of oil,
whereas foaming solution only containing nanoparticles did not. Thus, surfactant was the main
foam generator and nanoparticles may be more important for foam stabilization.
• Foam strength was not sensitive to nanoparticle concentration when used together with surfactant
in the tested foaming solutions.
• At the core-scale, all foaming solutions rapidly generated foam in the presence of residual oil.
• Foam apparent viscosity values with the hybrid foaming solution, in the presence of oil, were nearly
three times as high as the experiments without oil. This was related to the development of oil/water
emulsions, which were likely stabilized by the foaming agents.
• A link is proposed between direct pore-scale visual observations and quantitative
core-scale measurements. The combined influence of stable oil/water emulsions and foam
(CO2 /water emulsions) may be beneficial for increasing the capillary number by achieving higher
apparent viscosity and lower interfacial tension.Nanomaterials 2020, 10, 1917 13 of 15
• The experiments in this work were characterized by a period of rapid foam generation during
drainage-like CO2 injection and a period of foam coalescence during prolonged CO2 injection.
The decline in foam strength is related to the development of open CO2 flow paths through the
generated foam.
• Increased apparent viscosities with foam reduced CO2 mobility at multiple length scales, which can
improve volumetric sweep efficiency in field-scale CO2 EOR and CO2 storage processes.
Author Contributions: Conceptualization, Z.P.A., T.F., J.G., M.F.; methodology, Z.P.A., T.F., J.G., B.B., M.F.;
formal analysis, Z.P.A., T.F., J.G.; investigation, T.F., B.B., A.S.; writing—original draft preparation, Z.P.A.; review
and editing, T.F., J.G., B.B., M.F.; supervision, Z.P.A., J.G., M.F.; project administration, M.F.; funding acquisition,
M.F. All authors have read and agreed to the published version of the manuscript.
Funding: This research was funded by the Norwegian Research Council, grant numbers 268216, 294886 and 301201.
Conflicts of Interest: The authors declare no conflict of interest.
References
1. IPCC. Climate Change 2014: Chapter 1: Mitigation of Climate Change. Contribution of Working Group III to the Fifth
Assessment Report of the Intergovernmental Panel on Climate Change; Victor, D.G., Zhou, D., Ahmed, E.H.M.,
Dadhich, P.K., Olivier, J.G.J., Rogner, H.-H., Sheikho, K., Yamaguchi, M., Eds.; Cambridge University Press:
Cambridge, UK; New York, NY, USA, 2014.
2. Enick, R.M.; Olsen, D.K.; Ammer, J.R.; Schuller, W. Mobility and Conformance Control for CO2 EOR via
Thickeners, Foams, and Gels—A Detailed Literature Review of 40 Years of Research; DOE/NETL-2012/1540; USDOE,
National Energy Technology Laboratory: Washington, DC, USA, 2012.
3. Hoefner, M.L.; Evans, E.M. CO2 Foam: Results from Four Developmental Field Trials. SPE Reserv. Eng. 1995,
10, 273–281. [CrossRef]
4. Martin, F.D.; Stevens, J.E.; Harpole, K.J. CO2 -Foam Field Test at the East Vacuum Grayburg/San Andres Unit.
SPE Reserv. Eng. 1995, 10, 266–272. [CrossRef]
5. Rossen, W.R. Foams in Enhanced Oil Recovery. In Foams Theory, Measurements, and Applications;
Prud’homme, R.K., Khan, S.A., Eds.; Marcel Dekker, Inc.: New York, NY, USA, 1996; Volume 57, Chapter 11,
pp. 414–464.
6. David, A.; Marsden, S.S. The Rheology of Foam. In Proceedings of the 44th Annual Fall Meeting of SPE of
AIME, Denver, CO, USA, 28 September–1 October 1969. [CrossRef]
7. Espinosa, D.; Caldelas, F.; Johnston, K.; Bryant, S.L.; Huh, C. Nanoparticle-Stabilized Supercritical CO2
Foams for Potential Mobility Control Applications. In Proceedings of the SPE Improved Oil Recovery
Symposium, Tulsa, OK, USA, 24–28 April 2010.
8. Rognmo, A.U.; Al-Khayyat, N.; Heldal, S.; Vikingstad, I.; Eide, Ø.; Fredriksen, S.B.; Alcorn, Z.P.; Graue, A.;
Bryant, S.L.; Kovscek, A.R.; et al. Performance of Silica Nanoparticles in CO2 -Foam for EOR and CCUS at Tough
Reservoir Conditions. In Proceedings of the SPE Norway One-Day Seminar, Bergen, Norway, 18 April 2019.
9. Ogolo, N.A.; Olafuyi, O.A.; Onyekonwu, M.O. Enhanced Oil Recovery Using Nanoparticles. In Proceedings of
the SPE Saudi Arabia Section Technical Symposium and Exhibition, Al-Khobar, Saudi Arabia, 8–11 April 2012.
10. Yu, J.; Wang, S.; Liu, N.; Lee, R. Study of Particle Structure and Hydrophobicity Effects on the Flow Behavior
of Nanoparticle-Stabilized CO2 Foam in Porous Media. In Proceedings of the SPE Improved Oil Recovery
Symposium, Tulsa, OK, USA, 12–16 April 2014.
11. Bennetzen, M.; Mogensen, K. Novel Applications of Nanoparticles for Future Enhanced Oil Recovery. In Proceedings
of the International Petroleum Technology Conference, Kuala Lumpur, Malaysia, 10–12 December 2014.
12. Ettinger, R.A.; Radke, C.J. Influence of Texture on Steady Foam Flow in Berea Sandstone. SPE Reserv. Eng.
1992, 7, 83–90. [CrossRef]
13. Chen, M.; Yortos, Y.C.; Rossen, W.R. A Pore-Network Study of the Mechanisms of Foam Generation.
In Proceedings of the SPE Annual Technical Conference and Exhibition, Houston, TX, USA, 26–29 September
2004. SPE-90939.
14. Farajzadeh, R.; Andrianov, A.; Krastev, R.; Hirasaki, G.J.; Rossen, W.R. Foam–oil interaction in porous media:
Implications for foam assisted enhanced oil recovery. Adv. Colloid Interface Sci. 2012, 183, 1–13. [CrossRef]
[PubMed]You can also read