Population Health and Demographics - November 2019 To inform preparation of Health Service Executive Corporate Plan - HSE
←
→
Page content transcription
If your browser does not render page correctly, please read the page content below

Population Health and
   Demographics

        To inform preparation of
 Health Service Executive Corporate Plan
                2020 - 2022

           November 2019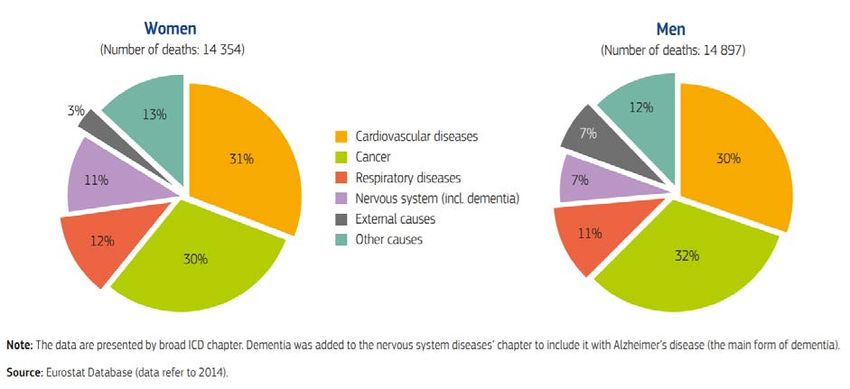
Table of Contents

Introduction ............................................................................................................................................ 3
Aim .......................................................................................................................................................... 3
Methodology........................................................................................................................................... 3
Caveats/ limitations ................................................................................................................................ 3
Linking to Corporate Plan Principles ....................................................................................................... 3
Summary ................................................................................................................................................. 4
   Population profile ............................................................................................................................... 4
   Children (0-14 years) ........................................................................................................................... 4
   Adults (15-64 years) ............................................................................................................................ 4
   Older Adults ........................................................................................................................................ 4
   Health Inequalities .............................................................................................................................. 5
   Impact on Health and Social Care Services ......................................................................................... 6
   Summary Conclusions on Population Health and insights for Corporate Planning............................ 6
Demographics ......................................................................................................................................... 7
Life expectancy ....................................................................................................................................... 7
Mortality ................................................................................................................................................. 8
Chronic Disease ....................................................................................................................................... 9
   Children (0-14 years) ........................................................................................................................... 9
   Adults (15-64 years) ............................................................................................................................ 9
   Older Adults ...................................................................................................................................... 10
Mental health........................................................................................................................................ 10
Modifiable Health Behaviour and Lifestyle Factors .............................................................................. 11
   Children (0-14 years) ......................................................................................................................... 11
   Childhood Vaccination ...................................................................................................................... 11
   Adults (15-64 years) .......................................................................................................................... 12
   Screening........................................................................................................................................... 12
   Older Adults ...................................................................................................................................... 12
   Health Inequalities ............................................................................................................................ 13
Appendix - Population Health – Table of Definitions............................................................................ 16

Document Owner: Deirdre Mulholland
Project Team: Mary Clare O’ Hara, Teresa Bennett and Matt Robinson

                                                                                                                                                              2
Introduction
This is a paper profiling the population health and demographics in Ireland created to support Board
deliberations in the development of the Corporate Plan 2020-2022.
Aim
The aim was to present a summary of the current population health status, demography and lifestyle
style risk factors with a focus on differences between population groups and health inequalities to
provide relevant key insights and observations to inform the Health Service Executive (HSE)
Corporate Plan 2020-2022.
Methodology
The population health of Ireland profiled in this paper was derived from relevant HSE data sources,
the Central Statistics Office (CSO), the Department of Health (DOH), population health longitudinal
surveys and key health reports. Analysis focused on identifying any differences in trends between
genders, population groups and socially disadvantaged groups and has been presented by the main
population age cohorts, e.g., children, adults and older adults.
Caveats/ limitations
Population figures and the projections are taken from the CSO 2016 Census. Population projections
are based on the M2, F2 scenario. Some data are older than 10 years but have been reported here in
lieu of more recent data. This is a comprehensive overview of current population health, health
status and demographics but for brevity it is not exhaustive.
Linking to Corporate Plan Principles
We have considered the key principles which will guide the corporate plan and highlighted below
which principle this research paper will support.
Corporate Plan Principles
Focused on the People Who Use Our Services
Evidence Based
Outcomes Based
Written in Simple, Plain English
Real and Achievable
Implementation Ready
3Summary
Population profile
• Over 4.9 million people live in Ireland and this is projected to reach 5.64 million by 2038
• Adults 65 years and over are increasing on average by 20,000 per year. At the same time there is
a large young population with over a quarter of the population aged between 0-17 years
• Life expectancy has been increasing in Ireland. In 2018, life expectancy for females and males in
Ireland was 83.6 years and 79.9 years, respectively, having increased by 2 and 3 years since
2006 1. Although it has been and continues to be higher for women the gap is reducing
• The greatest gains in life expectancy have been achieved in the older age groups reflecting
decreasing mortality rates from major diseases
• Life expectancy in Ireland is now above the European Union (EU) average and the proportion of
life beyond the age of 65 to be lived in good health is higher compared with the EU average
• However, life expectancy is lower among unskilled workers compared to professional workers
and there are groups within the population, such as Travellers and the homeless, that studies
have shown have lower life expectancy
• Age-standardised mortality rates have declined for all causes over the past decade. Mortality
rates from circulatory system diseases decreased by 31.5% between 2008 and 2017, and cancer
death rates decreased by 11.3%
• The prevalence of chronic disease in the population continues to increase due to a reduction in
mortality from chronic diseases but also due to increasing incidence of chronic disease in the
population.
Children (0-14 years)
• The number of children 0-14 years in the population is projected to decrease by -0.8% (-8,676)
from 2019 to 2022
• Breastfeeding rates seen nationally were 58% in 2017
• In Ireland in 2017, the uptake of the 3rd 6 in 1 vaccine by 24 months was 95% and the uptake of
the measles, mumps and rubella (MMR) vaccine by 24 months in 2017 was 92%
• 18.1% of children are overweight or obese with 15% of 5-year-olds overweight and a further 5%
obese. While physical activity among teenagers was 50.8%
• Self-reported binge drinking among teenagers was 8.7%.
Adults (15-64 years)
• This population cohort is expected to increase by 2.6% (80,577) between 2019 and 2022
• Across Ireland overweight and obesity rates for adults are 62%, smoking is 22%, binge drinking is
30% and adults who report being physical active at the recommended levels are 56%
• Breast cancer incidence is 121.9/100,000 for women and prostate is 141.8/100,000 for men
Higher colorectal, lung and melanoma rates are seen in men compared to women
• The total average rate of suicide in Ireland (per 100,000) in 2016 was 8.5 (n = 399).
Older Adults
• Since 2009, the population aged 65 and over has increased by 35%, which is considerably higher
than the EU average of 16%
1
Health in Ireland: Key Trends 2018, Department of Health, Dec 2018. https://health.gov.ie/blog/press-
release/health-in-ireland-key-trends-2018/
4• This population cohort is projected to increase by 10.1% (70,084) from 2019 to 2022, while
those 85 years and over will increase by 14.1% (10,634) in the same period
• There is an increased prevalence of chronic disease and frailty with increased age. By 2022 it is
projected that there will be 656,270 people aged 65 years and over with at least one, and
489,380 people with two or more, chronic conditions 2.
Health Inequalities
Overview
• There is a strong link between poverty, socio-economic status and health
• In total, 22.5% of the population (n = 1,072,707) are exposed to disadvantage; these numbers
have increased between 2011 and 2016 by 9.1% while those living in extreme disadvantage
increased by 9.8%
• Out-of-pocket payments often stop people seeking preventative and necessary healthcare,
which can often result in more serious conditions and more expense at a later point
• In 2017, the consistent poverty rate in Ireland was 6.7%, compared with 8.2% in 2016
• The average life expectancy for a homeless person is just over 42 years
• In July 2019 there were 6,497 adults and 3,788 children who were homeless in Ireland. Between
July 2018 and July 2019, homeless figures have increased by 7.9% for adults (6,024 to 6,497) and
decreased slightly -2.3% for children (3,867 to 3,778) nationally
• The Dublin region accounts for 66% of all homelessness
• Nearly half of Roma population in Ireland do not have access to medical cards and General
Practitioner (GP) care
• Drug-related deaths in 2016 among people who inject drugs was 5%, 65% of which were in
Dublin City. Alcohol was implicated in 132 drug-related deaths in 2016.
Children
• In 2017, 8.8% of children (0-17 years) lived in consistent poverty – down from 10.9% in 2016.
63% of all children in consistent poverty are in jobless households 3
• The at risk of poverty rate for households with one adult and one or more children aged under
18 was 39.9% 4
• Traveller infant mortality rates are 3.6 times higher than of the general population
• At the end of March 2019 there were 6,005 children in care in Ireland, 646 children were in
private placements, 89% (n = 5,336) of children in care had an allocated social worker, 669
children were awaiting allocation of a social worker 5.
Adults
• Most socio-demographic groups experienced a decline deprivation rates year-on-year from
2017. Those who were not at work due to illness or disability had the highest deprivation rate in
2017 at 45.9%
• The deprivation rate for those at-risk of poverty was 42.8% in 2017 compared with a high of
55.3% in 2013. The deprivation rate for those not at-risk of poverty was 14.3% in 2017,
compared with a high of 25.8% in 20134.
2
Smyth B, Donohue M, Kavanagh P, Kitching A, Feely E, Collins L, Cullen L, Sheridan A, Evan D, Wright P,
O'Brien S, Migone C. Planning for Health: Trends and Priorities to Inform Health Service Planning 2017. Report
from the Health Service Executive
3
https://statbank.cso.ie/multiquicktables/quickTables.aspx?id=sia12_sia20
4
https://www.cso.ie/en/releasesandpublications/ep/p-
silc/surveyonincomeandlivingconditionssilc2017/povertyanddeprivation/
5
https://www.tusla.ie/uploads/content/Q1_2019_Service_Performance_and_Activity_Report_V7.0.pdf
5• An analysis of consistent poverty rates by principal economic status shows that the consistent
poverty rate was highest among unemployed individuals (24.1%) and those who were not at
work due to illness or disability (24.0%). The consistent poverty rate was lowest among those
who were at work (1.4%) and those who were retired (1.5%)4
• The All Ireland Traveller Health Study found mortality rates significantly higher among Travellers
than among the general population. Mortality rates among Traveller males are 3.7 times higher
than the general male population and among Traveller women mortality rates are 3 times higher
• Prevalence of chronic illness is higher in more deprived areas. The Institute of Public Health in
Ireland has calculated that the incidence of stroke is 2.2 times higher, and Coronary Heart
Disease (CHD) is 2.5 times higher in the most deprived Local Health Office Areas (LHOs)
compared to the least deprived LHOs. In addition, diabetes prevalence in the most deprived
LHOs is 1.4 times that in the least deprived LHOs 6.
Impact on Health and Social Care Services
• The Health Service Capacity Review forecast that the demand for healthcare is expected to grow
significantly across the primary, acute and social care settings in the next 15 years because of
demographic and non-demographic change 7. This includes:
— Up to 46% rise in demand for primary care
— 39% rise in the need for long term residential care
— 70% increase in demand for homecare
— 24% increase in non-elective inpatient episodes in public hospitals
• To address the increasing demand requires a multi-pronged approach including health and
wellbeing initiatives, health improvement /prevention programmes, enhanced primary care and
community care services and an increment in capacity including hospital beds, residential care
and homecare packages
• Also required are management measures to improve patient flow. The Capacity Review in 2018
forecast that to meet this demand required a 37% increase in the primary care workforce; up to
12,000 residential care beds; 70% increase in homecare and 7,150 extra hospital beds.
Summary Conclusions on Population Health and insights for Corporate Planning
• The population of Ireland is increasing with an expected population of 5.64 million by 2038. The
number and proportion of people over 65 years in Ireland continues to increase with
approximately a 3% increase each year in 2019 and 2020. It is expected that by 2038 more than
one in five will be 65 years or older. However, it is also important to note that about quarter of
our population in 2016 were under 17 years or younger
• Life expectancy has been increasing in Ireland for both males and females with the greatest
gains being in the older age groups
• However, life expectancy is lower among unskilled workers compared to professional workers
and there are groups within the population that have lower life expectancy such as Travellers
and the homeless
• There is also an increasing prevalence in the general population, particularly in the increasing
proportion of older persons, of chronic diseases such as diabetes and cardiovascular and
respiratory diseases
6
Balanda, K.P., Barron, S., Fahy, L., McLaughlin, A. Making Chronic Conditions Count: Hypertension, Stroke,
Coronary Heart Disease, Diabetes. A systematic approach to estimating and forecasting population prevalence
on the island of Ireland. Dublin: Institute of Public Health in Ireland, 2010
7
Health Service Capacity Review 2018: Review of Health Demand and Capacity Requirements in Ireland to
2031 Main Report. Department of Health. https://health.gov.ie/wp-content/uploads/2018/02/71580-DoH-
Dublin-Report-v6.pdf
6• Lifestyle behaviours which are modifiable such as smoking, alcohol consumption, healthy eating
and inactivity are among the factors for many chronic diseases and therefore, the health services
need to focus on supporting the population in making health choices
• It is also important to note that social determinants such as income, education, employment and
housing impact on the health and wellbeing of the population. There is some evidence that
deprivation is increasing in Ireland but there are also groups within our population that are
particularly vulnerable such as the homeless and asylum seekers who may need specific and
targeted supports and services from health and social services
• These issues impact on the health and wellbeing of the population and lead to an increasing
demand on health and social services. The demand for healthcare is expected to grow
significantly across the primary, acute and social care settings in the next 15 years because of
demographic and non-demographic change 8 with significant increased demand on primary care,
long term residential care, homecare and hospital inpatient care.
Demographics
• Over 4.9 million people live in Ireland 9
• The total population is projected to reach 5.64 million by 2038. More than one in five people are
expected to be aged 65 years or older by 2038
• The greatest change in population structure over the last ten years is the growth in both the
proportion and the number of people aged 65 years and over, increasing from 11.6% in 2011 to
13.3% in 2016
• It is projected that people aged 65 years and over will increase by 21,969 (3.3%) in 2019 and by
23,327 (3.3%) in 2020
• In 2016 a quarter of our population were children aged 0-17 years10
• According to Census 2016, there were 30,987 Irish Travellers representing 0.7% of the general
population, an increase of 5.1% on the 2011. Nearly 40% are children under 15 years old and 3%
are 65 years or over
• According to Census 2016, there were 535,475 non-Irish nationals living in Ireland (a decrease of
1.6% on Census 2011). Ten nationalities accounted for 70% of the total figure with Polish
nationals (122,515) made up the largest group
• There were 61,016 births in 2018, 1,037 fewer births compared with 2017
• The death rate has remained static from 2016 to 2018 with a rate of 6.4 per 1,000 population.
• The infant mortality rate in 2018 was 3.1 per 1,000 live births (or 187 infant deaths)
• The average maternal age for all births registered in 2018 was 32.9 years (0.1 higher than 2017),
with teenage births reducing to 980 births in 2018 from 1,041 births in 2017 and 1,098 in 2016 11.
Life expectancy
• In 2018, life expectancy for females and males in Ireland was 83.6 years and 79.9 years,
respectively, having increased by 2 and 3 years since 2006 12
8
Health Service Capacity Review 2018: Review of Health Demand and Capacity Requirements in Ireland to
2031 Main Report. Department of Health. https://health.gov.ie/wp-content/uploads/2018/02/71580-DoH-
Dublin-Report-v6.pdf
9
Population and Migration Estimates, Central Statistics Office, August 2019
https://www.cso.ie/en/releasesandpublications/er/pme/populationandmigrationestimatesapril2019/
10
Census 2016, Central Statistics Office.
11
Vital Statistics Yearly Summary 2018, CSO, May 2019
https://www.cso.ie/en/csolatestnews/pressreleases/2019pressreleases/pressstatementvitalstatisticsyearlysu
mmary2018/
7• Life expectancy for women is higher than for men, as in most countries, however this gap has
narrowed in the past decade, and male life expectancy in 2016 was 3.7 years below female life
expectancy compared to 5.6 years in 1996
• The greatest gains in life expectancy have been achieved in the older age groups reflecting
decreasing mortality rates from major diseases
• Not only is life expectancy in Ireland now above the EU average (Figure 1), but the proportion of
life beyond the age of 65 to be lived in good health is higher, compared with the EU average
• Since the 1990s, a pattern showing that life expectancy is lower among unskilled workers
compared to professional workers has emerged in Ireland 13
• However, there are groups within the population that studies have shown have lower life
expectancy. Studies in 2010 reported that male Traveller life expectancy was 61.7 years (15.1
years less than men in the general population in 2010) and for female Travellers was 70.1 years
(11.5 years less than women in the general population in 2010).
Figure 1: Life expectancy in Ireland is increasing faster than the EU average
Mortality
• Age-standardised mortality rates have declined for all causes over the past decade. This
decrease is particularly strong for mortality rates from stroke (-39%), breast cancer (-16%),
suicide (-26%) and pneumonia (-39%)
• Infant mortality, measured as deaths per 1,000 live births, has also decreased by 26% since 2008
and remains below the EU average. However, although the infant mortality rate among Traveller
infants has fallen slightly to 14.1 per 1,000 this is still significantly higher than the current death
rate among infants in the general population
12
Health in Ireland: Key Trends 2018, Department of Health, Dec 2018. https://health.gov.ie/blog/press-
release/health-in-ireland-key-trends-2018/
13
Layte R and Banks J. Socioeconomic Differentials in Mortality by Cause of Death in the Republic of Ireland,
1984-2008. European Journal of Public Health 2016, 26(3):451-458
8• Mortality rates from circulatory system diseases decreased by 31.5% between 2008 and 2017,
and cancer death rates decreased by 11.3%. Nevertheless, cancer, cardiovascular disease and
respiratory disease still account for over 70% of all deaths in Ireland (Figure 2)
• A 2010 study noted that Travellers in general, but particularly male Travellers, continue to have
higher rates of mortality for all causes of death. Furthermore, suicide rates are almost seven
times higher among Traveller men compared with men in the general population
• The reduced mortality rates seen, however, result in an increased prevalence of chronic disease.
Figure 2: Cancer and cardiovascular diseases account for over 60% of all deaths in Ireland
Chronic Disease
The prevalence of chronic disease continues to increase due to a reduction in mortality from chronic
diseases but also due to increasing incidence of chronic disease in the population.
Children (0-14 years)
• In 2009: 11% of 9-year-olds had a chronic illness or disability 14 . Respiratory illnesses for example
asthma were the most common, accounting for almost half of all illnesses (47%) followed by
mental and behavioural conditions (17%) and skin conditions (5%)
• Boys were more likely than girls to be affected by a mental and behavioural condition (21%
compared to 11%)
• Chronic illness or disability was more heavily concentrated among children from lower socio-
economic backgrounds.
Adults (15-64 years)
• It is estimated that over 1.07m people over the age of 18 years in Ireland currently have one or
more chronic diseases including cancer (90,000), cardiovascular disease (250,000), respiratory
disease (440,000) and diabetes (190,000)9,10
• In 2017, four chronic conditions (heart failure, asthma, chronic obstructive pulmonary disease
(COPD) and diabetes) accounted for 27.31% of all acute hospital bed days
14
Growing Up In Ireland. The Health of 9 Year Olds, July 2009
9• The most common newly diagnosed cancers in Ireland for the years 2013 – 2015 were for men:
prostate, colorectal and lung and for women: breast, lung and colorectal. The next most
common new cancer for both genders is melanoma
• In 2017, 28,388 people were recorded as having an intellectual disability (ID). 7,500 people with
ID were in receipt in full-time residential services. 27,902 people availed of at least a one-day
programme and 139 people were residing in psychiatric hospitals.
Older Adults
• Since 2009, the population aged 65 and over has increased by 35%, this is considerably higher
than the EU average of 16%
• There is an increased prevalence of chronic disease and frailty with increased age. By 2022 it is
projected that there will be 656,270 people aged 65 years and over with at least one, and
489,380 people with two or more, chronic conditions 15
• The number of people reporting a chronic illness or health problem in Ireland is lower than the
EU average, at around 27% of the population
• Poly-pharmacy (i.e. taking five or more medications) has increased from 21% in 2010 to 26% in
2012
• While overall age-adjusted cancer incidence is decreasing in Ireland, the absolute number of
cancer diagnoses is expected to approximately double, to 43,000, by 2045, due to population
growth and ageing
• The impact of age-specific conditions is also expected to increase significantly over the coming
years:
— Frailty currently affects 12.7% of adults aged 50 years and over and 21.5% of people aged 65
and over in Ireland
— The number of people suffering with dementia is projected to increase from 54,793 people
in 2016 to 152,157 people in 2046.
Mental health
In Ireland, as in many countries, the prevalence of mental health issues has been increasing. Many of
these issues are managed in the community and primary care. Only a small percentage of people
with mental health issues are admitted to hospital
• One in 4 people in Ireland will suffer from mental health problems at some stage in their life and
75% of the first onset of poor mental health occurs under the age of 25 16. The overall economic
cost of mental health problems was estimated at just over €3 billion in 2006 17
• There were 17,000 psychiatric admissions in 2018. The main diagnoses were depressive
disorder, schizophrenia, mania and alcoholic disorders
15
Smyth B, Donohue M, Kavanagh P, Kitching A, Feely E, Collins L, Cullen L, Sheridan A, Evan D, Wright P,
O'Brien S, Migone C. Planning for Health: Trends and Priorities to Inform Health Service Planning 2017. Report
from the Health Service Executive.
16
Headstrong (2013) Conceptual and Empirical Underpinnings of Community-based Early Intervention and
Prevention in Youth Mental Health. Dublin: Headstrong, The National Centre for Youth Mental Health.
Available at:
http://www.headstrong.ie/sites/default/files/Early%20Intervention%20and%20Prevention%20in%20Youth%20
Mental%20Health%20(updated%2023-7-13).pdf
17
O’Shea, E. and Kennelly, B. (2008) The Economics of Mental Healthcare in Ireland. Galway: Irish Centre for
Social Gerontology and Department of Economics, National University of Ireland, Galway. Available at:
http://www.mhcirl.ie/documents/publications/The_Economics_of_Mental_Health_Care_in_Ireland%202008.pd
f
10• 408 psychiatric admissions in 2018 were for children and adolescents (63% were female); 31%
depressive disorder; 15% neuroses, 12% schizophrenia and 8% eating disorders
• There were 11,600 self-harm presentations to hospital in 2017, giving a European age-
standardised rate of 199 per 100,000
• Suicide rates have fallen by 26% in the last decade and the rate in 2016 was 8.5 per 100,000 18,
placing Ireland below the EU average for both men and women
• Although, in 2014, 90% of children aged 10–17 reported being happy with their lives, only 30%
of girls aged 15–17 reported feeling happy with the way they were20.
Modifiable Health Behaviour and Lifestyle Factors
Many of the chronic diseases now increasingly prevalent in Ireland may be prevented, or their
effects mitigated, by positive lifestyle changes. Taking regular exercise and having regular social
interaction, eating a healthy diet, consuming alcohol in moderation and not smoking can significantly
improve the length and quality of an individual’s life. There are also prevention programmes that can
impact on health and wellbeing such as vaccination and screening programmes. Several studies have
investigated these determinants of health among the Irish population.
Children (0-14 years)
• In 5-year-olds 15% were overweight and a further 5% were obese; 17% of 5 year old girls were
overweight compared to 13 % of boys, and obesity levels were significantly higher in the lowest
income group (7% versus 4% in the highest income group) 19.
Table 1: Lifestyle risk factors for children participating in the Health Behaviour in School-aged Children (HBSC)
20
survey
Risk Factor National (%)
Overweight/ obese 18.1
Smoking 6.2
Physical active on at least 5 days of the week 50.8
Binge drinking 8.7
Used cannabis in the past year 6.8
Data Source: Health Behaviours in School Aged Children, 2014
Childhood Vaccination
• In Ireland in 2017, the uptake of the 3rd 6 in 1 vaccine by 24 months was 95% 21 and of the MMR
vaccine by 24 months was 92% 21 an increase from a rate of 89% in 2008
• The national rate of HPV2 (at least 2 doses of vaccine) in 2017/18 was 64.1% - an improvement
of 13.1% since 2016/2017.
18
National Suicide Research Foundation. https://www.nsrf.ie/statistics/suicide/
19
Growing Up in Ireland Survey data 2019 and 2018
20
Health Behaviours in School Aged Children, 2014
21
Immunisation Uptake Statistics, Health Protection Surveillance Centre, 2017
11Adults (15-64 years)
• 36% of respondent’s normal weight, 39% are overweight, 23% are obese and 2% are
underweight 22
• The prevalence of smoking has declined from 23% in 2015 to 20% in 2018, with 44% of all
smokers reporting they have tried to quit in the past 12 months 23
• Three-quarters of the population reported drinking alcohol in the past year with 37% of the
population report binge drinking (drinking six or more standard drinks on a typical drinking
occasion)
• Almost two thirds (65%) of the population are aware that people should be active for at least
150 minutes each week 24 with 32% reporting they undertook sufficient levels of physical activity.
Over a third (37%) of the population report that they consume at least five portions of fruit and
vegetables daily
• As in other EU countries, many behavioural risk factors to health in Ireland are more common
among people from groups with lower socioeconomic status. For example, people living in the
most deprived areas of Ireland are more than twice (35%) as likely to smoke as those living in
the least deprived areas (16%). The situation is similar for other risk factors such as binge
drinking and obesity 20.
Screening
• BreastCheck screening remains above target at 76.4% (and above the Organisation for Economic
Co-operation and Development (OCED) average of 60.8%). CervicalCheck screening target is at
78% (slightly higher than OECD average). The national uptake rate of BowelScreen is just above
the target rate of 50%, at 51%
• The 5-year age-standardised survival rates for Breast (85%), Cervical (66.2%) and Bowel cancer
(60.5%), between 2010 and 2014, did not differ significantly from the OECD average.
Older Adults
• A large proportion (45%) of adults aged 50 and over, taking part in The Irish Longitudinal Study
on Ageing (TILDA) study, walked less than 150 minutes per week. This was particularly the case
in those aged 75 and older
• In 2018, 56% of eligible persons aged 65 and over received their flu vaccination (Target rate
75%)
• Table 6 lists the prevalence of certain risk factors among the TILDA population, aged 50 years
and over, in 2017:
Table2: Lifestyle risk factors of adults aged 50 years and over
Risk Factor Per cent
Overweight or Obese 79
Smoking 16.5*
Problem alcohol use 15.9*
Low physical activity 38
5+ portions of fruit and veg 24
Data Source: TILDA, Wave 3, 2017; *Smoking and problematic drinking rates taken from Wave 225
22
Healthy Ireland Survey 2017: Summary of Findings. Ipsos MRBI. https://health.gov.ie/wp-
content/uploads/2017/10/16-048825-Healthy-Ireland-Survey-18-October_for-printing.pdf
23
Healthy Ireland Survey 2018: Summary of Findings. Ipsos MRBI. https://health.gov.ie/wp-
content/uploads/2018/10/Healthy-Ireland-Survey-2018.pdf
24
Healthy Ireland Survey 2016: Summary of Findings. Ipsos MRBI. https://health.gov.ie/wp-
content/uploads/2016/10/Healthy-Ireland-Survey-2016-Summary-Findings.pdf
12Health Inequalities
• Our social environment plays a key role in determining health status. In Ireland, certain groups,
due largely to their socioeconomic status, are at greater risk of poor health outcomes
• It is well recognised that socially-excluded groups have complex health needs and experience
very poor health outcomes. These groups include people who are homeless, people with
substance use disorders, Travellers, asylum-seekers, prisoners and survivors of institutional
abuse
• Ireland is also unusual in a Western European context in the proportion of health funding that
derives from out-of-pocket payments or voluntary health insurance. Out-of-pocket payments
often stop people seeking preventative and necessary healthcare, which can often result in more
serious conditions and more expense at a later point
• Between 2011 and 2016, the number of people in Ireland exposed to deprivation increased by
9.1% and those living in extreme disadvantage increased by 9.8%. 25 In total, 22.5% of the
population (1,072,707 people) are exposed to disadvantage. In 2017, the consistent poverty rate
in Ireland was 6.7%, and 8.8% of children experienced consistent poverty 26
• In July 2019 there were 6,497 adults who were homeless in Ireland – 2,738 were female and
3,759 were male, over 57% were aged between 25 and 44 years. The number of children who
were homeless was 3,778. Between July 2018 and July 2019, homeless figures have increased by
7.9% for adults (6,024 to 6,497) and decreased slightly -2.3% for children (3,867 to 3,778)
nationally. The Dublin region accounts for 66% of all homelessness 27
• Just over a quarter of respondents to a national Traveller survey in 2010 had been a hospital
inpatient either once (15.4%) or more than once (10.6%) in the last 12 months, and a third
(29.7%) had been to A & E. Three-quarters (75.6%) had visited their GP at least once. Utilisation
of other services was less frequent
• A study also stated that life expectancy at birth for Traveller males is 15.1 years lower than the
general male population and suicide rates among male Travellers are 6.6 times higher than
among the general male population 28
• The Roma population in Ireland is estimated to be between 3,000 and 5,000 29. Nearly half of
respondents to a national survey reported that they did not have access to medical cards and GP
care. Almost a quarter (24%) of women had not accessed health services while pregnant and
their first point of access was to give birth
• People with substance use disorders can often have complex health needs. These include mental
health problems and the combined effect of drug and alcohol misuse. In the thirteen-year
period, 2004–2016, there were a total of 8,207 drug-related deaths. In 2017 there was 8,922
cases treated for problem drug use (45% were opiates (mainly heroin), 37% were new cases,
27% were female) 30
25
Survey on Income and Living Conditions (SILC) 2017, CSO, Dec 2018.
https://www.cso.ie/en/releasesandpublications/ep/p-
silc/surveyonincomeandlivingconditionssilc2017/povertyanddeprivation/
26
Survey on Income and Living Conditions (SILC) 2017, CSO, Dec 2018
https://www.cso.ie/en/releasesandpublications/ep/p-
silc/surveyonincomeandlivingconditionssilc2017/povertyanddeprivation/
27
Department of Housing, Planning and Local Government, Homelessness Report, July 2019
https://www.housing.gov.ie/homeless-report-july-2019
28
All Ireland Traveller Health Study Team UCD, Our Geels, All Ireland Traveller Health Study–Summary of
Findings DOHC, 2010
29
National Traveller and Roma Inclusion Strategy 2017-2021
https://www.hse.ie/eng/about/who/primarycare/socialinclusion/travellers-and-roma/roma/national-traveller-
and-roma-inclusion-strategy-2017-2021.pdf
30
National Drug Treatment Reporting System, Health Research Board, 2011-2017
13• In 2017 7,350 cases treated for problem alcohol use (48% were new cases, 35% were
female)25,30.
Children
• In 2017, 8.8% of children (0-17 years) lived in consistent poverty – down from 10.9% in 2016.
63% of all children in consistent poverty are in jobless households 31
• The at-risk of poverty rate for households with one adult and one or more children aged under
18 was 39.9% 32
• 9.7% of Traveller children were reported as having an ongoing health problem. Traveller infant
mortality rates are 3.6 times higher than of the general population 33
• In August 2019 1,726 families (including 3,848 children, 2,850 in the Dublin area) were living in
homelessness 34
• At the end of March 2019 there were 6,005 children in care in Ireland, 646 children were in
private placements, 89% (n = 5,336) of children in care had an allocated social worker, 669
children were awaiting allocation of a social worker 35.
Health Impact of deprivation in childhood
Child poverty, deprivation and homelessness increase the risk of adverse childhood experiences.
The origins of many chronic diseases arise from developmental and biological disruptions that can
occur during the early years of life, starting from the time of conception 36. Quantification of the
negative health effects can be expressed as the population attributable fraction (PAF), i.e. the
proportion of cases of a condition in the population that is attributable to adverse childhood
experience. A US-based study just released reports PAF’s of 23.9% for heavy alcohol consumption,
27.0% for chronic obstructive pulmonary disease, and 44.1% for depression 37.
Adults
• Most socio-demographic groups experienced a decline in 2017 deprivation rates year-on-year.
Those who were not at work due to illness or disability had the highest deprivation rate in 2017
at 45.9%. Those living in households with one adult and one or more children aged under 18
(44.5%) and unemployed individuals (41.0%) also had high deprivation rates in 20174
• The deprivation rate for those at-risk of poverty was 42.8% in 2017 compared with a high of
55.3% in 2013. The deprivation rate for those not at-risk of poverty was 14.3% in 2017,
compared with a high of 25.8% in 20134
• An analysis of consistent poverty rates by principal economic status shows that the consistent
poverty rate was highest among unemployed individuals (24.1%) and those who were not at
work due to illness or disability (24.0%). The consistent poverty rate was lowest among those
who were at work (1.4%) and those who were retired (1.5%)4
31
https://statbank.cso.ie/multiquicktables/quickTables.aspx?id=sia12_sia20
32
https://www.cso.ie/en/releasesandpublications/ep/p-
silc/surveyonincomeandlivingconditionssilc2017/povertyanddeprivation/
33
All Ireland Traveller Health Study Team UCD, Our Geels, All Ireland Traveller Health Study–Summary of
Findings DOHC, 2010
34
https://www.housing.gov.ie/sites/default/files/publications/files/homeless_report_-_august_2019.pdf
35
https://www.tusla.ie/uploads/content/Q1_2019_Service_Performance_and_Activity_Report_V7.0.pdf
36
‘The Impact of Early Childhood on Future Health - Position paper of the Faculty of Public Health Medicine,
Royal College of Physicians of Ireland’, May 2017 at: https://rcpi-live-cdn.s3.amazonaws.com/wp-
content/uploads/2017/05/Impact-of-Early-Childhood-on-Future-Health.pdf
37
Merrick MT, Ford DC, Ports KA, et al. Vital Signs: Estimated Proportion of Adult Health Problems Attributable
to Adverse Childhood Experiences and Implications for Prevention — 25 States, 2015–2017. MMWR Morb
Mortal Wkly Rep. ePub: 5 November 2019. DOI: http://dx.doi.org/10.15585/mmwr.mm6844e1
14• The All Ireland Traveller Health Study found mortality rates significantly higher among Travellers
than among the general population. Mortality rates among Traveller males are 3.7 times higher
than the general male population and among Traveller women mortality rates are 3 times higher
• Prevalence of chronic illness is higher in more deprived areas. The Institute of Public Health in
Ireland has calculated that the incidence of stroke is 2.2 times higher, and Coronary Heart
Disease (CHD) is 2.5 times higher in the most deprived Local Health Office Areas (LHOs)
compared to the least deprived LHOs. In addition, diabetes prevalence in the most deprived
LHOs is 1.4 times that in the least deprived LHOs 38
• The Institute of Public Health in Ireland also estimates that, as a result of Ireland’s ageing
population, by 2020 the number of people living with CHD and stroke will rise by almost 50%
(49.4% and 47.8% respectively) while the number of people with diabetes is likely to rise by 62%,
due principally to a marked increase in maturity-onset diabetes, the primary risk factor for this
condition being obesity which is more prevalent among poorer socio-economic groups6
• The total average rate of suicide in Ireland (per 100,000) in 2016 was 8.5 (n = 399) 39
• There were 11,600 self-harm presentations to hospital that were made by 9,103 individuals in
2017. European age-standardised rate (per 100,000) of self-harm in Ireland in 2017 was 199 40
• At 758 per 100,000, the peak rate for women was among 15-19-year-olds. This rate implies that
one in every 132 girls in this age group presented to hospital in 2017 because of self-harm. The
peak rate for men was 505 per 100,000 among 20-24-year-olds or one in every 198 men. The
incidence of self-harm gradually decreased with increasing age in men. This was the case to a
lesser extent in women as their rate remained relatively stable, at approximately 216 per
100,000, across the 30 to 54-year age range.
38
Balanda, K.P., Barron, S., Fahy, L., McLaughlin, A. Making Chronic Conditions Count: Hypertension, Stroke,
Coronary Heart Disease, Diabetes. A systematic approach to estimating and forecasting population prevalence
on the island of Ireland. Dublin: Institute of Public Health in Ireland, 2010
39
National Suicide Research Foundation. https://www.nsrf.ie/statistics/suicide/
40
National Self-Harm Registry Ireland. https://www.nsrf.ie/statistics/self-harm/
15Appendix - Population Health – Table of Definitions
Deprivation 41
The CSO uses the Pobal Haase-Pratschke Deprivation Index to analyse Irish Health Survey
questionnaire responses experienced by households. The Index uses Census data to measure
levels of disadvantage or affluence in a particular geographical area. More detailed information on
the index can be found here - https://www.pobal.ie/app/uploads/2018/06/The-2016-Pobal-HP-
Deprivation-Index-Introduction-07.pdf
Deprivation is defined as unmet basic human needs. Most deprivation indices are based on a
factor analytical approach which reduces a larger number of indicators to a smaller number of
underlying dimensions, factors or components. This approach is taken a step further in the Pobal
HP Deprivation Index: rather than leaving the dimensions to be defined by data-driven
techniques, the authors develop an a priori conceptualisation of these dimensions. Based on
earlier deprivation indices for Ireland, as well as analyses from other countries, three dimensions
of affluence/disadvantage are identified: Demographic Profile, Social Class Composition and
Labour Market Situation.
Advantage/ Disadvantage
The HP deprivation index measures the relative social advantage (or disadvantage) of each Small
Area.
Homelessness
Homelessness is defined in Section 2 of the Housing Act, 1988 42 as follows:
A person shall be regarded by a housing authority as being homeless for the purposes of this Act
if:
a. there is no accommodation available which, in the opinion of the authority, he, together
with any other person who normally resides with him or who might reasonably be
expected to reside with him, can reasonably occupy or remain in occupation of, or
b. he is living in a hospital, county home, night shelter or other such institution, and is so
living because he has no accommodation of the kind referred to in paragraph (a)".
This definition includes:
— people living in temporary unsecure accommodation.
— people living in emergency bed and breakfast accommodation and hostels/health board
accommodation because they have nowhere else available to them.
— rough sleepers.
— victims of family violence.
Poverty 43
Poverty is deprivation due to a lack of resources, both material and non-material, e.g. income,
housing, health, education, knowledge and culture. It requires a threshold to measure it.
“People are living in poverty if their income and resources (material, cultural and social) are so
inadequate as to preclude them from having a standard of living which is regarded as acceptable
by Irish society generally. As a result of inadequate income and resources people may be excluded
and marginalised from participating in activities which are considered the norm for other people in
society.” – Government 1997.
41
https://www.pobal.ie/app/uploads/2018/06/The-2016-Pobal-HP-Deprivation-Index-Introduction-07.pdf
42
http://www.irishstatutebook.ie/eli/1988/act/28/enacted/en/html
43
http://www.socialinclusion.ie/poverty.html
16At risk of poverty 44
The at-risk-of-poverty rate is the share of people with an equivalised disposable income (after
social transfer) below the at-risk-of-poverty threshold, which is set at 60 % of the national median
equivalised disposable income after social transfers. This indicator does not measure wealth or
poverty, but low income in comparison to other residents in that country, which does not
necessarily imply a low standard of living.
Consistent poverty
This measure identifies the proportion of people, from those with an income below a certain
threshold (less than 60% of median income), who are deprived of two or more goods or services
considered essential for a basic standard of living. The consistent poverty measure was devised in
1987 using indicators of deprivation based on standards of living at that time. The Government in
2007 accepted the advice of the ESRI to revise the deprivation indicators to better reflect current
living standards and, in particular, to focus to a greater degree on items reflecting social inclusion
and participation in society. This resulted in the measure, originally based on lacking one or more
items from an 8-item index, changing to one based on lacking two or more items from the
following 11-item index:
— Two pairs of strong shoes.
— A warm waterproof overcoat.
— Buy new not second-hand clothes.
— Eat meals with meat, chicken, fish (or vegetarian equivalent) every second day.
— Have a roast joint or its equivalent once a week.
— Had to go without heating during the last year through lack of money.
— Keep the home adequately warm.
— Buy presents for family or friends at least once a year.
— Replace any worn out furniture.
— Have family or friends for a drink or meal once a month.
— Have a morning, afternoon or evening out in the last fortnight, for entertainment.
Social exclusion
This is being unable to participate in society because of a lack of resources that are normally
available to the general population. It can refer to both individuals, and communities in a broader
framework, with linked problems such as low incomes, poor housing, high crime environments
and family problems.
Inequality
This is a comparative or relative concept. It does not measure deprivation or poverty and does not
require a threshold. It is possible for inequality to exist with or without poverty. Similarly, poverty
can exist with or without inequality.
44
https://ec.europa.eu/eurostat/statistics-explained/index.php/Glossary:At-risk-of-poverty_rate
17You can also read