Pollen DNA metabarcoding identifies regional provenance and high plant diversity in Australian honey
←
→
Page content transcription
If your browser does not render page correctly, please read the page content below
Received: 11 January 2021 | Revised: 23 April 2021 | Accepted: 27 April 2021
DOI: 10.1002/ece3.7679
ORIGINAL RESEARCH
Pollen DNA metabarcoding identifies regional provenance and
high plant diversity in Australian honey
Liz Milla1 | Kale Sniderman2 | Rose Lines3 | Mahsa Mousavi-Derazmahalleh3 |
Francisco Encinas-Viso1
1
Centre for Australian National Biodiversity
Research, CSIRO, Canberra, ACT, Australia Abstract
2
School of Earth Sciences, The University of Accurate identification of the botanical components of honey can be used to estab-
Melbourne, Melbourne, Vic., Australia
lish its geographical provenance, while also providing insights into honeybee (Apis
3
eDNA Frontiers Laboratory, Curtin
University, Perth, WA, Australia
mellifera L.) diet and foraging preferences. DNA metabarcoding has been demon-
strated as a robust method to identify plant species from pollen and pollen-based
Correspondence
Liz Milla, Centre for Australian National
products, including honey. We investigated the use of pollen metabarcoding to iden-
Biodiversity Research, CSIRO, Clunies Ross tify the floral sources and local foraging preferences of honeybees using 15 honey
Street, Canberra, ACT, Australia.
Email: liz.milla@csiro.au
samples from six bioregions from eastern and western Australia. We used two plant
metabarcoding markers, ITS2 and the trnL P6 loop. Both markers combined identi-
Funding information
CSIRO Environomics Future Science
fied a total of 55 plant families, 67 genera, and 43 species. The trnL P6 loop marker
Platform provided significantly higher detection of taxa, detecting an average of 15.6 taxa per
sample, compared to 4.6 with ITS2. Most honeys were dominated by Eucalyptus and
other Myrtaceae species, with a few honeys dominated by Macadamia (Proteaceae)
and Fabaceae. Metabarcoding detected the nominal primary source provided by bee-
keepers among the top five most abundant taxa for 85% of samples. We found that
eastern and western honeys could be clearly differentiated by their floral composi-
tion, and clustered into bioregions with the trnL marker. Comparison with previous
results obtained from melissopalynology shows that metabarcoding can detect simi-
lar numbers of plant families and genera, but provides significantly higher resolution
at species level. Our results show that pollen DNA metabarcoding is a powerful and
robust method for detecting honey provenance and examining the diet of honey-
bees. This is particularly relevant for hives foraging on the unique and diverse flora of
the Australian continent, with the potential to be used as a novel monitoring tool for
honeybee floral resources.
KEYWORDS
bee nutrition, biomonitoring, European honeybee, ITS2, metabarcoding, molecular diet
analysis, plant DNA, trnL
This is an open access article under the terms of the Creative Commons Attribution License, which permits use, distribution and reproduction in any medium,
provided the original work is properly cited.
© 2021 Commonwealth Scientific and Industrial Research Organisation. Ecology and Evolution published by John Wiley & Sons Ltd.
Ecology and Evolution. 2021;11:8683–8698. www.ecolevol.org | 86838684 | MILLA et al.
1 | I NTRO D U C TI O N of Eucalyptus honeys in Europe could not be relied upon for Australian
products, as the palynological profile of Australian Eucalyptus honey
European honeybees (Apis mellifera L.) are one of the most important was substantially different to that of southern European Eucalyptus
pollinators of crops worldwide (Calderone, 2012; Potts et al., 2010), honey. They determined that this discrepancy was mainly due to the
as well as the principal producers of commercial honey and pollen presence of species indigenous to Australia. Consequently, the nutri-
products (Pascoal et al., 2014). Recently, interest has grown in im- tional needs of bee colonies in countries with a unique and diverse
proved hive management practices due to large reported declines flora such as Australia are likely to be met by a very different suite of
in global colony numbers (Dainat et al., 2012; Ellis et al., 2010; Seitz plants than those found in Europe or North America.
et al., 2015; vanEngelsdorp et al., 2010). Many hive failures are at- Pollen DNA metabarcoding, a molecular method for pollen
tributed to colony collapse disorder (Johnson et al., 2010; Ratnieks identification, has been used several times to investigate foraging
& Carreck, 2010; vanEngelsdorp et al., 2009), a phenomenon driven by bees (Cornman et al., 2015; Galimberti et al., 2014; Nürnberger
largely by the interaction between the mite Varroa destructor and de- et al., 2019; Richardson, Lin, Quijia, et al., 2015; de Vere et al., 2017;
formed wing virus (Dahle, 2015; Dainat et al., 2012; Guzmán-Novoa Wilson et al., 2010) and to establish the floral content and geograph-
et al., 2010), and exacerbated by other stressors such as poor nutri- ical provenance of honey (Bruni et al., 2015; Hawkins et al., 2015;
tion (Roberts et al., 2017). Accordingly, identifying and managing the Utzeri et al., 2018). Pollen DNA metabarcoding is an easily scalable
nutritional needs of hives by providing adequate floral resources is method that can detect higher numbers of taxa than microscopy
one of the recommendations to improve honeybee health and help (Keller et al., 2015; Smart et al., 2017), with greater resolution and
reduce colony loss (Goulson et al., 2015; Mao et al., 2013). repeatability of results (Hawkins et al., 2015). However, there are
The nutritional intake of honeybees comes from plant nectar no individual genetic markers that can discriminate all known plant
and pollen (Brodschneider & Crailsheim, 2010). Studies of honey- diversity (Hollingsworth et al., 2009, 2011), and estimating the pro-
bee diets have suggested a diversity of pollen can lead to benefits portions of taxa present in samples with DNA metabarcoding can be
such as increased lifespan and improved immunocompetency (Alaux challenging (Baksay et al., 2020; Piñol et al., 2019), for example, due to
et al., 2010; Pasquale et al., 2013). Therefore, a lack of suitably diverse DNA extraction or PCR biases (Bell et al., 2016; Pornon et al., 2016).
foraging habitat, potentially in decline due to factors such as climate Nonetheless, the advantages of molecular over traditional meth-
change, intensive farming practices, and urbanization, could lead to ods can be significant. For example, as honey contains DNA from
poor nutritional outcomes for bees (Donkersley et al., 2014; Goulson both pollen- and nectar-providing plants (Prosser & Hebert, 2017),
et al., 2015; Naug, 2009). While the foraging distance of honeybees molecular methods can identify a broader range of plants in a colo-
can reach several kilometers, it may be as short as a few hundred ny's diet than pollen analysis alone. Previous metabarcoding studies
meters depending on the resources available, the season and sur- from honey have revealed that while honeybees are generalists, only
rounding landscape structure (Beekman & Ratnieks, 2000; Couvillon a small proportion of the flowering taxa seems to be abundant in
et al., 2015; Danner et al., 2017). Consequently, the availability of suit- their diet, with many species present in small proportions (Hawkins
able foraging plants is likely to vary considerably between individual et al., 2015; de Vere et al., 2017). While care must be taken to re-
hive locations. As anecdotal evidence of bee foraging can be unreliable move false positives and background contamination that are com-
(Garbuzov & Ratnieks, 2014), empirical methods to identify foraged monly found in metabarcoding results (Ficetola et al., 2015), plant
plants are preferable. Honey is a direct product of honeybee foraging; taxa present in very low proportions could represent an important
thus, it is highly suitable to study their long-term nutritional needs. nutritional contribution for overall health (Pasquale et al., 2013;
Pollen derived from honey can easily capture longer foraging intervals Requier et al., 2015). Metabarcoding studies have also demonstrated
than pollen traps, commonly used plastic enclosures that remove pol- that pollen foraged by honeybees can reflect the local plant biodi-
len pellets from the corbiculae as bees enter the hive, impacting hive versity and flowering phenology (Cornman et al., 2015; Galimberti
health and foraging activity when used for extended periods (Dubois et al., 2014), and could be used to detect and monitor the presence
et al., 2018; Webster et al., 1985). Microscopy-based pollen identifica- of plant species of interest (Bell, de Vere, et al., 2016; Richardson,
tion methods have been widely applied to establish the geographical Lin, Sponsler, et al., 2015; Tremblay et al., 2019).
provenance and floristic origin of honey (Von Aronne & Micco, 2010; Most pollen metabarcoding studies, including those using honey
der Ohe et al., 2004) and as a quality control protocol, particularly in pollen, have been conducted in European or North American coun-
the European Union (EU Directive Council, 2001). The traditional mi- tries. There are very few pollen metabarcoding studies from Australia
croscopy method, known as melissopalynology, is a time-consuming (Elliott et al., 2021; McFrederick & Rehan, 2019), where there are many
task requiring considerable expertise and knowledge of local flora endemic plant species. Australian landscapes are currently divided into
and often cannot provide taxonomic resolution beyond family or 89 large geographically distinct bioregions, based on common factors
genus level (Khansari et al., 2012; Sniderman et al., 2018; Thornhill & such as climate, geology, landform, and native vegetation, through a
Crisp, 2012). Melissopalynology has only been recently applied to ex- system known as the Interim Biogeographical Regionalisation for
amine the pollen composition of Australian honey in order to determine Australia (IBRA) (Thackway & Cresswell, 1997). In this study, we use
its geographical provenance. In their study, Sniderman et al. (2018) pollen metabarcoding to examine the floral content of 15 commercially
found that the current palynological criteria used to verify the origin produced honeys from eastern and western Australia, sourced fromMILLA et al. | 8685
twelve localities within six different IBRA regions, and previously char- (Table 1). Each sample was collected in clean food-grade containers
acterized via melissopalynology by Sniderman et al. (2018). We chose filled directly from beekeeper extractions from single apiaries, and
two commonly used plant metabarcoding markers, ribosomal inter- sampling equipment was cleaned between each collection to avoid
nal transcribed region 2 (ITS2), and the P6 loop region of the transfer cross-contamination as detailed in Sniderman et al. (2018). Samples
RNA gene for Leucine (trnL). ITS2 has been shown to provide good were stored at room temperature until 2019, when they were trans-
discriminatory power in pollen metabarcoding studies, particularly at ferred to a −20°C freezer. To take a subsample, the containers were
the genus level (Keller et al., 2015; Richardson et al., 2019; Richardson, first placed in a water bath at 40°C for 30 min to reduce viscos-
Lin, Sponsler, et al., 2015). The trnL P6 loop is a very short chloroplast ity. Between 6.4 and 11 g of honey were taken from each container
region with high amplification success, and it has been effective in de- using a sterile large syringe, and transferred to sterile 50-ml tubes,
tecting plant taxa in honey (Pornon et al., 2016; Valentini et al., 2010). which were stored at −20°C until DNA extraction.
We first compare the plant taxonomic resolution provided by each of
the two metabarcoding markers and then compare the combined iden-
tifications to a previous study of the same honey samples using light 2.2 | DNA extraction and sequencing
microscopy. Finally, we also examine whether pollen found in honey
reflects the flora from its IBRA region of origin, and determine the use- DNA extractions from each subsample were conducted in November
fulness of pollen metabarcoding in discriminating between bioregions, 2019 and March 2020. The pollen isolation protocol for honey was
and in detecting plant species from a particular locality. modified from de Vere et al. (2017). Samples were diluted with ster-
ile water to make up to 15 ml. These mixtures were incubated for
30 min in a water bath at 65°C, with occasional vortexing. After in-
2 | M ATE R I A L S A N D M E TH O DS cubation, mixtures were centrifuged for 15 min at 7,000 rpm at room
temperature. The supernatant was discarded and the remaining pel-
2.1 | Honey selection let resuspended in 400 μl of lysis buffer (CF buffer in the Macherey-
Nagel DNA Food extraction kit) and transferred to a 1.5-ml tube,
We selected 15 honey samples from twelve localities located within to which 20 μl of Proteinase K was added. The samples, includ-
six Australian IBRA regions. The raw honey samples were collected ing a blank lysis control (consisting of 400 μl buffer CF and 20 μl
in January (n = 3), September (n = 1), and October (n = 11) 2015 Proteinase K), were then incubated in a shaker oven at 65°C for 1 hr.
TA B L E 1 Australian honey samples analyzed in this study
Sample Approximate IBRA Producer nominated Collected Sample Total
Australian region ID locality State region source Mon-Y Y weight (g) DNA (ng)
West SJ1 Yanchep WA SWA Spring Eucalypt Oct-15 4.024 12.375
West SJ2 Wanneroo WA SWA Mild spring Eucalypt Oct-15 3.947 10.88
West SJ3 Gingin WA SWA Spring Eucalypt Jan-15 4.936 10.215
West SJ4 Lancelin WA SWA Spring Eucalypt Jan-15 4.506 11.595
West SJ5 Lancelin WA SWA Spring Eucalypt Jan-15 4.311 11.585
East SJ6 Cunnamulla Qld MUL Yapunyah Oct-15 4.355 11.485
East SJ7 Tingha NSW NET Canola Oct-15 4.476 11.635
East SJ8 Cunnamulla Qld MUL Yapunyah Oct-15 3.808 11.885
East SJ9 Warwick Qld BBS Mixed Honey Oct-15 4.176 6.955
East SJ10 Warwick Qld BBS Macadamia Oct-15 3.3 7.84
East SJ11 Tamworth NSW NAN White Box/Mixed Sep-15 4.513 7.3
honey
East SJ12 Blackstone Qld SEQ Blue Gum/Mixed Oct--15 3.837 7.325
Honey
East SJ13 Bundaberg Qld SEQ Macadamia Oct-15 3.52 8.175
East SJ14 Maclean Qld SEQ Mixed Honey/ Oct-15 3.887 7.87
Macadamia
East SJ15 Lismore NSW SEQ Macadamia Oct-15 3.644 7.565
Note: Interim Biogeographic Regionalisation for Australia (IBRA) codes listed are as follows: BBS = Brigalow Belt South, MUL = Mulga Lands, NAN =
Nandewar, NET = New England Tablelands, SEQ = South East Queensland, SWA = Swan Coastal Plain. Collected Mon-Y Y refers to month and year
honey was sourced by producer, Sample weight (g) refers to subsample weight used for DNA extraction, and Total DNA (ng) refers to weight of DNA
from subsample extraction.8686 | MILLA et al.
TA B L E 2 DOI numbers for Atlas of
IBRA Region Code DOI
Living Australia (ALA) record downloads
Brigalow Belt South BBS 10.26197/ala. used to construct taxonomy database
c42165a0-fcc6-4552-a28a-74d0978e582b (www.ala.org)
Mulga Lands MUL 10.26197/
ala.67738621-dcb0-4346-a6f6-53f2cbbe82e3
Nandewar NAN 10.26197/ala.
e708fa9d-54bd-4936--95cf-767d967e6e57
New England NET 10.26197/ala.
Tablelands bac1a9c1-3133-4e49-b37d-c a0d8fca2a12
South Eastern SEQ 10.26197/
Queensland ala.3198417c-2a27-43d0-9c43-c9c2fd81d036
Swan Coastal Plain SWA 10.26197/
ala.77257667-f 711-4aac-b345-6cdf24a4d7c6
DNA extraction then proceeded as per the manufacturer's protocol results by reducing the number of potentially erroneous matches
(Macherey-Nagel). Final DNA concentrations were quantified using (Tab erlet et al., 2006). For this study, the localities given as the
a Quantus (Promega Corporation) fluorometer. honey source were given only by name, to which approximate co-
ordinates were assigned by Sniderman et al. (2018). To construct
local reference databases for ITS2 and trnL, we first downloaded all
2.3 | DNA metabarcoding and sequencing plant records from the six IBRA regions where the localities were
found from the Atlas of Living Australia (www.ala.org, Table 2) and
An initial PCR was performed in duplicate reactions on each DNA extrac- filtered each list to species that had at least three records from the
tion, to determine the DNA dilution for optimal amplification by adding area since 1980. We used a custom R (R Core Team, 2019) script
DNA template either directly to the PCR master mix, or as a 1/10 dilu- to search for species by name in ITS2DB (Ankenbrand et al., 2015)
tion. PCR master mixes comprised: 2.5 mM MgCl2 (Applied Biosystems), and PlantAligDB trnL_GH (Santos et al., 2019), both downloaded 26
10× PCR Gold buffer (Applied Biosystems), 0.25 mM dNTPs (Astral August 2020, and to generate FASTA files with taxonomy lineage
Scientific, Australia), 0.4 mg/ml bovine serum albumin (Fisher Biotec), headers. Searchable databases were created from the resulting se-
0.4 μmol/l forward and reverse primers, 0.6 μl of a 1:10,000 solution of quence reference files using the USEARCH (Edgar, 2010) makeudb
SYBR Green dye (Life Technologies), and 1 U AmpliTaq Gold DNA poly- program.
merase (Applied Biosystems). All PCRs had a volume of 25 µl and were
performed using StepOne Plus Instruments (Applied Biosystems). PCR
cycling conditions consisted of denaturation at 95°C for 5 min, followed 2.5 | Data processing and taxonomy assignment
by 50 cycles of: 95°C for 30 s, 52°C (trnL) or 55°C (ITS2) for 30 s, 72°C for
45 s, finishing with a final extension stage at 72°C for 10 min. Adapters were removed from raw sequencing reads using
Indexing of samples was achieved using unique, single use com- AdapterRemoval (Schubert et al., 2016), and trimmed reads fil-
binations of 8 bp multiplex identifier-t agged (MID-t ag) primers as tered to quality ≥20 using the USEARCH fastq_filter function.
described in Koziol et al. (2019) and van der Heyde et al. (2020). MID- Additionally, for paired-end ITS2, reads 1 and 2 were merged by
tag PCRs were prepared using a Qiagility instrument (Qiagen) using setting the minimum overlapping sequence length to 13. OBITools
the same master mix and PCR conditions as described. Negative and (Boyer et al., 2016) was used to demultiplex all samples. We then
positive PCR controls for both trnL and ITS2 were included to ensure used OBITools and mothur (Schloss et al., 2009) to remove ITS2 se-
validity of results. Sequencing libraries were pooled equimolarly quences smaller than 200 and >450 bp, and trnL sequences 180 bp. Clean sequencing reads were grouped into molecular
using a Pippin instrument (Sage Sciences), quantified on a Qubit taxonomic units (MOTUs), representing putative individual species.
(Thermo Fisher), and diluted to 2nM. Libraries were sequenced on We merged unique reads with the USEARCH fastqx_uniques func-
an Illumina MiSeq instrument using 300 cycle V2 kit (trnL) or 500 tion and generated denoised MOTUs (zero-noise operational taxo-
cycle kit (ITS2) with custom sequencing primers. nomic units, or ZOTUs) with the unoise3 algorithm. We mapped the
filtered reads back to add read counts per ZOTU. To identify each
ZOTU, we searched the ZOTUs against the custom databases using
2.4 | Reference database construction the USEARCH sintax command with a 90% bootstrap cutoff. We
also searched all sequences against the NCBI nt database with an e-
Sequence reference databases containing taxa known to occur in value of 1e−5. The top five BLAST results were parsed using the py-
the locality can improve the taxonomic resolution of metabarcoding thon script taxonomy_assignment_BLAST_V1.py (github: Joseph7e/MILLA et al. | 8687 Assign-Taxonomy-with-BLAST), which assigns the lowest level of identifications from trnL and ITS2 to every level of taxonomic identifi- taxonomic identification (species < genus < family) from the results. cation (family, genus, species, and taxon). To compare identifications at We compared the results against the USEARCH results and removed taxon level, we considered each pollen morphospecies identified in the ZOTUs where the family or genus assigned by USEARCH differed microscopy results as equivalent to a taxon, see Table S1. As with the from the consensus BLAST taxonomy. metabarcoding data, we filtered out taxa represented by
8688 | MILLA et al.
We identified significantly more taxa per sample with trnL than floral source. In the ITS2 metabarcoding results, we considered both
with ITS2 (mean trnL = 15.6, ITS2 = 4.6; Wilcoxon rank-sum test, Eucalyptus and Corymbia as positive identifications for samples la-
two-t ailed, p < 0.001; Figure 1a). While the total numbers of identi- beled as eucalypt. For trnL, the lack of resolution for any Eucalyptus
fied taxa differed greatly, we found a high overlap between the num- species meant that results were likely contained within Myrtaceae
ber of families detected by both ITS2 and trnL (eight of 10 families sp., and we considered this a positive identification. Macadamia in-
detected by ITS2 also detected by trnL). However, the overlap be- tegrifolia was listed as the second most common predominant flo-
tween the genera identified by both markers was low (4 of 16 genera ral source of pollen and nectar, nominated for four honeys from
found by ITS2 also found by trnL). This result is partly due to the dif- Queensland and New South Wales (SJ10, SJ13, SJ14, and SJ15). It
ferences in taxonomic resolution by each marker, but may also rep- was detected in the highest abundance in those four samples by the
resent marker amplification bias. A total of 103 taxa (Table S2) were trnL results. Macadamia was also detected in another eastern sample
identified by both markers combined, with 43 identified to species (SJ12, trnL: 1.28%) as well as in four western samples, albeit in very
level, 33 to genus level and 27 to family level. Overall, we detected low proportions (trnL: 2.5%) in six
and Melaleuca nodosa (9). The top plant families by relative abun- honeys, including two western Australian honeys (SJ2 trnL: 25.92%
dance found in honey samples by each marker are shown in Figure 2. and SJ3 trnL: 5.19%). There was only one Melaleuca reference se-
The predominant floral source given by the beekeeper/producer quence in the trnL custom database (and no relevant hit from the
was detected at genus or family level in the top five most abun- NCBI nt database); therefore, it is likely that this species is instead a
dant taxa for 12 of the 14 honeys (Table 3). For nine of the sam- western species of Melaleuca.
ples, generic eucalypt (alternatively labeled as White Box, Spring There was no significant difference in the taxon richness of
Eucalypt, Yapunyah, and Blue Gum) was nominated as the primary western and eastern honeys when combining the numbers of
(a) (b)
***
30
25
25
Count of taxa detected
Count of taxa detected
20
20
15
15 ***
10 10
5
5
0
0 ITS2 trnL families genera species taxa
F I G U R E 1 (a) Comparison of taxa detected per sample by metabarcoding markers different levels of identification. Purple colour
represents ITS2, pink represents trnL. (b) Comparison of taxa detected per sample by combined metabarcoding markers and microscopy at
different levels of identification. Green colour represents metabarcoding results and orange represents microscopy resultsMILLA et al. | 8689
−30.5 trnL ITS2
−31.0 5 5
4
SWA SWA
3 3
−31.5
1 1
2 2
Western honey
latitude
115.0 115.5 116.0 116.5 115.0 115.5 116.0 116.5
−22.5 Eastern honey
−25.0 13 13
BBS BBS
SEQ
14
MUL MUL
−27.5 12
9 9
8 6 10 8 6 10
15 15
−30.0 7 7
NET NET
NAN 11 NAN 11
−32.5
145 150 155 145 150 155
longitude
Plant family
Adoxaceae Casuarinaceae Myrtaceae Plantaginaceae Solanaceae
Asteraceae Euphorbiaceae Oleaceae Proteaceae Verbenaceae
Brassicaceae Fabaceae Others Rosaceae
Cannabaceae Lauraceae Passifloraceae Salicaceae
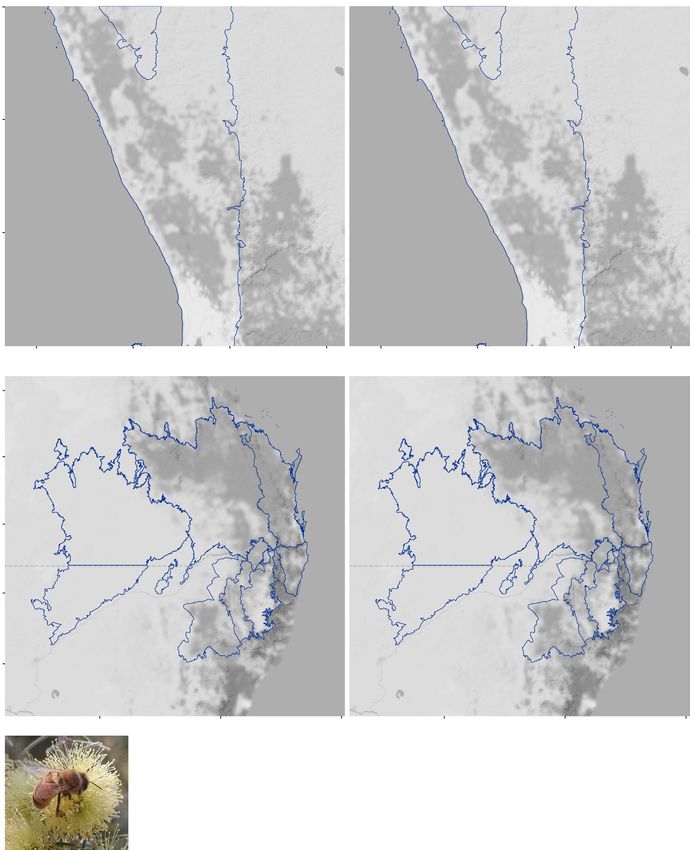
F I G U R E 2 Relative abundance of plant families found in 15 honey samples by trnL (left panels) and ITS2 (right panels). Families of taxa
found at abundancesTA B L E 3 Top five taxa by relative abundance detected by metabarcoding and microscopy (relative proportion of identified reads—metabarcoding, or relative proportion of grains—
8690
microscopy, in brackets) in each honey sample
|
Region ID Description trnL ITS2 Microscopy
West SJ1 Spring Eucalypt, Fabaceae sp. (0.723), Myrtaceae sp. (0.081), Corymbia sp. (0.566), Brassicaceae sp. (0.421), Corymbia sp. (0.376), Eucalyptus sp. (0.256), Acacia
WA Proteaceae sp. (0.065), Pelargonium sp. (0.033), Brassica sp. (0.013) sp. (0.106), Leucopogon sp. (0.073), Banksia sp.
Grevillea sp. (0.031) (0.064)
West SJ2 Mild spring Melaleuca nodosa (0.259), Fabaceae sp. (0.214), Myrtaceae sp. (0.981), Jacksonia horrida (0.015), Eucalyptus sp. (0.518), Corymbia sp. (0.128),
Eucalypt, WA Casuarina sp. (0.133), Myrtaceae sp. (0.12), Brassicaceae sp. (0.005) Fabaceae sp. (0.063), Leucopogon sp. (0.061),
Proteaceae sp. (0.073) Banksia sp. (0.056)
West SJ3 Spring Eucalypt, Proteaceae sp. (0.323), Myrtaceae sp. (0.242), Myrtaceae sp. (0.418), Asteraceae sp. (0.246), Eucalyptus sp. (0.413), Echium sp. (0.2), Corymbia
WA Fabaceae sp. (0.186), Melaleuca nodosa (0.052), Brassicaceae sp. (0.113), Arctotheca sp. (0.105), sp. (0.107), Banksia sp. (0.076), Leptospermeae
Daviesia ulicifolia (0.031) Daviesia divaricata (0.075) sp. (0.066)
West SJ4 Spring Eucalypt, Brassicaceae sp. (0.338), Myrtaceae sp. (0.295), Eucalyptus sp. (0.473), Corymbia sp. (0.295),
WA Proteaceae sp. (0.142), Diplotaxis tenuifolia (0.101), Brassicaceae sp. (0.082), Oleaceae sp. (0.078),
Fabaceae sp. (0.079) Banksia sp. (0.021)
West SJ5 Spring Eucalypt, Fabaceae sp. (0.508), Grevillea sp. (0.186), Asteraceae sp. (0.616), Plantago lanceolata Eucalyptus sp. (0.533), Corymbia sp. (0.252),
WA Proteaceae sp. (0.11), Myrtaceae sp. (0.107), (0.384) Brassicaceae sp. (0.064), Acacia sp. (0.044),
Brassicaceae sp. (0.071) Banksia sp. (0.04)
East SJ6 Yapunyah Myrtaceae sp. (0.844), Fabaceae sp. (0.083), Eucalyptus sp. (0.77), Asteraceae sp. (0.175), Eucalyptus sp. (0.937), Tubuliflorae sp. (0.021),
Casuarina sp. (0.038), Asteraceae sp. (0.022), Glycine max (0.052), Fabaceae sp. (0.001) Brassicaceae sp. (0.013), Myoporeae sp. Large
Scrophulariaceae sp. (0.013) (0.013), Myoporeae sp. Small (0.005)
East SJ7 Canola Brassicaceae sp. (0.526), Vicia sp. (0.343), Diplotaxis Eucalyptus sp. (1) Brassicaceae sp. (0.695), Eucalyptus sp. (0.17),
tenuifolia (0.055), Fabaceae sp. (0.029), Myrtaceae Vicia sp. (0.106), Centaurea sp. Centaurea (0.008),
sp. (0.027) Corymbia sp. (0.005)
East SJ8 Yapunyah Myrtaceae sp. (0.554), Brassicaceae sp. (0.269), Brassica sp. (0.503), Brassicaceae sp. (0.352), Eucalyptus sp. (0.483), Corymbia sp. (0.227),
Asteraceae sp. (0.07), Fabaceae sp. (0.055), Glycine max (0.079), Eucalyptus sp. (0.046), Myoporeae sp. Large (0.196), Brassicaceae sp.
Scrophulariaceae sp. (0.042) Trifolium repens (0.012) (0.035), Tubuliflorae sp. (0.03)
East SJ9 Mixed Honey Trifolium sp. (0.416), Myrtaceae sp. (0.405), Eucalyptus sp. (0.819), Myrtaceae sp. (0.149), Eucalyptus sp. (0.58), Acacia sp. (0.271),
Fabaceae sp. (0.124), Brassicaceae sp. (0.024), Fabaceae sp. (0.021), Pisum sp. (0.01) Brassicaceae sp. (0.071), Goodeniaceae sp.
Solanaceae sp. (0.017) (0.039), Polygonum sp. (0.019)
East SJ10 Macadamia Brassicaceae sp. (0.227), Mallotus sp. (0.176), Brassica sp. (0.635), Trifolium repens (0.096), Brassicaceae sp. (0.414), Macadamia sp. (0.275),
Trifolium sp. (0.148), Macadamia integrifolia Brassicaceae sp. (0.095), Fabaceae sp. (0.082), Eucalyptus sp. (0.103), Tubuliflorae sp. (0.052),
(0.107), Verbenaceae sp. (0.078) Trifolium sp. (0.047) Vicia sp. (0.043)
East SJ11 White Box/ Myrtaceae sp. (0.581), Asteraceae sp. (0.082), Eucalyptus sp. (1) Eucalyptus sp. (0.917), Corymbia sp. (0.03),
Mixed honey Oleaceae sp. (0.069), Solanaceae sp. (0.062), Centaurea sp. Centaurea (0.018), Brassicaceae sp.
Medicago sativa (0.04) (0.014), Tubuliflorae sp. (0.007)
East SJ12 Blue Gum/ Cannabaceae sp. (0.326), Myrtaceae sp. (0.177), Eucalyptus sp. (0.332), Macadamia sp. (0.258),
Mixed Honey Melaleuca nodosa (0.114), Brassicaceae sp. (0.066), Rutaceae sp. (0.088), Acacia sp. (0.072),
Verbenaceae sp. (0.05) Undetermined sp. Monocot (0.048)
MILLA et al.
(Continues)MILLA et al. | 8691
taxa detected by both markers (Wilcox rank-sum test, p = 0.243).
Note: Bold underlined type indicates where the main floral source nominated by the producer has been detected. For Eucalypt/White Box/Yapunyah/Blue Gum, we highlight Myrtaceae sp. for trnL, and
However, there was a close-to-significant difference in diet com-
Macadamia sp. (0.526), Eucalyptus sp. (0.195),
position (beta diversity) based on the PERMANOVA dissimilarity
Macadamia sp. (0.356), Eucalyptus sp. (0.17),
Macadamia sp. (0.106), Elaeocarpaceae sp.
Eucalyptus sp. (0.499), Fabaceae sp. (0.119),
Fabaceae sp. (0.081), Trifolium sp. (0.054),
Fabaceae sp. (0.142), Trifolium sp. (0.084),
analysis of the ITS2 results (index = Canberra, p = 0.059) and highly
significant with trnL (index = Canberra, p = 0.001). The principal co-
ordinate ordination analyses could clearly separate the eastern and
(0.075), Tubuliflorae sp. (0.05)
western regions by relative abundance (Figure 3a,c) and presence/
absence data (Figure 3b,d) using either marker.
Tubuliflorae sp. (0.076)
To determine whether the pollen composition of each honey
Corymbia sp. (0.025)
reflected its regional origin, we compared the plants detected by
metabarcoding to the list of plants from the corresponding IBRA
Microscopy
region. We found the majority of genera detected in samples from a
given region matched to genera found in the corresponding IBRA list
(BBS: 74%, MUL: 75%, NAN: 100%, NET: 83%, SEQ: 86%, and SWA:
79%). At species level, the percentages of species found in the cor-
responding IBRA list were lower, particularly for Mulga Lands and
New England Tablelands (BBS: 50%, MUL: 25%, NAN: 57%, NET:
33%, SEQ: 63%, and SWA: 40%). Some of the species detected in
western honeys were commonly cultivated or invasive non-natives,
such as B. napus and Plantago lanceolata. However, some species
detected in western honeys that occur mainly in eastern Australia,
such as Echium vulgare (Boraginaceae), Daviesia ulicifolia (Fabaceae),
Populus deltoides (1)
and M. nodosa (Myrtaceae), were likely matched due to the lack of a
Macadamia sp. (1)
western species reference for the same genus. In the eastern hon-
eys, 23 plant species were identified from the eastern plant refer-
ences, while five were identified by BLAST. In the western honeys,
ITS2
10 species were found in the western references, while 14 were
identified from the eastern list or BLAST. The clustering analysis for
ITS2 based on relative abundances (Figure 4a) did not generate any
(0.083), Plantago lanceolata (0.055), a Macadamia
Melaleuca nodosa (0.162), Asteraceae sp. (0.145),
clusters reflecting the region of origin. However, the correspond-
Viburnum sp. (0.096), a Macadamia integrifolia
Macadamia integrifolia (0.232), Lauraceae sp.
(0.211), Asteraceae sp. (0.176), Passiflora sp.
(0.107), Mallotus sp. (0.094), Asteraceae sp.
ing clustering analysis for trnL (Figure 4b) showed a clear grouping
Trifolium sp. (0.391), Austrocallerya australis
Trifolium sp. (0.142), Fabaceae sp. (0.124),
for the Swan Coastal Plains (SWA, western region) samples with
one exception (SJ4), and clustering of all samples from South East
Queensland (SEQ, eastern region) with one sample from another
(0.141), Capsicum sp. (0.082)
IBRA region, Brigalow Belt South (SJ10). Mulga Lands (MUL, east-
ern regions) samples also clustered together, although this cluster is
based on only two samples.
integrifolia (0.021)
3.3 | Comparison to microscopy results
(0.075)
trnL
The comparison of the number of taxa identified per sample at each
taxonomic level shows that while the metabarcoding markers com-
Corymbia sp. and Eucalyptus sp. for ITS2.
Taxon detected outside of the top five.
Mixed Honey/
bined detect a higher mean number of taxa than microscopy at all
Macadamia
Description
Macadamia
Macadamia
taxonomic levels, these differences were not significant at family
(Wilcoxon rank-sum test, one-tailed, p = 0.202), genus (Wilcoxon rank-
(Continued)
sum test, one-tailed, p = 0.088), or taxon (Wilcoxon rank-sum test,
one-tailed, p = 0.266) level. There was, however, a significant differ-
SJ15
SJ13
SJ14
ence at species level (Wilcoxon rank-sum test, one-tailed, p < 0.001;
ID
Figure 1b), with metabarcoding identifying 43 species, none of which
TA B L E 3
could be identified through microscopy. Based on the overall taxa
Region
detected by the combined markers, metabarcoding detected 67.7%
East
East
East
of the same families and 44.4% of the same genera as microscopy.
a8692 | MILLA et al.
(a) Relative abundance - ITS2 (b) Presence/absence - ITS2
0.50
0.25
0.25
0.00 West East
MDS1 29.39%
MDS1 23.07%
0.00 West East
−0.25
−0.25
−0.50
−0.50
−0.75
−0.50 −0.25 0.00 0.25 0.50 −0.6 −0.3 0.0 0.3
CAP1 19.62% CAP1 14.94%
(c) Relative abundance - trnL (d) Presence/absence - trnL
0.50
0.4
0.25
MDS1 32.26%
MDS1 23.92%
0.0 West East
0.00 West East
−0.4
−0.25
−0.6 −0.3 0.0 0.3 −0.4 −0.2 0.0 0.2
CAP1 17.02% CAP1 15.29%
F I G U R E 3 PCoA plots for ITS2 and trnL generated using Constrained Analysis of Principal Coordinates (CAP) and Horn's distance. Green
represents Western Australia honey samples, and blue represents Eastern Australia honey samples. (a) ITS2 using relative read abundance per sample
values, (b) ITS2 using presence/absence values, (c) trnL using relative read abundance per sample values, and (d) trnL using presence/absence values
When comparing the taxa identified in each sample, we found that abundant refers to highest relative read abundance per sample for
metabarcoding detected an average of 53.2% (range 27%–77%) of the metabarcoding and highest pollen grain abundance per sample by mi-
same plant families as microscopy in each honey and an average of croscopy (Table S3 and Figure S1). Microscopy was more consistent in
23.9% (range 9%–50%) of the same genera. We also compared only detecting the main floral source nominated by producers, with all the
the top five families detected by microscopy with the combined top nominated sources detected in the top five most abundant taxa of all
five families from each metabarcoding marker (resulting in six families 14 samples, compared to 12 with metabarcoding. Clustering analysis
for five of the samples where a family was detected by only one of the of microscopy data showed that trnL clustering produced very similar
markers) and found that metabarcoding detected an average of three clusters, except a cluster including all SWA samples, was recovered
out of five of the most abundant families as microscopy, where most only with the microscopy data (Figure S2).MILLA et al. | 8693
F I G U R E 4 Heatmaps of beta (a) ITS2
diversity and clustering analysis. (a) ITS2.
(b) trnL. Cells are colored by relative read
abundance, and row dendrogram tips are
color coded by IBRA bioregions. Plant taxa SJ03_SWA
(X-axis) are filtered to those present in SJ01_SWA
SJ08_MUL
abundances >1% for ITS2 and >5% for trnL
SJ10_BBS
SJ07_NET
SJ11_NAN
SJ06_MUL
SJ09_BBS
SJ02_SWA
SJ05_SWA
SJ15_SEQ
SJ13_SEQ
Asteraceae sp
Brassica sp
Brassicaceae sp
Macadamia sp
Populus deltoides
Jacksonia horrida
Pisum sp
Echium vulgare
Daviesia divaricata
Plantago lanceolata
Trifolium repens
Myrtaceae sp
Arctotheca sp
Eucalyptus sp
Glycine max
Brassica napus
Cucurbitaceae sp
Fabaceae sp
Trifolium sp
Corymbia sp
Swan Coastal Plain (SWA)
Nandewar (NAN)
New England Tablelands (NET)
Brigalow Belt South (BBS) (b) trnL
South East Queensland (SEQ)
SJ08_MUL
SJ06_MUL
SJ04_SWA
SJ09_BBS
SJ07_NET
SJ11_NAN
SJ03_SWA
SJ01_SWA
SJ02_SWA
SJ05_SWA
SJ10_BBS
SJ15_SEQ
SJ14_SEQ
SJ12_SEQ
SJ13_SEQ
Lauraceae sp
Brassicaceae sp
Asteraceae sp
Viburnum sp
Melaleuca nodosa
Vicia sp
Diplotaxis tenuifolia
Cannabaceae sp
Capsicum sp
Passiflora sp
Rosaceae sp
Verbenaceae sp
Oleaceae sp
Solanaceae sp
Proteaceae sp
Grevillea sp
Myrtaceae sp
Fabaceae sp
Casuarina sp
Trifolium sp
Macadamia integrifolia
Plantago lanceolata
Mallotus sp
Austrocallerya australis
4 | D I S CU S S I O N 4.1 | Using pollen metabarcoding to examine honey
composition
Our results show that pollen DNA metabarcoding can produce de-
tailed information regarding the floral sources of Australian honey, Previous pollen metabarcoding studies have shown that the combi-
including inferences about its regional provenance. It can also be nation of multiple markers provides more reliable than results than
used to gain insights into the floral resources available to honeybees individual markers (Richardson, Lin, Quijia, et al., 2015). The use of
in the surrounding area. However, due to the lack of complete plant two different metabarcoding markers allowed us to compare their
reference databases and poor taxonomic resolution of some taxa, relative performances when detecting plant taxa. Using both mark-
the interpretation of metabarcoding results requires careful vali- ers, we were able to detect between eight and 30 taxa per honey
dation. With these considerations in mind, we suggest that pollen sample. However, the plastid trnL marker performed significantly
DNA metabarcoding has great potential as a molecular authentica- better than ITS2 at detecting and identifying taxa. Its discriminating
tion method for Australian honey, and as a tool for hive monitoring power tends to be less than ITS2 (Richardson et al., 2019), a longer
programs to provide a thorough and continuous assessment of hon- marker with far more available sequences in public databases, and
eybee diet. Below we discuss some of the advantages and disadvan- more reference sequences in our custom database (26.9% of re-
tages of this approach. corded IBRA species in ITS2 database versus 15.2% in trnL database).8694 | MILLA et al.
A possible reason for this outcome is that the DNA in honey samples with microscopy-based analyses, a lack of segregating characters
was highly degraded due to their long storage period, and ampli- (i.e., sufficient nucleotide base differences) can limit the discriminat-
fication was more effective for the short target region of the trnL ing power of a metagenomics analysis. In this study, some common
P6 loop. The trnL marker has been shown to be suitable for highly families had particularly poor discrimination, including Fabaceae,
degraded DNA because of its short length and reliable amplifica- Asteraceae, and Myrtaceae. In particular, trnL had poor taxonomic
tion (Tab erlet et al., 2006). Other factors that may have influenced resolution for Myrtaceae, with several Eucalyptus, Angophora, and
the difference in results between ITS2 and trnL are amplification Corymbia species sharing more than 99% sequence identity. The
biases, which can be taxon or marker-specific (Deagle et al., 2014; combination of both markers helped resolve some of these issues.
Krehenwinkel et al., 2017; Moorhouse-Gann et al., 2018). Potential One of the advantages of DNA-based methods in the study
biases toward some plant families have previously been detected of bee diets is that traces of DNA could come from nectar plants,
in pollen metabarcoding (Hawkins et al., 2015). These factors again not just pollen, and these may be derived from different plant taxa.
highlight the need to use multiple markers for more comprehensive As shown by Prosser and Hebert (2017), the liquid constituent of
detection of taxa. honey contains a variety of plant sources that can be identified via
We obtained valuable information from the honey samples metabarcoding. While the protocol for processing honey for DNA
to be able to differentiate them by major source region (East vs. extraction requires filtering to concentrate pollen grains, it is likely
West). The clustering analysis with trnL was also able to separate that remnants of plant DNA from the liquid fraction remain in the
nearly all samples from the two major IBRA regions (Swan Coastal pellet, and they can be detected by subsequent amplifications.
Plain and South East Queensland), demonstrating the potential of However, quantification of pollen species content is not as reliable
metabarcoding for providing geographic traceability and reflect- with metabarcoding as it is with melissopalynology. Therefore, for
ing the composition of the surrounding floral community. Another applications relying on accurate quantification of pollen content, a
major advantage of DNA metabarcoding is that as more reference combination of a molecular profile and quantification via microscopy
sequences become available, it is possible to rerun an analysis might be more suitable.
using the same sequencing data to potentially identify more taxa.
It is also relatively straightforward to amplify more markers from
the same sample as long as sufficient DNA template is available. 4.3 | Foraging preferences of Australian honeybees
The laboratory protocol used here required only a few nanograms
of DNA per marker, leaving enough extraction volume for further The most common taxa found in the diet of honeybees in the
amplifications. present study were Myrtaceae species, detected in all but
one of the honeys. This was an expected result for nine of the
honeys, as producers had specifically nominated one or more
4.2 | Pollen metabarcoding comparison Myrtaceae taxa as the main foraging source, and it has been
with microscopy demonstrated that DNA metabarcoding can identify dominant
pollen species in honey (Utzeri et al., 2018). The presence of
Metabarcoding was able to detect many of the most abundant Eucalyptus species in the majority of samples may also reflect
taxa identified with microscopy, often in similarly high propor- their ubiquity and abundance in Australia. Eucalyptus spe-
tions. Previous studies have found a positive correlation between cies are commonly used foraging plants for honey production
the relative abundance of taxa identified in pollen samples by around the world (Bobis et al., 2020; Oddo et al., 2004). The
microscopy an metabarcoding, mostly for dominant taxa (Bänsch Eucalyptus species diversity in Australian honey is, however,
et al., 2020; Smart et al., 2017). The overlap in taxa identified by much higher than that of Eucalyptus honey produced elsewhere,
both methods was 21 families, representing 67.7% of the fami- as concluded by Sniderman et al. (2018). There are approxi-
lies detected by microscopy, and 12 genera, representing 44.4% mately 800 species of Eucalyptus in Australia, several of which
of genera detected by microscopy. When comparing individual are likely to be used by beekeepers. Additionally, the related
samples, the percentage overlap between microscopy and me- genera Corymbia and Angophora are often collectively referred
tabarcoding was 24% of genera on average. To an extent, these to as eucalypts by producers; therefore, correct identification
differences can be attributed to the different levels of resolution of floral sources requires suitable examination methods. As
obtained from each method. However, some of the dissimilarities with microscopy, metabarcoding also detected a high number
in taxa abundance between melissopalynology and metabarcod- of Myrtaceae types, but only two Eucalyptus could be identified
ing have been recognized before and were considered partly due to species level (E. leucoxylon and E. microcorys). Eucalyptus spe-
to the heterogeneous nature of honey and the sampling process cies have previously been shown to be difficult to differentiate
(Hawkins et al., 2015). even with the longer ITS2 marker (Prosser & Hebert, 2017). To
Metabarcoding had similar issues as those described in the mi- determine which individual species are contributing to honey-
croscopy study with differentiating among taxa of some species- bee diet, better markers for Eucalyptus discrimination and iden-
rich families in Australia, such as Myrtaceae and Proteaceae. As tification are needed to improve detection.MILLA et al. | 8695
Endemic Australian Proteaceae taxa such as Grevillea and AC K N OW L E D G M E N T S
Macadamia were significant components of some of the honeys ex- The authors thank Ben McKee, of Capilano Honey, for kindly mak-
amined. Macadamia was more prevalent in the eastern honeys (five ing unblended honey samples available for this study, and Vidushi
eastern samples with relative read abundances >1%). Macadamia is Patel for her assistance with the laboratory work. We would also like
cultivated commercially mostly in the eastern states of Australia, to thank Alexander Schmidt-Lebuhn, the editors, and two anony-
and its primary pollination vectors are honeybees and stingless mous reviewers for their helpful comments and recommendations
native bees (Heard & Exley, 1994). Grevillea is a widespread and on our draft manuscript. This project was funded by the CSIRO
species-rich genus in Australia, but is not commercially cultivated like Environomics Future Science Platform.
Macadamia, thus more likely to be found in indigenous vegetation,
while also commonly visited by honeybees (Taylor & Whelan, 1988). C O N FL I C T O F I N T E R E S T
The eastern localities were much closer to large urban centers and The authors declare no conflict of interest.
are therefore more likely to contain non-native species, while the
west coast of Australia is less densely populated, with the southwest AU T H O R C O N T R I B U T I O N S
region in particular hosting a large number of endemic taxa (Hopper Liz Milla: Conceptualization (equal); Data curation (lead); Formal analy-
& Gioia, 2004). The results also confirmed that honeybees regularly sis (equal); Software (lead); Writing-original draft (lead); Writing-review
forage on common weeds, as has been observed in other studies of & editing (equal). Kale Sniderman: Conceptualization (supporting);
intensely farmed areas (Requier et al., 2015), and may be contributing Formal analysis (supporting); Resources (equal); Writing-review & edit-
to the spread of some invasive species. Trifolium species are more ing (equal). Rose Lines: Data curation (equal); Resources (supporting);
common in the eastern states and were prominent components of Writing-review & editing (supporting). Mahsa Mousavi-Derazmahalleh:
the South East Q ueensland honeys and one honey from Brigalow Belt Data curation (supporting); Software (supporting); Writing-review
South (SJ9). One of the species detected by ITS2, T. repens, or white & editing (supporting). Francisco Encinas-Viso: Conceptualization
clover, is commonly cultivated in Australia for pasture and is polli- (equal); Formal analysis (equal); Writing-review & editing (equal).
nated by honeybees (Goodman & Williams, 1994; Lane et al., 2000).
While it is also found in Western Australia, its presence in eastern DATA AC C E S S I B I L I T Y S TAT E M E N T
honey samples may indicate the proximity of hives to grazing lands. Raw sequences and the final dataset are available on the CSIRO
One of the first challenges toward obtaining a more accu- Data Access Portal (https://data.csiro.au/collec tions/collec tion/
rate identification of the foraging preferences of honeybees, in CIcsiro:50306).
particular Australian honeybees, will be to increase the number
of available reference sequences for endemic taxa. While many ORCID
introduced species are present in global sequence databases, Liz Milla https://orcid.org/0000-0002-6139-4336
much of the Australian native flora remains poorly character- Francisco Encinas-Viso https://orcid.org/0000-0003-0426-2342
ized, apart from a few taxa (Dormontt et al., 2018). Availability
of comprehensive and well-c urated reference sequences can REFERENCES
highly improve the performance of metabarcoding analyses. Our Alaux, C., Ducloz, F., Crauser, D., & le Conte, Y. (2010). Diet effects on
recommendation, as previously proposed by others (Dormontt honeybee immunocompetence. Biology Letters, 6, 562–565.
Ankenbrand, M. J., Keller, A., Wolf, M., Schultz, J., & Forster, F. (2015).
et al., 2018), is that this need should be addressed with com-
ITS2 database V: Twice as much. Molecular Biology and Evolution, 32,
prehensive efforts to generate more sequences, preferably from 3030–3 032.
multiple plant markers, and making use of available resources Aronne, G., & Micco, V. D. (2010). Traditional melissopalynology inte-
such as herbarium specimens. grated by multivariate analysis and sampling methods to improve bo-
tanical and geographical characterisation of honeys. Plant Biosystems
–An International Journal Dealing with All Aspects of Plant Biology, 144,
833–8 40.
5 | CO N C LU S I O N S Baksay, S., Pornon, A., Burrus, M., Mariette, J., Andalo, C., & Escaravage,
N. (2020). Experimental quantification of pollen with DNA metabar-
coding using ITS1 and trnL. Scientific Reports, 10, 4202.
In this study, we have shown that pollen metabarcoding is a powerful
Bänsch, S., Tscharntke, T., Wünschiers, R., Netter, L., Brenig, B., Gabriel,
tool that can be used to characterize honey content, can potentially
D., & Westphal, C. (2020). Using ITS2 metabarcoding and microscopy
determine its provenance, and can inform us on the foraging prefer- to analyse shifts in pollen diets of honey bees and bumble bees along
ences of honeybees. Metabarcoding was able to identify significantly a mass-flowering crop gradient. Molecular Ecology, 29, 5003–5018.
more species than microscopy and could be used as a stand-alone tool https://doi.org/10.1111/mec.15675
Beekman, M., & Ratnieks, F. L. W. (2000). Long-range foraging by the
to provide a botanical profile of honey. Furthermore, the use of meta-
honey-bee, Apis mellifera L. Functional Ecology, 14, 490–496.
barcoding in monitoring the diets of honeybees could help determine Bell, K. L., Burgess, K. S., Okamoto, K. C., Aranda, R., & Brosi, B. J. (2016).
whether they have access to adequate floral resources, which is one Review and future prospects for DNA barcoding methods in forensic
of the recommendations for the management of hive health. palynology. Forensic Science International: Genetics, 21, 110–116.8696 | MILLA et al.
Bell, K. L., de Vere, N., Keller, A., Richardson, R. T., Gous, A., Burgess, K. Elliott, B., Wilson, R., Shapcott, A., Keller, A., Newis, R., Cannizzaro, C.,
S., & Brosi, B. J. (2016). Pollen DNA barcoding: Current applications Burwell, C., Smith, T., Leonhardt, S. D., Kämper, W., & Wallace, H. M.
and future prospects. Genome, 59, 629–6 40. (2021). Pollen diets and niche overlap of honey bees and native bees
Bobis, O., Moise, A. R., Ballesteros, I., Reyes, E. S., Durán, S. S., Sánchez- in protected areas. Basic and Applied Ecology, 50, 169–180.
Sánchez, J., Cruz-Q uintana, S., Giampieri, F., Battino, M., & Alvarez- Ellis, J. D., Evans, J. D., & Pettis, J. (2010). Colony losses, managed col-
Suarez, J. M. (2020). Eucalyptus honey: Quality parameters, chemical ony population decline, and Colony Collapse Disorder in the United
composition and health-promoting properties. Food Chemistry, 325, States. Journal of Apicultural Research, 49, 134–136.
126870. https://doi.org/10.1016/j.foodchem.2020.126870 EU Directive Council (2001). 110/EC of 20 December 2001 relating to
Boyer, F., Mercier, C., Bonin, A., le Bras, Y., Taberlet, P., & Coissac, E. honey. Official Journal of the European Communities, L10, 47–52.
(2016). obitools: A unix-inspired software package for DNA metabar- Ficetola, G. F., Pansu, J., Bonin, A., Coissac, E., Giguet-Covex, C., de
coding. Molecular Ecology Resources, 16, 176–182. Barba, M., Gielly, L., Lopes, C. M., Boyer, F., Pompanon, F., Rayé, G.,
Brodschneider, R., & Crailsheim, K. (2010). Nutrition and health in honey & Taberlet, P. (2015). Replication levels, false presences and the es-
bees. Apidologie, 41, 278–294. timation of the presence/absence from eDNA metabarcoding data.
Bruni, I., Galimberti, A., Caridi, L., Scaccabarozzi, D., de Mattia, F., Molecular Ecology Resources, 15, 543–556.
Casiraghi, M., & Labra, M. (2015). A DNA barcoding approach to Galimberti, A., de Mattia, F., Bruni, I., Scaccabarozzi, D., Sandionigi, A.,
identify plant species in multiflower honey. Food Chemistry, 170, Barbuto, M., Casiraghi, M., & Labra, M. (2014). A DNA barcoding ap-
308–315. proach to characterize pollen collected by honeybees. PLoS One, 9,
Calderone, N. W. (2012). Insect pollinated crops, insect pollinators and e109363.
US Agriculture: Trend analysis of aggregate data for the period Garbuzov, M., & Ratnieks, F. L. W. (2014). Listmania: The strengths and
1992–2009. PLoS One, 7, e37235. https://doi.org/10.1371/journ weaknesses of lists of garden plants to help pollinators. BioScience,
al.pone.0037235 64, 1019–1026. https://doi.org/10.1093/biosci/biu150
Collins, B. G., & Rebelo, T. (1987). Pollination biology of the Proteaceae Goodman, R., & Williams, A. (1994). Honeybee pollination of white clo-
in Australia and southern Africa. Australian Journal of Ecology, 12, ver (Trifolium repens L.) cv. Haifa. Australian Journal of Experimental
387–421. Agriculture, 34, 1121–1123.
Cornman, R. S., Otto, C. R., Iwanowicz, D., & Pettis, J. S. (2015). Goulson, D., Nicholls, E., Botías, C., & Rotheray, E. L. (2015). Bee declines
Taxonomic characterization of honey bee (Apis mellifera) pollen for- driven by combined stress from parasites, pesticides, and lack of
aging based on non-overlapping paired-end sequencing of nuclear flowers. Science, 347, 1255957.
ribosomal loci. PLoS One, 10, e0145365. https://doi.org/10.1371/ Guzmán-Novoa, E., Eccles, L., Calvete, Y., McGowan, J., Kelly, P. G., &
journal.pone.0145365 Correa-Benítez, A. (2010). Varroa destructor is the main culprit for
Couvillon, M. J., Riddell Pearce, F. C., Accleton, C., Fensome, K. A., Quah, the death and reduced populations of overwintered honey bee (Apis
S. K. L., Taylor, E. L., & Ratnieks, F. L. W. (2015). Honey bee foraging mellifera) colonies in Ontario, Canada. Apidologie, 41, 443–450.
distance depends on month and forage type. Apidologie, 46, 61–70. Hawkins, J., de Vere, N., Griffith, A., Ford, C. R., Allainguillaume, J.,
Dahle, B. (2015). The role of Varroa destructor for honey bee colony Hegarty, M. J., Baillie, L., & Adams-Groom, B. (2015). Using DNA
losses in Norway. Journal of Apicultural Research, 49, 124–125. metabarcoding to identify the floral composition of honey: A new
Dainat, B., Evans, J. D., Chen, Y. P., Gauthier, L., & Neumann, P. (2012). tool for investigating honey bee foraging preferences. PLoS One, 10,
Predictive markers of honey bee colony collapse. PLoS One, 7, e32151. e0134735. https://doi.org/10.1371/journal.pone.0134735
Dainat, B., Vanengelsdorp, D., & Neumann, P. (2012). Colony collapse Heard, T. A., & Exley, E. M. (1994). Diversity, abundance, and distribution
disorder in Europe. Environmental Microbiology Reports, 4, 123–125. of insect visitors to macadamia flowers. Environmental Entomology,
Danner, N., Keller, A., Härtel, S., & One, S.-D.-I. (2017). Honey bee forag- 23, 91–100.
ing ecology: Season but not landscape diversity shapes the amount Hollingsworth, P. M., Forrest, L. L., Spouge, J. L., Hajibabaei, M.,
and diversity of collected pollen. PLoS One, 12(8), e0183716. https:// Ratnasingham, S., van der Bank, M., Chase, M. W., Cowan, R. S.,
doi.org/10.1371/journal.pone.0183716 Erickson, D. L., Fazekas, A. J., Graham, S. W., James, K. E., Kim, K.-
de Vere, N., Jones, L. E., Gilmore, T., Moscrop, J., Lowe, A., Smith, D., J., Kress, W. J., Schneider, H., van Alphenstahl, J., Barrett, S. C. H.,
Hegarty, M. J., Creer, S., & Ford, C. R. (2017). Using DNA metabar- van den Berg, C., Bogarin, D., … Little, D. P. (2009). A DNA barcode
coding to investigate honey bee foraging reveals limited flower use for land plants. Proceedings of the National Academy of Sciences of the
despite high floral availability. Scientific Reports, 7(1), srep42838. United States of America, 106, 12794–12797.
https://doi.org/10.1038/srep42838 Hollingsworth, P. M., Graham, S. W., & Little, D. P. (2011). Choosing and
Deagle, B. E., Jarman, S. N., Coissac, E., Pompanon, F., & Taberlet, P. using a plant DNA barcode. PLoS One, 6, e19254.
(2014). DNA metabarcoding and the cytochrome c oxidase subunit I Hopper, S. D., & Gioia, P. (2004). The southwest Australian floristic re-
marker: Not a perfect match. Biology Letters, 10, 20140562. gion: Evolution and conservation of a global hot spot of biodiversity.
Donkersley, P., Rhodes, G., Pickup, R. W., Jones, K. C., & Wilson, K. (2014). Annual Review of Ecology Evolution and Systematics, 35, 623–650.
Honeybee nutrition is linked to landscape composition. Ecology and Johnson, R. M., Ellis, M. D., Mullin, C. A., & Frazier, M. (2010). Pesticides
Evolution, 4, 4195–4206. and honey bee toxicity–USA. Apidologie, 41, 312–331.
Dormontt, E. E., van Dijk, K.-J., Bell, K. L., Biffin, E., Breed, M. F., Byrne, Keller, A., Danner, N., Grimmer, G., Ankenbrand, M., von der Ohe, K.,
M., Caddy-Retalic, S., Encinas-V iso, F., Nevill, P. G., Shapcott, A., von der Ohe, W., Rost, S., Härtel, S., & Steffan-Dewenter, I. (2015).
Young, J. M., Waycott, M., & Lowe, A. J. (2018). Advancing DNA bar- Evaluating multiplexed next-generation sequencing as a method in
coding and metabarcoding applications for plants requires system- palynology for mixed pollen samples. Plant Biology, 17, 558–566.
atic analysis of herbarium collections—An Australian perspective. Khansari, E., Zarre, S., Alizadeh, K., Attar, F., Aghabeigi, F., & Salmaki, Y.
Frontiers in Ecology and Evolution, 6, 134 (2012). Pollen morphology of Campanula (Campanulaceae) and allied
Dubois, E., Reis, C., Schurr, F., Cougoule, N., & Ribière-C habert, M. genera in Iran with special focus on its systematic implication. Flora-
(2018). Effect of pollen traps on the relapse of chronic bee pa- Morphology, Distribution, Functional Ecology of Plants, 207, 203–211.
ralysis virus in honeybee (Apis mellifera) colonies. Apidologie, 49, Koziol, A., Stat, M., Simpson, T., Jarman, S., Dibattista, J. D., Harvey, E. S.,
235–242. Marnane, M., McDonald, J., & Bunce, M. (2019). Environmental DNA
Edgar, R. C. (2010). Search and clustering orders of magnitude faster than metabarcoding studies are critically affected by substrate selection.
BLAST. Bioinformatics, 26, 2460–2461. Molecular Ecology Resources, 19, 366–376.You can also read