Polaris Infrastructure - (TSE: PIF)

 
CONTINUE READING
Polaris Infrastructure - (TSE: PIF)
Polaris Infrastructure
(TSE: PIF)
 Natural Resources Group
 Analysts: Gabrielle Gregg, Owen Stimpson, Garrick Bracken,
 Nitin Reddy, Chloe Macklin, Edward Liu
 Researchers: Krishan Karia, Derek Liu, Sophia Lu, Damien
 Perera, Amay Shenoy, Nick Woollcombe, Judy Zhang
 January 20th, 2021
Polaris Infrastructure - (TSE: PIF)
Disclaimer

The analyses and conclusions of the Western Investment Club (“WIC") contained in this presentation are based on publicly available
information. WIC recognizes that there may be confidential information in the possession of the companies discussed in the presentation
that could lead these companies to disagree with WIC’s conclusions. This presentation and the information contained herein is not a
recommendation or solicitation to buy or sell any securities.

The analyses provided may include certain statements, estimates and projections prepared with respect to, among other things, the
historical and anticipated operating performance of the companies, access to capital markets and the values of assets and liabilities. Such
statements, estimates, and projections reflect various assumptions by WIC concerning anticipated results that are inherently subject to
significant economic, competitive, and other uncertainties and contingencies and have been included solely for illustrative purposes. No
representations, express or implied, are made as to the accuracy or completeness of such statements, estimates or projections or with
respect to any other materials herein. Actual results may vary materially from the estimates and projected results contained herein.

The sole responsibility for the content of this publication lies with the authors. Its contents do not reflect the opinion of the University
Students’ Council of the University of Western Ontario (“USC”). The USC assumes no responsibility or liability for any error, inaccuracy,
omission or comment contained in this publication or for any use that may be made of such information by the reader.
Polaris Infrastructure - (TSE: PIF)
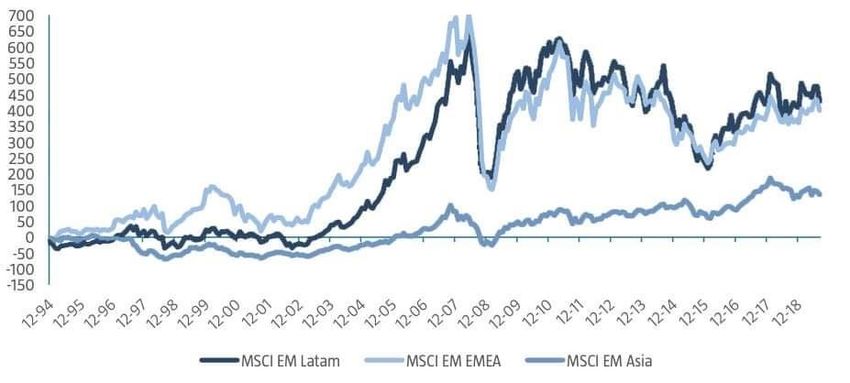
Table of Contents

I.     Introduction to Emerging Markets
II.    Business Overview
III.   External Analysis
IV.    Internal Analysis
V.     Thesis I
VI.    Thesis II
VII. Thesis III
VIII. Valuation
IX.    Catalysts
X.     Risks & Mitigations
XI.    Appendix
Polaris Infrastructure - (TSE: PIF)
I
Introduction to
Emerging Markets
Polaris Infrastructure - (TSE: PIF)
Emerging Markets Investing
 Introduction

                           What are Emerging Markets?                                                        Key Characteristics

   ▪       Global economies in nations actively pursuing
                                                                                                                                  Emerging   Developed
           development – share some characteristics with developed
           nations, though still not fully developed                                    High income & GDP per capita                            X
                                                                                        High political uncertainty                       X
             –       Eg: country with growing solar infrastructure
                                                                                        Highly developed capital markets                        X
                     (advanced technology) while per capita energy usage
                     is much lower than developed economies                             High market volatility                           X
                                                                                        High economic growth rates                       X
   ▪       Emerging markets are in various stages of development,
                                                                                        Highly established regulatory regimes                   X
           but tend to experience higher growth rates than developed
           countries

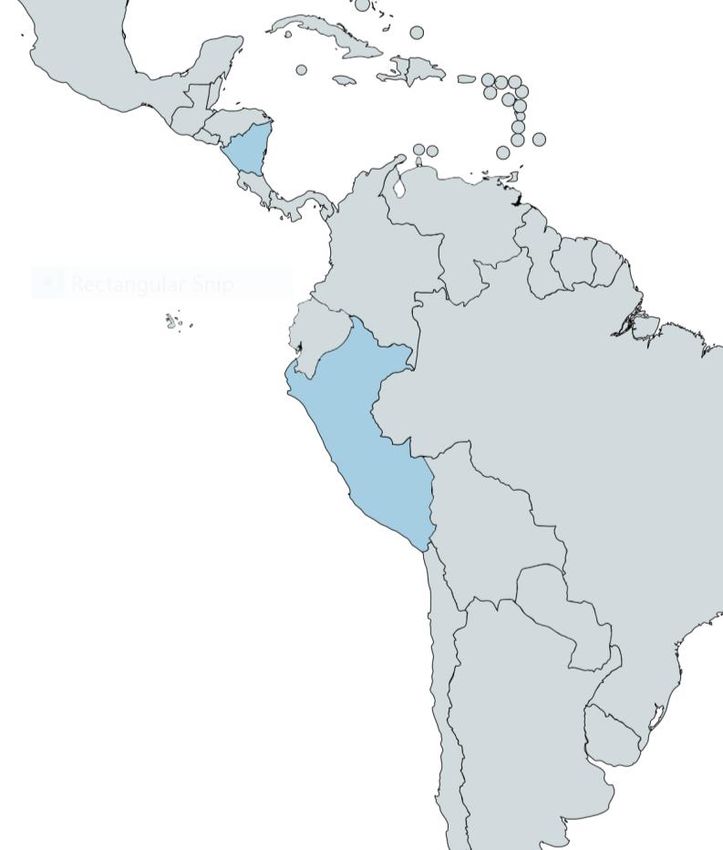
                Cumulative EM Performance by Region                                                     Map of Emerging Markets

750▪       Need to be recolored with WIC
600

450

300

150

   0

-150
       Dec-1994                                Dec-2006                      Dec-2018

                       MSCI EM LatAm           MSCI EM EMEA   MSCI EM Asia
                                                                                                                      Emerging Markets

 Sources: RBC, Global Finance Magazine, MSCI
Polaris Infrastructure - (TSE: PIF)
Emerging Markets Investing
Challenges & opportunities

                         Economic Growth                                                Geopolitical Risk

  ▪       GDP growth is generally higher in emerging markets due   ▪   Developing economies are often accompanied by
          to a key focus on economic development while                 developing political contexts
          developed nations focus more on economic stability       ▪   Political instability and civil unrest can have significant
  ▪       The World Bank estimates that 75% of global GDP              implications for companies operating in emerging markets
          growth from 2008 – 2018 has come from emerging           ▪   Foreign policy changes, trade wars, environmental
          markets in Asia, Latin America, and Africa                   issues, regime changes, and military tensions are key
                                                                       factors that more substantially affect emerging markets
                                                                       than developed countries

                           Demographics                                                        Volatility

  ▪       Changing demographics, while important in any economy    ▪   Stock price & market volatility is often higher than in
          for macroeconomic trend predictions, can have more           mature markets due to unpredictability of numerous
          substantial impacts in emerging markets                      factors in these economies

  ▪       Significant demographic change coupled with economic     ▪   Volatility is also driven by heightened perception of
                                                                       political instability and its impact on the economy
          growth can either compound or neutralize projected
          growth trends                                            ▪   Reduced government control over economy due to high
                                                                       dependence on foreign-determined factors such as:
                                                                        –    Trade relations
                                                                        –    Foreign Investment

Sources: RBC
Polaris Infrastructure - (TSE: PIF)
II
Business Overview
Polaris Infrastructure - (TSE: PIF)
Business Overview
Polaris Infrastructure operates renewable energy project in Latin America

                      Business Overview                                                      Key Financials
                                                                    Ticker                                                 TSE: PIF
 ▪   Polaris Infrastructure (TSE: PIF) is a developer, owner, and
     operator of renewable energy projects in Latin America         Share Price                                                $18.25

 ▪   Currently operates four projects in Nicaragua and Peru,        52 Week Low – High                                  $8.59 – $19.88
     both hydro and geothermal, with two additional projects        Enterprise Value                                        $468.7 M
     currently under construction in Nicaragua and Panama
                                                                    Market Capitalization                                   $291.3 M
 ▪   While smaller than most competitors operating in Latin         2021E EV / EBITDA                                               6.4x
     America, Polaris capitalizes on smaller market
                                                                    2021E Price / Earnings                                         19.5x
     opportunities, specifically $50M – $150M projects
                                                                    2021E Net Debt / EBITDA                                         2.3x
      Geographic Power Generation Breakdown                                        52-Week Stock Performance
                                                                      $24                                                      800,000

                                                                      $18                                                      600,000

                28%
                                                      Nicaragua       $12                                                      400,000

                                                      Peru
                             72%                                       $6                                                      200,000

                                                                       $0                                                      0
                                                                      16/Jan/20    16/Apr/20    16/Jul/20   16/Oct/20
Polaris Infrastructure - (TSE: PIF)
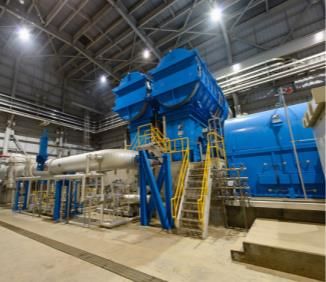
Business Overview: Assets
Polaris continues to expand assets with focus on geographical & asset-type diversification

                           Key Assets                                                    Asset Diversification
                                                                    ▪   Nicaraguan projects are geothermal assets, while those in
                           Nicaragua                                    Peru and Panama are Run of River Hydro projects
                                                                    ▪   In past 2-3 years, Polaris has shifted focus towards
      San Jacinto – 72MW             Binary Plant Addition – 10MW       diversification, expanding from a single asset in Nicaragua
                                                                           –    Asset type and geographical diversification
                                                                    ▪   Diversification expected to continue in coming years with
                              Peru                                      potential new projects and acquisitions
                                                                    ▪   All assets & potential future projects fall under renewables
 Canchayllo – 5MW      8 de Agosto – 20MW       El Carmen – 8MW         umbrella; project size ranges typically from $50M - $150M
                                                                                         Expansion Pipeline
                                                                        Geography           Generation Type                Size
                            Panama
                                                                    Nicaragua            Geothermal              5-10 MW
                                                                    Panama               Hydro                   10 MW
                           Chuspa – 10MW
                                                                    Peru                 Hydro                   20 MW
                                                                    Dominican            Solar                   32 + 20 MW

    Management sees opportunities to continue growth into           Panama               Hydro                   14 MW
 Panama, and extend further across Latin America with delays in     Panama               Solar                   10 MW
          construction stemming from COVID risks
                                                                    Peru                 Hydro                   80 MW
                                                                    Several              Diversified             >100 MW
Polaris Infrastructure - (TSE: PIF)
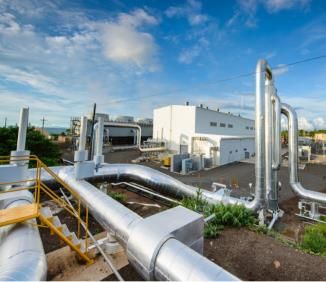
III
External Analysis
External Analysis
Renewable energy projects are becoming increasingly economical

                     Overview of Renewable Energy                                              Levelized Cost of Electricity by Technology

  ▪        Renewable Energy – energy derived from natural                              $0.20
           processes that are replenished at a rate that is equal to                                                Fossil Fuel Price Range
           or faster than the rate at which they are consumed                          $0.15

                                                                           (USD/kWh)
                                                                                                                                        $0.12
  ▪        While historically costly, renewable energy technology is                   $0.10       $0.07                     $0.07
           key to combatting climate change by producing electricity                                                                                $0.05
                                                                                                                  $0.05
           with reduced emissions and without air pollution                            $0.05
  ▪        Renewables have seen drastic cost reductions increasing
           their feasibility and popularity, making it a very                          $0.00
                                                                                                Geothermal        Hydro      Solar    Offshore    Onshore
           attractive source of energy                                                                                                 Wind        Wind

                                          Global Renewable Electricity Generation Breakdown

        8,000,000
                                          Biofuels & Waste         Hydro   Solar               Wind        Other sources
        7,000,000

        6,000,000

        5,000,000
(GWh)

        4,000,000

        3,000,000

        2,000,000

        1,000,000

               0
                         1990             1995              2000                   2005                    2010                2015              2018

Source: IEA, IRENA
External Analysis
                            Several key factors driving renewables growth in Latin America

                                                    Latin America Energy Targets                                                    Latin America Electricity Generation

                              ▪      A coalition of Latin American and Caribbean countries                                  1,500
                                     pledged a target of 70% renewable energy use by 2030                                   1,250
                                                                                                                            1,000
                                        –       ~33% is currently non-renewable                                                                                                        59%

                                                                                                                    (TWh)
                                                                                                                                                                                             67%
                                                                                                                             750                                            66%
                                        –       Overall grid growth is the main driver for                                                                       70%
                                                                                                                             500                     72%
                                                renewable energy generation growth                                                    75%
                                                                                                                                             75%
                                                                                                                             250
                              ▪      Small power stations are more likely to be constructed than                               0
                                     larger ones for rural areas to gain access to electricity                                        1990   1995    2000        2005       2010   2015      2018

                                                                                                                                               Fossil Fuels      Renewable

                                                                              Selected Renewable Energy Policies in Latin America

                            60
                                                     Import/Export Fiscal Benefits                       Auctions
Number of Countries Opted

                            50
                                                                                                                                                              Pre-investment Support
                                                                                                       Net Metering
                            40                                                                                                                                   Direct Funding
                                                            Tax Exemptions
                            30                                                                        Fuel Mandates
                                                                                                                                                                Currency Hedging
                            20                                                                                                                                    Eligible Funds
                            10                                  Others                                   Others
                                                                                                                                                                        Others
                              0
                                                          Fiscal Incentives                      Regulatory Instruments                                     Financial Mechanisms

                            Source: Reuters, IEA, IRENA
External Analysis
Polaris’ key target geographies are focused on increasing renewable energy usage

                                                    Nicaragua                                                     Peru

   ▪       42% of electricity supply is oil, with 58% renewable (mix of            ▪   Electricity mix is 54% renewable energy and 46%
           solar, biofuel, wind, geothermal, hydro)                                    conventional energy

              –        Venezuelan oil dependency is a key driver for renewable     ▪   Target mix is 60% renewable and 40% gas by 2025
                       electricity growth                                               –    Main driver: reduce imports of fossil fuel products
              –        Aims to generate 91% of electricity from renewables by      ▪   Project focus is small-scale renewable energy plants (such as
                       2027                                                            small hydro or solar) for rural communities to achieve
                                                                                       “nationwide electrification” by 2021)
   ▪       National energy consumption has increased over 200% since 1990
                                                                                        –    Historical 20-year generation growth of ~5.5% CAGR
              –        Main drivers: Both grid growth and conversion from fossil
                                                                                        –    Peru has an electrification rate of roughly 84%
                       fuels are drivers for renewable growth in Nicaragua
                                                       Panama                                                Dominican
   ▪       Panama National Energy Plan 2015-2050 suggests that 77% of              ▪   Current electricity generation mix is 14% renewable
           the country’s power supply could be renewable in the next
           35 years                                                                     –    Target mix is 25% electricity generated by renewable
                                                                                             energy sources by 2025
              –        ~33% is currently produced using fossil fuel
                       generation (coal, oil and natural gas)                      ▪   Signed the Paris Agreement within the UN
   ▪       Signed the Paris Agreement within the UN                                ▪   As with the other countries, regulatory and incentive policy has
                                                                                       been implemented to encourage this change
   ▪       Main driver: While some conversion is needed, overall grid
           growth will grow renewable energy generation                            ▪   Main drivers: Both grid growth and conversion from fossil
              –        Historical 20-year generation growth of ~3.8% CAGR              fuels are drivers for renewable growth in Dominican
                                                                                   ▪   Historical 20-year generation growth of ~2.6% CAGR

Source: Investor Presentation, Company Filings, Oxford business group
External Analysis
Nicaraguan Geopolitical Risk

                                             Political Context                             Nicaraguan GDP per Capita

   ▪       President Daniel Ortega has been in power since 2007, and       $2,500
           is the leader of the Sandinista National Liberation
                                                                           $2,000
           Front party
                                                                           $1,500
              –        SNLF party – party with Socialist beliefs
   ▪       Various pro-democracy, anti-socialism protests have taken       $1,000

           place since 2018 yielding conflict between civilians &           $500
           government
                                                                              $0
   ▪       Dictatorship also yields numerous potential risks related to
           checks & balances in government

                                         Key Considerations                         Latin America – Risk Factor Breakdown

   ▪       Dictatorship, while not favorable or optimal in any                                                 Corruption
           way, is not a prominent risk to foreign business operations                          7%
                                                                                                     13%       Excessive Bureaucracy
   ▪       Significant portion of geopolitical risk in Latin America
           comes from Political Instability                                          41%
                                                                                                               Violence
              –        Of this, a majority is derived from regime change                              15%
                       due to changes in law and goals of new party                                            Political Instability

   ▪       Opposition to Ortega’s leadership has largely been
                                                                                               24%             Macroeconomic &
           promotion of democracy which would be have positive                                                 Policy Turbulence
           implications for all stakeholders in Nicaragua

Source: Geoffrey Jones, Harvard University
IV
Internal Analysis
Internal Analysis
Polaris owns & operates four key projects across Latin America with upcoming potential expansions

                       San Jacinto PPA Contract Renewal                                     Project Overview

   ▪       Term of contract extended to January 2039 (from 2029)
              –        This increases Polaris’ weighted average contract
                       length for their projects to 18.1 years
              –        Indicates codependence with government and
                       stability of future cash flows
   ▪       Polaris can build a new binary unit in San Jacinto to
           increase capacity by up to 10MW
              –        Projected to generate $6M in cash flow and cost
                       $20M to get online by 2023; 3.3 year payback period
   ▪       Removal of price escalator and a lower price of US$110
           per MWh from US$130 per MWh
              –        Equates to US$12M reduction in annual cash flow        San Jacinto
                                                                              (72 MW)
   ▪       Income tax holiday extension from 2023 to 2025
   ▪       Series of changes provides opportunity to refinance                8 de Agosto
                                                                              (20 MW)
           existing project loan with more favourable terms
              –        Time frame matching of asset life, contract length,    El Carmen
                       and debt length can have significant implications on   (8 MW)
                       ability to pursue growth opportunities
                                                                              Canchayllo
   ▪       Management believes that new contract is net positive to           (5 MW)
           previous contract on NPV basis

Source: Investor Presentation, Annual Report
Internal Analysis
Polaris’ balance sheet has improved drastically since restructuring in 2015

      Restructuring & Current Balance Sheet Strength                                                       Credit Statistics

  ▪       In 2015 Polaris completed a capital structure                                                                Polaris         Peer Average
          restructuring by converting debentures into common
          shares and amending credit agreements with existing                    Interest Coverage                      3.5x                3.2x
          lenders
                                                                                     Net Debt /
            –   The financial distress was caused by high leverage                                                      2.0x                3.2x
                                                                                    EBITDA 2021E
                and poor cash management by the previous
                management team at the San Jacinto Power Plant                             Quick Ratio                  2.3x                0.8x

  ▪       The San Jacinto Power Plant was stabilized in 2016 and
          Polaris has used the stable cash flows from this asset
          to pay down existing debt obligations                                                            Debt Obligations
  ▪       Polaris boasts a strong balance sheet and ample liquidity                                          38         38
                                                                                           40    35
          to fund future developments throughout Latin America
                                                                                           35         31                          31

                                                                        Debt Obligations
  ▪       The amended PPA agreement for the San Jacinto facility                           30                                                27
                                                                                                                  24         24

                                                                          ($ Millions)
          should enable the company to refinance existing debt                             25                                          21          19
          obligations at a much lower cost                                                 20
                                                                                           15
            –   Refinancing the debt is expected to result in up to a                      10
                $15 million reduction in debt servicing costs,                              5
                increasing cash flows which can then be used to                             0
                                                                                                2021E       2022E      2023E      2024E      2025E
                fund growth opportunities
                                                                                     Current Debt Obligations          Refinancing Debt Obligations

Source: CapIQ
Internal Analysis
Polaris’ strategy and location provides a long runway for dividend growth and project expansion

            Operating Cash Flow Generation                                                Annual Dividend Per Share
                                                                                                              Peru Asset Development
 ▪   Polaris focuses on acquiring and developing assets that     $0.70
     generate less than 25MW in power                            $0.60
                                                                 $0.50
      –    There is limited competition for these projects as
                                                                 $0.40
           they are too small for most major utility companies
                                                                 $0.30                        $0.53             $0.60         $0.60        $0.60
           which drives down the prices Polaris pays
                                                                 $0.20
 ▪   Polaris also focuses on utility markets that are                           $0.31
                                                                 $0.10
     “undersupplied” allowing the company to negotiate PPA       $0.00
     pricing that is much higher than developed markets in                      2016          2017              2018          2019         2020
     Europe and North America
 ▪   These factors enable the company to achieve profitability                             Comparable Valuations
     despite being smaller than competitors                                                                                              Dividend as
                                                                                                Market           Enterprise    Dividend % of Operating
      –    Polaris spends a much smaller portion of operating                                Capitalization        Value        Yield     Cash Flow
           cash flow on dividends compared to peers, allowing    Algonquin Power                12,798            19,141        3.68%       50.0%
                                                                 Boralex                         5,451             8,434        1.22%       18.0%
           the company more flexibility with it’s operating      Innergex Renewable              5,250            10,034        2.40%       48.3%
           cash flow                                             Etrion Corporation               172               218          N/A         N/A
                                                                 Ormat Technologies              6,289              715         0.41%        8.0%
                                                                 Transalata Renewables           5,863             6,684        4.32%       75.0%

                                                                 Mean                            5,970             7,538         2.4%       39.9%
                                                                 Median                          5,657             7,559         2.4%       48.3%

                                                                 Polaris Infrastructure           291               469         4.3%        21.8%
V
Thesis I
Thesis I: Polaris Well-Positioned For Growth
Strong external environment in Latin America presents numerous opportunities

      Low Competition in High Growth Environment                                               Select Regional Electricity Demand Growth (%)

  ▪      Other major renewable project developers are much larger in size and            50%
         typically do not prioritize lower capacity assets (
Thesis I: Polaris Well-Positioned For Growth
Management is focused on growing company operations

                           Overview of Management View                        Management Expansion Targets (Geography)

   ▪       Management attitude towards growth is key
           consideration
   ▪       Primary research demonstrates management’s plan to
           expand operations beyond current geographies and asset
           type is core to their business
              –        MOU to be signed in Panama has been delayed due
                       to COVID-19 complications, but management is
                       confident hat it has not materially changed the
                       growth prospect
   ▪       Plan to continue acquisitions/new developments reduces             Current Nicaragua
           the expected generation share of the Nicaraguan                    Plants (70 MW)
           asset to less than 33% of the overall asset mix by                 Current Peru Plants
           approximately 2024, from 90%+ in 2019                              (33 MW)
              –        Management demonstrated clear intent to diversify,     New Panama Plants (34 MW)
                       addressing concerns of single asset risk               New Peru Plants (100 MW)
              –        Can result in multiple re-rating due to reduced risk   New Dominican Plant
                                                                              (52 MW)

Target Acquisitions vs Investible Cash Flow
Thesis I: Polaris Well-Positioned For Growth
Polaris’ growth plan indicates strong asset diversification, which will drive multiple re-rate

                                                           Growth Strategy (MW Capacity)
    300
    250
    200
    150
    100
     50                         93%          68%                  49%                    32%                 32%               24%
      0
                                2019        2020                  2021                  2022                 2023            2024/25
                                                          Nicaragua       Peru     Panama         Other

                                                                                                                 Capital
                                Geography     Generation Type              Size                   Stage         Required    Estimated IRR
               Nicaragua                    Geothermal                5-10 MW        Construction             $15 - $20 M            +20%
               Panama                       Hydro                     10 MW          Construction             $15 - $20 M              15%
               Peru                         Hydro                     20 MW          Operating                $15 M                8 – 10%
Progress

               Panama                       Solar                     10 MW          Greenfield               $10M                     12%
               Dominican                    Solar                     32 + 20 MW     Operating + Expansion    $15 - $20 M                   –
               Panama                       Hydro                     14 MW          Operating                $10 M                8 – 10%
               Peru                         Hydro                     80 MW          Greenfield               N/A                      15%
               Several Others               Diversified               >100 MW        Operating + Expansion    N/A                  10 - 12%

Source: Investor Presentation
Thesis I: Polaris Well-Positioned For Growth
Polaris’ strong balance sheet and stable cash flows suggest feasibility of extensive growth

       Strong Balance Sheet and Predictable Cash Flow                                           Debt-EBITDA vs Comps
                                                                               10.0x                                               9.4x
   ▪       Given the nature of the long-term energy PPAs, Polaris
           benefits from a stable revenue stream that depends very                               7.6x
                                                                                8.0x
           little on external factors                                                                              6.3x
                                                                                6.0x                        5.2x
   ▪       Predictable revenue leads to predictable cash flows,                                                           4.1x
           which Polaris has leveraged to maintain a strong cash                4.0x
                                                                                         2.3x
           position and consistent paydowns on debt                             2.0x
   ▪       Lower debt figures relative to competitors also enables              0.0x
           stronger growth capabilities                                                  PIF     BLX        ETX    AQN    ORA      INE

                                                    Polaris Cash Sources vs Uses for Growth-Projects

 180 M
                                                                                                                          Other
 150 M
                                                                                                                          Dominican
 120 M
                                                                                                                          Panama
   90 M                                                                                                                   Peru
   60 M                                                                                                                   Nicaragua 2021
   30 M                                                                                                                   5-year FCF
         M                                                                                                                Cash
                                              Polaris                                  Growth Initiatives

Target Acquisitions vs Investible Cash Flow
VI
Thesis II
Thesis II: Stability Amid Geopolitical Risk
Financial history indicates stability and limited political sensitivity

                                                    Cash Receipts vs. Debt Service
              $ 25 M

              $ 20 M

              $ 15 M

              $ 10 M

                $5M

                  $ M
                                Q1 2016   Q1 2017              Q1 2018                     Q1 2019   Q1 2020
                                                         Cash Receipts      Debt Service
                                                          Dividend History
                $0.16

                $0.12

                $0.08

                $0.04

                $0.00
                                Q1 2016   Q1 2017              Q1 2018                     Q1 2019   Q1 2020

                                                                Dividends Paid
Source: Investor Presentation
Thesis II: Stability Amid Geopolitical Risk
Financial history indicates stability and limited political sensitivity

                                                    Immaterial Impact of Political Turmoil
              $ 25 M

              $ 20 M

              $ 15 M

              $ 10 M

                $5M

                  $ M
                                Q1 2016   Q1 2017                  Q1 2018                     Q1 2019   Q1 2020
                                                             Cash Receipts      Debt Service
                                                              Dividend History
                $0.16

                $0.12

                $0.08

                $0.04

                $0.00
                                Q1 2016   Q1 2017                  Q1 2018                     Q1 2019   Q1 2020

                                                                    Dividends Paid
Source: Investor Presentation
Thesis II: Stability Amid Geopolitical Risk
Domestic use & necessity of energy hedge against geopolitical risk

                           Electricity as Essential Service                                                                        Domestic vs. Export

  ▪        Regardless of political context, energy is essential to                                ▪                  Traditional geopolitical conflicts arise more frequently in
           both the people and the government                                                                        the context of corporations exporting products to Western
  ▪        Impossible for government to have public support without                                                  nations
           reliable electricity for civilians                                                     ▪                  Reliance of local communities on Polaris electricity
  ▪        For the rest of an economy to operate, energy needs to be                                                 yields different relationship with company & government
           available                                                                                                 as compared to traditional foreign exporters
              –        Unreliability in energy sector does not help any                           ▪                  Companies exporting output are potential levers for
                       political party; even in times of political instability,                                      governments to pull in times of foreign political conflict
                       energy sector remains priority

                                  Crucial for Development                                                             Correlated GDP and Energy Use per Capita
                                                                                                                180
  ▪        Requirement of energy as basic input for most production

                                                                                  Energy Use per Capita (MWh)
           & consumption activities makes energy key to further                                                 150
           economic development                                                                                 120
  ▪        Energy use in Latin America per capita is roughly 10 – 20%                                            90
           of that in North America
                                                                                                                 60
              –        Consistent growth of energy consumption per
                       capita in recent years across Latin America                                               30

  ▪        As countries across Latin America continue to develop,                                                -
                                                                                                                      -            20              40            60        80
           energy demand continues to grow with renewables being
                                                                                                                                        GDP per Capita ($Thousands)
           the key area of energy growth
                                                                                                                                  _ Nicaragua           Peru      Panama

Sources: Investor Presentation, Our World in Data (Oxford)
Thesis II: Stability Amid Geopolitical Risk
Notable differences between Polaris and traditional Natural Resource foreign companies
                                                             Comparison of Common Foreign-Held Companies to Polaris

                                                                                      Mining & Oil                                   Polaris

                                                                                 Low – output is exported & not        High – domestic reliance on Polaris
          Importance to Locals                                                         used domestically               for electricity, necessity for daily life

                                                                               High – fluctuations in prices greatly    Low – minimal price variation &
        Profitability Variability                                              affect profit; expropriation becomes     highly contracted revenue reduce
                                                                                  more attractive & tensions rise                   variability

                                                                                 American Dollars – extremely           Local – makes business no more
                             Currency                                           valuable to government increasing      attractive to expropriation than any
                                                                                  attractiveness of expropriation              other local company

Sources: The Economist, Mabel Azcui,, Norton Rose Fulbright, Project Finance
Thesis II: Stability Amid Geopolitical Risk
Historical expropriation examples

                                                             ▪        Asian economic collapse of 1997 caused largely by Thai foreign debt and currency value concerns
                                                                      was self-fulfilling prophecy across Asia ⟶ this is worst case scenario in which entire continent
                                                                      sees economic collapse
           Indonesian                                        ▪        27 foreign-owned PPA contracts were in place, Indonesian government could not pay, shuts down
         Expropriation of                                             CalEnergy Assets; company sues winning $570M
        CalEnergy utilities,
              1998                                           ▪        20 other PPAs in Indonesia are renegotiated
                                                             ▪        Key implications: expropriation does not indicate loss of full investment; expropriation is also not
                                                                      only potential outcome (renegotiation is a mutually beneficial alternative)
                                                             ▪        While volatility is somewhat common, volatility ≠ risk; risk = permanent impairment of capital

                                                             ▪        Oil & Gas assets result in depletion of limited high-value resources; Venezuela’s key export
                                                                        –       Depletion of fixed-quantity key resource by foreign multinational companies leads to
                                                                                immense conflict between company & government
          Venezuelan                                         ▪        Government expropriates Conoco assets; company compensated with 45% of book value, and 2.5x
        Expropriation of                                              earnings
       Conoco Assets, 2007
                                                             ▪        Key differences & implications: second example showing how expropriations don’t result in
                                                                      complete loss of investment; Oil & Gas was exported while Polaris electricity is used & sold
                                                                      domestically; Polaris is a renewables company, meaning there is no depletion of country’s
                                                                      natural resource

                    Non-depletion resource and lack of political focus & action on expropriation further indicate reduced risk for Polaris

 Sources: The Economist, Mabel Azcui,, Norton Rose Fulbright, Project Finance
VII
Thesis III
Thesis III: Valuation Discount to Peers
Polaris trades at a 59% discount to peers when other Latin America companies trade at a 30% discount

                              Summary of Historical Multiples Compared to Peers
100x
 80x
 60x
 40x
 20x
   x
       Algonquin    Boralex     Innergex     Etrion         Ormat        Transalta       Mean       25% Discount       Polaris
         Power                 Renewable   Corporation   Technologies   Renewables                                 Infrastructure
                              EV/EBITDA LTM        EV/EBITDA 2021       P/E LTM       P/E 2021
          Global EV / EBITDA                                                  Valuation Gap

                                               ▪    Polaris currently trades at a 59% discount to peers and a 56% discount
                EV / EBITDA    Discount
                                                    to the average Canadian company vs other natural resource companies
Canada & US         14.6x         –
                                                    that trade at a discount of approximately 33% relative to peers
Latin America        9.7x       33.6%
Polaris             6.4x        56.0%                –    Current discount is due to investor concern regarding Nicaragua
                                               ▪    Polaris continues to diversify away from Nicaragua, the discount
                                                    relative to North American peers should narrow and this multiple
                                                    expansion should result in share price appreciation
Thesis III: Valuation Discount to Peers
Case study: Parex Resources trades at approximately 74% of peers

                       Implied Valuation                                            Implications
                        EV / EBITDA Production                ▪   Parex Resources, a TSE listed oil & gas producer
Company                 LTM 2021E     boe/d % Liquids
                                                                  in Colombia trades at ~74% of peers on an EV /
Enerplus Corporation     3.2x   3.7x  85,800   78%
                                                                  EBITDA basis
Paramount Resources      4.7x   5.4x  70,600   70%
Tamarack Valley          3.8x   4.6x  21,100   86%            ▪   Polaris currently trades at ~ 41% of peers on an EV /
Baytex Energy            4.4x   5.1x  72,100   92%                EBITDA basis, and will experience significant value
                                                                  appreciation if the gap between peers narrows
Mean                     4.0x   4.7x       62,400      82%
                                                                   –   Valuation gap to peers should narrow as Polaris
Median                   4.1x   4.9x       71,350      82%
                                                                       diversifies assets and risk from the San Jacinto
Parex Resources Inc.     4.0x   3.6x       46,400      100%            asset decreases
                                                              ▪   Polaris should trade at less of a discount to peers
% of EV / EBITDA                           LTM        2021E       than non-renewable resource companies as utilities are
Median                                     97.6%      73.9%       more insulated against nationalization danger
  EV / EBITDA 2021E                                           ▪   CEO explicitly stated that one of his goals for this
Peer Median PIF Implied          Implied                          year is to increase Polaris' multiple, reducing its
  Multiple   Multiple           Share Price         Upside        discount to peers
   15.6x       11.5x              $37.90            107.7%

        % Discount to EV / EBITDA 2021E Median
                   41%        46%     51%       56%
PIF Implied
                   0%        11.2%   27.1%     43.0%
Upside
Thesis III: Valuation Discount to Peers
Asset diversification and debt refinancing are expected to lead to multiple expansion

             Multiple Expansion                                                            Valuation Summary

 ▪   Polaris current EV / EBITDA valuation of                                                                                    15.6x
                                                                         18.0x                                                  $53.80
     6.4x is substantially lower than the peer
                                                                                                                                195%
     average of 15.6x                                                    16.0x
 ▪   There are many catalysts that will enable PIF                                                                    11.5x
     to achieve multiple expansion and share price                       14.0x                                       $37.90
     appreciation                                                                                                    107%
                                                                         12.0x                            8.4x

                                                     EV / EBITDA 2021E
      –    Refinancing debt obligations is                                                               $25.88
                                                                                             7.4x
           expected to increase cash flow by ~                           10.0x              $22.00        42%
           $15 million annually                                                   6.4x
                                                                                 $18.25      18%
      –    Diversification into less risky                                8.0x    0%
           jurisdiction such as Panama will lower
           risk associated with San Jacinto                               6.0x

 ▪   Asset diversification and additional cash
                                                                          4.0x
     flows from refinancing will be the key
     drivers of multiple expansion for Polaris
                                                                          2.0x

                                                                          0.0x
                                                                                  PIF     Refinancing    Panama       Parex   Peer Median
                                                                                                        Expansion   (Implied)
VIII
Valuation
Valuation: Comps
Polaris’ 59% discount to peers is unjustified given favorable leverage and dividend metrics
                                                                                       Net Debt /        Dividend as
                            Market      Enterprise   EV/ EBITDA            P/E          EBITDA Dividend % of Operating
                         Capitalization   Value      LTM   2021E      LTM     2021E      2021E    Yield   Cash Flow
Algonquin Power             12,798       19,141      22.0x  13.9x     19.9x    22.9x      3.3x    3.68%     50.0%
Boralex                      5,451        8,434      19.1x  16.9x      NM      75.5x      5.3x    1.22%     18.0%
Innergex Renewable           5,250       10,034      19.7x  19.6x      NM     188.8x      8.6x    2.40%     48.3%
Etrion Corporation            172          218       20.8x  13.0x      NM       NM        2.2x     N/A       N/A
Ormat Technologies           6,289         715       20.6x  17.9x     72.0x    69.6x      3.1x    0.41%      8.0%
Transalata Renewables        5,863        6,684      25.5x  14.3x     66.3x    31.6x      1.6x    4.32%     75.0%

Mean                         5,970        7,538      21.3x   15.9x    52.7x    77.7x      4.0x       2.4%         39.9%
Median                       5,657        7,559      20.7x   15.6x    66.3x    69.6x      3.2x       2.4%         48.3%

Polaris Infrastructure        291          469       6.0x    6.4x     11.2x    19.5x      2.3x       4.3%         21.8%

                       EV / EBITDA       Discount to CA/US                                  EV / EBITDA   Discount to Peers
Canada & US                14.6x                 –                   Parex Resources             3.6x          26.1%
Latin America               9.7x               33.6%                 Polaris Infrastructure      6.4x          58.9%
Polaris Infrastructure      6.4x               56.0%

         Polaris should trade at a discount to peers given Latin American exposure, however a 60% discount is
           unjustified given that other Latin American companies trade at a 33% discount on average
Valuation: Discounted Cash Flow
DCF valuation for Polaris indicates a 37.21% upside in the base case

Cash Flow Projection                  2021E     2022E     2023E    2024E       2025E     Cost of Equity
Net Income                            21,813    22,679    34,881   35,735      36,458    Risk Free Rate                      1.03%
Add: D&A                              25,924    26,424    26,424   26,424      26,424    Equity Risk Premium                 7.50%
Less: Cap Ex                          30,062    16,312     1,437    1,437       1,437    Levered Beta                          0.65
Less: Changes in WC                   (1,347)   (2,069)     775    (2,073)     (2,362)   Cost of Equity                      5.92%
Less: Mandatory Debt Repayments       20,592    14,813    15,759   13,349      12,272
Levered Free Cash Flow                (1,570)   20,047    43,334   49,446      51,536    COE                                 5.92%
PV Levered Free Cash Flow             (1,491)   17,160    33,441   34,400      32,323    South America Risk                  3.00%
                                                                                         Size Premium                        2.00%
                                                                                         Adjusted COE                       10.92%

                                    Sensitivity Analysis                                 Equity Value
                                        Adjusted Cost of Equity                          Final Year EBITDA                   36,458
                $0.37    8.92%    9.92%         10.92%        11.92%         12.92%      Exit Multiple                        12.0x
                10.0x   30.47%   25.69%         21.13%        16.79%         12.64%      Terminal Value                     437,502
Exit Multiple

                11.0x   39.19%   34.06%         29.17%        24.51%         20.06%       PV Terminal Value                 274,399
                12.0x   47.92%   42.44%          37.21%       32.23%         27.48%       Total PV of Projection Period     115,833
                13.0x   56.64%   50.81%         45.25%        39.95%         34.90%      Equity Value                       390,232
                14.0x   65.37%   59.19%         53.29%        47.67%         42.31%
                                                                                         Fully Diluted Shares Outstanding    19,000
                                                                                         Share Price $US                     $20.54
                                                                                         Share Price $C                      $26.08
                                                                                         Implied Upside                     37.21%
Valuation: Range

       52-Week Low52 -W
                   – High         $8.59                   $19.88

   Parex Implied Valuation                                             $36.90       $38.90

    EV / EBITDA 2021E                                                 $36.48                        $58.59

               P/E NTM                           $20.88                                                       $68.80

                     DCF                   $16.40                               $35.33

                                            Current: $19.01 Target: $26.09
                             $0           $10         $20           $30           $40        $50   $60       $70       $80
IX
Catalysts
Catalysts
A number of trends and events could drive value appreciation for Polaris

                                                                                                                           Short-Term
                              ▪   Polaris is expected to refinance existing debt with a more favorable debt package
   Debt Refinancing           ▪   Refinancing will decrease interest expense and annual amortization dramatically
                              ▪   The refinancing is expected to add ~$15 million to annual cash flow (~10 MW)

                              ▪   Panama acquisition would further diversify operations from Nicaraguan asset reliance

                                                                                                                           Mid-Term
                              ▪   Previous MOU to acquire Panama assets was extended until June 30, 2021 from
  Panama Expansion                December 31, 2020
                              ▪   Construction is expected to commence later in the year once Covid-19 cases in
                                  Panama fall

                              ▪   As Polaris continues to scale and increase power generation capacity, it may become an
                                  attractive takeover candidate for large utilities looking to expand into Latin America

                                                                                                                           Long-Term
   Acquisition Target             due to its profitability and valuation
                              ▪   Polaris has an existing relationship with Brookfield Renewable Partners
                              ▪   Atlantic Power recently acquired at a 48% premium to market price
Catalysts: Boralex Inc. Case Study
Polaris is in a similar position to Boralex when the company experienced significant multiple expansion

                                                                      Boralex EV / EBITDA 2012 - 2016

                       20.0x                                                                                                                                 20%
     EV / EBITDA NTM

                                                                                                                                                             15%

                                                                                                                                                                     % Thermal
                       16.0x
                                                                                                                                                             10%
                       12.0x
                                                                                                                                                             5%
                        8.0x                                                                                                                                 0%
                           Jan-12           Jul-12         Jan-13         Jul-13        Jan-14         Jul-14         Jan-15         Jul-15         Jan-16
                                                                         EV / EBITDA NTM                 % Thermal

                                                                               Multiple Expansion

 ▪                     Boralex used to trade below other renewable peers on an EV / EBITDA basis because investors were wary of their thermal assets
 ▪                     Boralex’s multiple increased substantially between 2013-2015 as their thermal assets became a smaller portion of the company’s power
                       generation capacity
 ▪                     Polaris’ Nicaragua asset currently makes up ~72% of power generation but this is expected to decrease to ~33% by 2025
                        –      Although Polaris is still expected to trade at a discount to peers, decreasing Nicaraguan exposure should result in multiple expansion
 ▪                     In 2013, Boralex had a market capitalization of ~$400 million and was also in the process of refinancing debt for more favorable terms
                        –      Polaris is similar in size to Boralex in 2013, is expecting similar catalysts in the near future and has a much longer track record
                               with dividend payments than Boralex had in 2013
X
Risks & Mitigations
Risks & Mitigations
Environmental regulation relaxation and leverage concerns could hamper growth
                                              Risk                                            Mitigation
                         ▪   San Jacinto being the main operating asset      ▪   Addition of 5-10 MW Binary unit along with
                             poses potential expropriation risk by               remaining aspects of new PPA contract
                             Nicaraguan government                               renewal positions Polaris well with
                                                                                 Nicaraguan government
    Single-Asset Risk    ▪   Reliance on the San Jacinto plant may also
                                                                             ▪   Geographic expansion across Peru,
                             increases Polaris’ risk profile with
                                                                                 Panama, and Dominican has, and will
                             potential unforeseen impacts to the plant           continue to, diversify assets
                             (eg. maintenance, natural disaster)
                                              Risk                                            Mitigation
                         ▪   Potential refinancing can reduce annual debt    ▪   Management strongly believes their
                             servicing costs by up to $15M annually,             strength in recent years of meeting credit
                             allocated towards funding further expansion         obligations will translate to an attractive
       Inability to                                                              refinancing structure
       Refinance         ▪   The inability to refinance existing debt at
                                                                             ▪   CEO has extensive experience in finance
                             attractive rates could limit potential future
                                                                                 and led the company through the 2015
                             growth                                              refinancing

                                              Risk                                            Mitigation
                         ▪   Political instability and autocracy result in   ▪   Necessity of electricity regardless of
                             potential conflict for Polaris across Latin         political context indicated margin of safety
                             America                                         ▪   Utilization of non-depletion resource is
    Geopolitical Risks   ▪   Expropriation, changing policies and                key expropriation mitigation
                             regulations, political uprising, and regime     ▪   Domestic use of Polaris-generated
                             change are notable potential risks associated       electricity indicates codependence
                             with Latin American operations                  ▪   Direct investment in local communities
Recommendation

                 Buy Polaris (TSE: PIF) at $19.01
                      Implied Upside: 37.21%
XI
Appendix
Appendix: Bull Case
DCF valuation for Polaris indicates an 85.86% upside in the bull case

Cash Flow Projection                    2021E    2022E     2023E    2024E       2025E     Cost of Equity
Net Income                              27,217   25,939    38,349   42,358      43,081    Risk Free Rate                      1.03%
Add: D&A                                25,924   26,674    26,924   26,924      26,924    Equity Risk Premium                 7.50%
Less: Cap Ex                            30,062   23,812     8,937    1,437       1,437    Levered Beta                          0.65
Less: Changes in WC                      (509)   (2,210)     733    (1,033)     (3,025)   Cost of Equity                      5.92%
Less: Mandatory Debt Repayments         20,592   14,813    15,759   13,349      12,272
Levered Free Cash Flow                   2,997   16,198    39,843   55,529      59,322    COE                                 5.92%
PV Levered Free Cash Flow                2,845   13,866    30,747   38,632      37,206    South America Risk                  3.00%
                                                                                          Size Premium                        2.00%
                                                                                          Adjusted COE                       10.92%

                                     Sensitivity Analysis                                 Equity Value
                                         Adjusted Cost of Equity                          Final Year EBITDA                   43,081
                $0.86    8.92%     9.92%         10.92%        11.92%         12.92%      Exit Multiple                        15.0x
                13.0x   80.06%    73.30%         66.86%        60.73%         54.88%      Terminal Value                     646,222
Exit Multiple

                14.0x   90.37%    83.20%         76.36%        69.85%         63.64%       PV Terminal Value                 405,306
                15.0x   100.68%   93.09%         85.86%        78.98%         72.41%       Total PV of Projection Period     123,296
                16.0x   110.99%   102.99%        95.37%        88.10%         81.18%      Equity Value                       528,602
                17.0x   121.30%   112.88%        104.87%       97.23%         89.94%
                                                                                          Fully Diluted Shares Outstanding    19,000
                                                                                          Share Price $US                     $27.82
                                                                                          Share Price $C                      $35.33
                                                                                          Implied Upside                     85.86%
Appendix: Bear Case
DCF valuation for Polaris indicates a 10.15% downside in the bear case

Cash Flow Projection                    2021E     2022E     2023E     2024E       2025E     Cost of Equity
Net Income                              13,642    14,462    22,468    23,322      24,046    Risk Free Rate                      1.03%
Add: D&A                                25,924    26,424    26,424    26,424      26,424    Equity Risk Premium                 7.50%
Less: Cap Ex                            30,062    16,312     1,437     1,437       1,437    Levered Beta                          0.65
Less: Changes in WC                     (3,291)   (1,762)     (215)   (1,352)     (1,581)   Cost of Equity                      5.92%
Less: Mandatory Debt Repayments         20,592    14,813    15,759    13,349      12,272
Levered Free Cash Flow                  (7,796)   11,523    31,912    36,313      38,342    COE                                 5.92%
PV Levered Free Cash Flow               (7,403)    9,863    24,626    25,263      24,048    South America Risk                  3.00%
                                                                                            Size Premium                        2.00%
                                                                                            Adjusted COE                       10.92%

                                     Sensitivity Analysis                                   Equity Value
                                         Adjusted Cost of Equity                            Final Year EBITDA                   24,046
                ###      8.92%     9.92%         10.92%        11.92%           12.92%      Exit Multiple                        11.2x
                 9.2x   -18.41%   -21.45%        -24.35%       -27.12%          -29.76%     Terminal Value                     269,312
Exit Multiple

                10.2x   -12.65%   -15.93%        -19.05%       -22.03%          -24.87%      PV Terminal Value                 168,911
                11.2x    -6.90%   -10.40%        -13.75%       -16.93%          -19.97%      Total PV of Projection Period      76,398
                12.2x    -1.14%    -4.88%         -8.44%       -11.84%          -15.08%     Equity Value                       245,309
                13.2x    4.61%     0.64%          -3.14%        -6.75%          -10.19%
                                                                                            Fully Diluted Shares Outstanding     19,000
                                                                                            Share Price $US                      $12.91
                                                                                            Share Price $C                       $16.40
                                                                                            Implied Upside                     -13.75%
2020 Debt Refinancing
Strong credit fundamentals and a recent refinancing have reduced risk significantly

                            Details from Refinancing                                                     Historical Debt Highlights
  ▪       On June 5th 2020, Andean Power Generation, a wholly owned                 ▪        Using proceeds from the refinancing, PIF repaid the
          subsidiary of PIF, obtained debt financing of $27 M from                           Canchayllo credit facility
          Brookfield Asset Management in order to refinance the
          Canchayllo credit facility, an existing term loan                                   –    The company now no longer holds debt maturing
            –        The original loan, maturing in March 2025, carried an                         before 2024
                     interest rate ranging from 5.38% to 8.65%; The new loan
                     carries an 8.75% interest rate and matures in June 2028        ▪        PIF’s Debt/EBITDA is in line with peers and has
                                                                                             fluctuated between 3.0x and 4.0x since 2016
            –        The terms of the loan give Brookfield a 1st priority lien on
                     PIF’s Canchayllo project and a 2nd priority lien on the El     ▪        Low interest rates may improve funds from operations
                     Carmen and 8 de Agosto projects                                         (FFO) further by encouraging refinancing in the future

                       FFO/Debt Steadily Increasing                                  Asset Coverage Remains High Post-Restructuring
  30%                                                                               300%
  25%                                                                                             233%       241%       238%       238%        236%
                                                                                    250%
  20%
                                                                                    200%
  15%
                                                                                    150%
  10%
   5%                                                                               100%
   0%                                                                               50%
                     2016            2017            2018            2019
                                                                                        0%
                                   PIF        Industry Average                                    2016       2017       2018        2019       2020

Source: S&P Global
2015 Restructuring
Prior to 2015 the company was known as Ram Power until bankruptcy forced them to restructure as Polaris
Infrastructure
                                     Details from Restructuring                       Underlying Cause and Future Mitigation
   ▪        In Q2 of 2015, Ram Power filed for bankruptcy and
                                                                                ▪   The reason they were distressed is because initial drilling
            restructured as Polaris Infrastructure due to overwhelming
                                                                                    did not go well and they were unable to produce the
            debt
                                                                                    needed cash flow to service interest payments, but that
               –        They engaged in a private placement, raising $74M,          should not be a problem now that the Nicaragua asset is
                        and converted senior secured debentures into $53M           stable
                        of shares
                                                                                     –    The company has since grown significantly and has
               –        Adjusted terms on outstanding credit to pay down                  other cash producing assets
                        debt on better terms - Senior loans with rates of
                                                                                ▪   Polaris's debt coverage is now 23.3% of operating income
                        6.5% were reduced to 1.5% and maturity dates have
                                                                                    which poses a significantly lower liquidity risk
                        been extended

       Interest Expense/EBIT Through Restructuring                                               Debt Maturity Schedule

  600%                                                                                                             5 Years
  200%                                                                                      48%

  100%

       0%
                   2013              2014   2015   2016   2017    2018   2019                                                3-5 Years
                                                                                                                                28%

Source: Polaris Investor Relations
Ownership Structure
Insider ownership by CEO aligns incentives with shareholders

                       Shareholder Overview                                                 Ownership Summary
                                          % of Shares Market Value
                                          Outstanding (CAD mm)                       Institutions
                                                                                       18.4%
Insiders
Murnaghan, Marc (CEO & Director)                 2.4%          7.1   Individuals/Insiders
Lawless, James (Independent Director)               –          0.1          2.4%                     15.7 mm
Total Insiders                                   2.4%          7.2                                    Shares
Traditional Investment Managers                                                                     Outstanding
Dimensional Fund Advisors L.P.                   4.2%         12.3
AGF Management Limited (TSX:AGF.B)               2.4%          7.0                                                  Public and Other
PenderFund Capital Management Ltd.               1.7%          5.0                                                       79.2%
Jarislowsky, Fraser Limited                      1.4%          4.2
Erste Asset Management GmbH                      1.4%          4.0
CIBC Asset Management Inc.                       1.1%          3.1                              Commentary
1832 Asset Management L.P.                       0.9%          2.7
QS Investors LLC                                 0.7%          1.9
Other Traditional Investment Managers            3.6%         10.8   ▪   While insiders only own 2.4% of shares outstanding, the
Total Traditional Investment Managers           17.8%         52.0       lean organizational structure aligns management incentives
Hedge Fund Managers                                                      with common stockholders
Hillsdale Investment Management Inc.             0.4%          1.1   ▪   Sizeable investments from institutional owners instills
Goodwood Inc.                                    0.1%          0.3
                                                                         confidence that PIF is a strong business
Arrow Capital Management Inc.                    0.1%          0.3
Total Hedge Fund Managers                        0.6%          1.7   ▪   Diversified shareholder base ensures that large investors
Other Investors                                                          will not be able to engage in undesirable behavior at the
Starlight Investments Capital LP (REIT)          0.6%          1.7       expense of minority owners
Retail & Other Investors                        78.6%        228.9
Total Other Investors                           79.2%        230.6

Sources: CapitalIQ
Ownership Structure
PIF is similar in structure to other renewable energy companies on the TSX

                                                      Short Interest (% of Shares Outstanding)

  4.0%

  3.2%

  2.4%

  1.6%

  0.8%

  0.0%
      Jan-16                    Jul-16     Jan-17     Jul-17       Jan-18     Jul-18       Jan-19       Jul-19        Jan-20       Jul-20        Jan-21

                       Comparable Ownership Structure                                                      Commentary
  100.0%                                                                           ▪   Investors have lately been shorting PIF at increasing levels,
                                                                                       which is typically a bearish sign, though interest as % of
    80.0%
                                                               Insiders                shares outstanding remains low
    60.0%                                                      Corporations        ▪   The past two years did not see much insider trading activity
    40.0%                                                      Institutions        ▪   Other renewable companies on the TSX also have low
    20.0%                                                      Public                  insider ownership levels indicating immaterial concern

      0.0%
                     PIF         NPI     INE    BLX   TA

Sources: CapitalIQ, ShortData
Institutional Investors Dividend Payments
Largely Institutionally Held Small and Micro Cap P&U Stocks (>50% Institutional)

                                                                140   129    132               129
                                Consecutive Dividend Payments   120
                                                                                                                       104
                                                                100

                                                                80

                                                                60

                                                                40
                                                                                                              25
                                                                20                                                           15
                                                                                                                   0
                                                                 0

•   Sources: Finwiz, Yahoo Finance
•   *Atlantic Power Corporation has dividend history previous to 2015, however has not paid dividends since
Executive Team
Polaris Infrastructure is supported by an experience management team

                                    • 20 years of experience within senior investment banking roles where he ran the Power and
        Mark Muraghan                 Alternative Energy groups
                                    • Helped raise capital for companies in the solar, wind, hydro, geothermal, biomass, power
      Chief Executive Officer         electronics, battery technologies, and fuel cell sectors

                                    • 25 years of experience within equity investments, project finance, project development,
                                      and commercial contract negotiations, and company operations
           Jaime Guillen            • Experiences within energy, transportation, and natural resource industries
       Chairman of the Board        • Currently serves on the the investment and asset management committees of the various
                                      energy and infrastructure funds in Latin America managed by Polaris’ affiliates

             James V. Lawless       • 30 years of experience within the geology and geothermal industry
                                    • Holds previous experience with company’s San Jacinto power product through oversight
                 Director             of drilling activities

               Alexis Osorno        • Previously a Finance Manager at Puma Energy Nicaragua for a period of 3 years before
                                      joining Polaris Energy Nicaragua, S.A (PENSA)
              Regional Manager      • Supervises the businesses in both the Peruvian subsidiary, Polaris Energy Peru; as well as
                 (Nicaragua)          the operations of the Nicaraguan subsidiary, PENSA

Source: Capital IQ
Call with Polaris CEO Marc Murnaghan
Annotated Stock Chart
PIF’s stock has grown 405% over the past five years while proving resilient to the COVID-19 pandemic

  $25                                                                                                                                          2,500K

  $20                                                                                                                                          2,000K

                                                                                                                       5
  $15                                                                     2                                                                    1,500K
                                                                                              4
                                                                                    3
  $10                                                                                                                                          1,000K
                    1
    $5                                                                                                                                         500K

      0                                                                                                                                      0
      Jan-16                    Jul-16   Jan-17   Jul-17    Jan-18       Jul-18      Jan-19       Jul-19      Jan-20       Jul-20      Jan-21

     1          Board of directors declares the first quarterly dividend of $0.10 USD per common share outstanding

     2          Protests against reforms decreed by President Ortega that increased taxes and decreased benefits sparked a regional sell-off

     3          PIF completes acquisition of Union Energy Group, a developer of three run-of-river hydroelectricity projects located in Peru

     4          Private placement offering of $25,000,000 7% senior unsecured convertible debentures announced

     5          Global market correction from the COVID-19 pandemic as countries enter lockdown

Sources: CapitalIQ, Bloomberg
Current Project Overview
PIF currently operates a Geothermal Plant in Nicaragua and three Hydroelectric Run-of-River (ROR) Power Plants in Peru

                     San Jacinto-Tizate Geothermal Plant                                    Canchayllo Hydroelectric Power Plant

   ▪       Operating since 2013 in San Jacinto, Nicaragua.                          ▪   Operating since 2015 in Canchayllo, Peru.
   ▪       Second largest geothermal energy generator in Nicaragua.                 ▪   Installed capacity 5MW Run-of-River hydro facility.
   ▪       Current steam can result in power capacity of                            ▪   20-Year Power Purchase Agreement approved by
           approximately 68-72 MW.                                                      government – US $47.40 / Mwhr.
   ▪       Generation license signed in 2013, allowing for the                      ▪   Transmission line is connected to the existing transmission
           generation of 62MW net of the project for a period of 30                     line of Oroya Nueva-Chumpe.
           years.

                   8 de Agosto Hydroelectric Power Plant                                    El Carmen Hydroelectric Power Plant

   ▪       Operating since December 2019 in Aucantagua, Peru.                       ▪   Operating since November 2019 in Maravillas, Peru.
   ▪       Installed capacity 20MW Run-of-River hydro facility.                     ▪   Installed capacity 8MW Run-of-River hydro facility.
   ▪       20-Year Power Purchase Agreement - US $53.90 / Mwhr.                     ▪   20-Year Power Purchase Agreement – US $55.70 / Mwhr.
   ▪       Substation receives the interconnection lines from 8 de                  ▪   Substation receives the interconnection lines from El
           Agosto and the outgoing 138 kV transmission lines to the                     Carmen and the outgoing 138 kV transmission lines to the
           Tingo Maria substation.                                                      Tingo Maria substation.
   ▪       Connected to the national grid.                                          ▪   Connected to the national grid.

Sources: Polaris Infrastructure, Polaris Energy Nicaragua, Corporate Presentation
Growth Strategy Overview

                                                            Diversification Strategy (MW Capacity)

  300
  250
  200
  150
  100
   50
    0
                               2019                 2020                 2021                       2022                   2023           2024
                                                              Nicaragua         Peru      Panama           Other

               Geography                  Generation Type             Size                     Stage                 Capital Required   Estimated IRR

   Nicaragua                          Geothermal                 5-10 MW               Construction                $15 - $20 M                     +20%
   Panama                             Hydro                      10 MW                 Construction                $15 - $20 M                       15%
   Peru                               Hydro                      20 MW                 Operating                   $15 M                         8 – 10%
   Dominican                          Solar                      32 + 20 MW            Operating + Expansion       $15 - $20 M                          –
   Panama                             Hydro                      14 MW                 Operating                   $10 M                         8 – 10%
   Panama                             Solar                      10 MW                 Greenfield                  $10M                              12%
   Peru                               Hydro                      80 MW                 Greenfield                  NA                                15%
   Several                            Diversified                >100 MW               Operating + Expansion                                     10 - 12%

Source: Investor Pesentation
World Bank Commitment
Nicaragua’s dependence on World Bank financing further deters expropriation against Polaris

                                                         World Bank Commitments to Nicaragua

                   250
                                   195
                   200
    $US Millions

                                                            145
                   150

                   100

                    50                                                                                                                  20
                                                                                      0                         0
                     0
                                   2017                     2018                     2019                     2020                    2021E
                                                                    World Bank Mitigation

  ▪                World Bank funding to Nicaragua was cut off in 2018 in response to President Ortega’s actions against civilians in Nicaragua
  ▪                The World Bank has pledged $20 million to Nicaragua to help fight the Covid-19 pandemic
  ▪                Reliance on funding from the World Bank should deter President Ortega from any hostile actions such as expropriation that may
                   jeopardize the loan or any other future financial commitments

Source: World Bank
Energy Processes: Geothermal

                                                Geothermal Energy Process

     Injection Wells                Heat Extraction             Energy Conversion             Generator Conversion

                                 Hot high-pressure brine         Steam passes through a        Generator converts this
 Injection wells drilled into   solution travels up the well    turbine causing it to spin,    mechanical energy into
  earth at depths with hot        to the surface, where it         converting steam to        electrical energy, and now
   temperature, hot brine        heats a different solution     mechanical energy which        cooled brine is returned
   injected through wells          quickly creating high-      travels to a generator via a    below earth’s surface via
                                      pressure steam                       shaft                     injection wells

      Injection Wells                 Brine Solution              Heat Energy Spins                Mechanical to
          Drilled                     Extracts Heat                    Turbine                  Electrical Conversion
Energy Processes: Hydroelectric

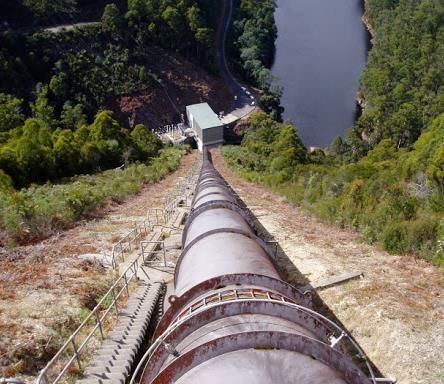
                                               Hydroelectric Energy Process

    Partial Diversion             Turbine Conversion               Transportation             Generator Conversion

                                 As water flows down the
     Partial stream from                                                                      Generator converts this
                                pipeline, it passes through a     Shaft connected to the
 naturally-occurring river is                                                                  mechanical energy into
                                 turbine causing it to spin,    spinning turbine sends this
  diverted from traditional                                                                   electrical energy, and the
                                  converting the flowing        mechanical energy up to a
  flow through man-made                                                  generator             water is returned to the
                                    water’s energy into
           pipeline                                                                               river downstream
                                    mechanical energy

      Partial Stream is                 Water Spins                   Transport to                 Water returned
         Diverted                        Turbine                       Generator                    downstream
Energy Processes: Solar

                                                   Solar Energy Process

     Direct Sunlight               Energy Capture                Initial Conversion             Secondary Conversion

                                Photovoltaic cells absorb                                       The electricity, currently in
                                                                 Loose electrons are then       direct current form, is then
  Solar panels constructed     sunlight, which consists of
                                                              captured by conductive metals
 with numerous silicon-alloy        photons that knock                                              converted to usable
                                                                  thus creating a flow of
            cells               electrons loose within the     electrons & electrical current   alternating current using an
                                 silicon-alloys of the cell                                               alternator

    Solar Panels Collect         Cells in Panels Retain          Energy Converted to               Conversion to Usable
          Sunlight                   Light Energy                 Electrical Current                     Energy
Peru – Political & Economic Context
Recent political instability has not hampered economic growth

                           Peruvian Political Crisis                                   Fewer Peruvians Facing Extreme Poverty

  ▪       Peru is currently in the midst of a period of political             20%
          instability primarily due to corruption
                                                                              15%
             –       The country saw six presidents over the course of
                     the last decade; a general election has been scheduled   10%
                     for April 2021
                                                                               5%
  ▪       Political turmoil has not hindered long-term economic
          prosperity significantly as evidenced by a rapidly-growing
                                                                               0%
          middle class                                                               2000    2002   2004   2006   2008   2010   2012   2014    2016    2018

                              Current Leadership                                              Gini Coefficient Steadily Falling

  ▪       Francisco Sagasti and Violeta Bermúdez were appointed               0.46
          President and Prime Minister of Peru respectively on
          November 17th, 2020                                                 0.45

  ▪       Although the two elected officials are ineligible for re-
                                                                              0.44
          election, Sagasti has intentions to “leave the next
          government with a clear idea…to replace fossil fuels with
                                                                              0.43
          different renewable forms of energy”
  ▪       Parliament is divided with no party receiving more than             0.42
          11% of the vote in 2020 parliamentary election                              2010   2011   2012   2013   2014   2015   2016   2017   2018    2019

Source: World Bank
Peru – Renewable Energy Policies
Numerous tax incentives have successfully attracted renewable energy investments in Peru

       Renewable Energy Generation Capacity (MW)                                              Accelerated Depreciation Regime
  7,000                                                                            ▪   Corporate income tax incentive designed to stimulate
  6,000                                                                                investment
  5,000                                                                            ▪   Under Legislative Decree No. 1058 passed in June 2008,
  4,000                                                                                equipment associated with the installation and operation of
                                                                                       renewable energy generation are subject to a 20% maximum
  3,000
                                                                                       annual rate of depreciation
  2,000
                                                                                   ▪   Renewable energy and mining are the only industries with this
  1,000                                                                                depreciation regime; all other fixed assets are limited to a
      0                                                                                maximum 10% rate of depreciation
            2010    2011   2012   2013   2014   2015   2016   2017   2018   2019

      Benefits Associated With Geothermal Resources                                           Early Recovery of the Input VAT

  ▪       The import of any goods used to exploit geothermal                       ▪   Value added tax (VAT) is a monthly tax levied on the sale
          resources are exempt from all existing taxes                                 or importation of goods as well as construction contracts
  ▪       As of 2019, all geothermal concession holders are subject                ▪   During the pre-operative stage, renewable energy
          to a 26% corporate income tax rate, compared to the                          companies are entitled to recover the VAT associated with
          standard 29.5% tax rate for other Peruvian businesses                        the import, acquisition or construction of assets
  ▪       Geothermal concession holders with multiple contracts are                ▪   These companies must also receive approval from the
          permitted to use losses–if one contract generates tax losses                 Ministry of Energy and Mines and commit to a minimum
          that carry forward–to offset taxes from another contract                     $5 M USD investment

Source: PwC, KPMG
Panama – Political & Economic Context
Panama remains a leader in free trade, a key driving force behind its economic prosperity

                                                   Overview                                                                         Leader In Free Trade

  ▪       Panama’s service-based economy is expected to contract in                             ▪                   The comparative advantage created by Panama’s
          2020, but is projected to rebound quickly                                                                 geographical location, the Panama Canal and numerous
             –        Estimates range from 4 – 5% GDP growth in 2021                                                free trade agreements have made the country a key player
                                                                                                                    in global trade
             –        Since 2001, Panama’s GDP has grown at a rate more
                      than double the regional average                                          ▪                   The Panamanian Balboa is pegged at 1:1 to the US Dollar,
  ▪       Panamanian companies have enjoyed tax-exempt status on                                                    providing long-term stability for the country’s economy
          foreign income since the mid 20th century; today Panama is                            ▪                   Trade liberalization has viewed favorably by Panamanian
          a notable tax haven                                                                                       leadership since 1994

             National Income (USD) Per Capita Growth                                                                Projected Electricity Consumption Per Capita
  16,000                                                                                                            2,600
  14,000                                                                                                            2,400

                                                                                                Consumption (kWh)
  12,000                                                                                                            2,200
  10,000                                                                                                            2,000
    8,000                                                                                                           1,800
    6,000                                                                                                           1,600
    4,000                                                                                                           1,400
    2,000                                                                                                           1,200
         0                                                                                                          1,000
                 2010     2011       2012      2013   2014   2015   2016   2017   2018   2019                               2015 2016 2017 2018 2019 2020 2021 2022 2023 2024 2025

Sources: International Monetary Fund, World Bank
Panama – Renewable Energy Policies
An optimistic national energy plan is supported by tax exemptions, reverse auctions and other policies

                          Panama’s National Energy Plan                                                                          Countless Tax Exemptions
                                 99.3%
  100%
                                                                     85.0%                                        ▪   Renewable energy projects generating up to 0.5 MW
    80%                                                                                                   70.0%       receive VAT and import tax exemptions
    60%                                                                                                           ▪   Projects generating up to 20 MW receive exemptions from
                                                                                                                      transmission and distribution taxes on their first 10 MW
    40%                                                                                           30.0%

    20%
                                                           15.0%                                                  ▪   Wind power generation equipment manufacturers are
                       0.7%                                                                                           exempt from paying all national taxes for 15 years
      0%
                            2010                                 2030                                2050         ▪   All biomass power generation companies receive full
                                            Renewable             Non-renewable                                       income tax exemption

                       Reverse Auctions For Solar Energy                                                                                Other Policies

  ▪        Under Panamanian law, distribution companies must have                                                 Ethanol Blending Mandates
           100% of their demand contracted for the next two years
                                                                                                                  ▪   The country adopted an E2 mandate in 2013 and steadily
           with additional lighter restrictions beyond the second year
                                                                                                                      increased its ethanol content, ultimately introducing an E10
  ▪        Solar energy supply is acquired by the government through                                                  mandate in 2016
           reverse auctions in which developers place bids to secure
           up to 20-year power purchase agreements (PPAs)                                                         Net Metering
  ▪        Law 37 of 2013 states that all solar power generation                                                  ▪   In June 2012, net metering for all renewable energy
           facilities are exempt from all import taxes on equipment                                                   systems was established under Resolution 5399
           used in the maintenance and installation of plants

Sources: International Energy Agency, International Energy Charter, Global Environment Facility
Select Geographic Electricity Generation and Demand
% Change

  45%

  40%

  35%

  30%

  25%

  20%

  15%

  10%

   5%

   0%
           1995            2000              2005             2010              2015               2018

           Panama Demand   Panama Capacity   Peru Demand   Peru Capacity   N.A Demand   N.A Capacity
Peru Supply and Demand

70

60                     57                                               59
                                                            56

           49
50

40

30

20

10

 0
                2018                                             2021
                            Peru Demand   Peru Generation
Charity Outreach: Polaris Infrastructure
PIF has completed two CSR projects in Telica, León, Nicaragua.

                                        San Jacinto-Tizate Community Water Rehabilitation Project

   ▪        Provided quality water to the community of Telica, León.
   ▪        US $1.2 million investment co-financed by Polaris Energy Nicaragua, S.A. (PENSA), the Inter-American Development Bank, the
            Development Bank of Austria, and NGO Catholic Relief Services.
   ▪        Gave priority to water supply, sanitation, hygiene, and community organization.
   ▪        Increased access to quality water for communities, ensured access to quality water and sanitation for local schools, and improved the
            sanitary conditions of the San Jacinto health post.
   ▪        Beneficiaries for 915 homes, 4,575 people, and 949 students.

                                               “Learning Today, Shining Tomorrow” Program

   ▪        Beneficiaries for over 800 students in Telica, León.
   ▪        Partnership with World Vision Nicaragua for educational support in pre-school, primary school, and secondary schools.
   ▪        Provided accompaniment from for students of the Sara María Parrales School Core and its five satellite schools (El Chorro, San Pío,
            El Listón, and Los Salgados)
   ▪        Equipped schools with technological tools for integral learning.

Sources: Polaris
You can also read