Poised to deliver sustainable returns in a "new" future - A unique, exciting global precious metals company - Sibanye ...

Page created by Don Becker
 
CONTINUE READING
Poised to deliver sustainable returns in a "new" future - A unique, exciting global precious metals company - Sibanye ...
Poised to deliver
sustainable returns in a
           “new” future

A unique, exciting global precious
                 metals company

                      17 November 2020
Poised to deliver sustainable returns in a "new" future - A unique, exciting global precious metals company - Sibanye ...
Disclaimer

The information in this announcement may contain forward-looking statements within the meaning of the “safe harbour” provisions of the United States Private Securities Litigation
Reform Act of 1995. These forward-looking statements, including, among others, those relating to Sibanye Stillwater Limited’s (“Sibanye-Stillwater” or the “Group”) financial
positions, business strategies, plans and objectives of management for future operations, are necessarily estimates reflecting the best judgment of the senior management and
directors of Sibanye-Stillwater.
All statements other than statements of historical facts included in this announcement may be forward-looking statements. Forward-looking statements also often use words such
as “will”, “forecast”, “potential”, “estimate”, “expect” and words of similar meaning. By their nature, forward-looking statements involve risk and uncertainty because they relate to
future events and circumstances and should be considered in light of various important factors, including those set forth in this disclaimer. Readers are cautioned not to place
undue reliance on such statements.
The important factors that could cause Sibanye-Stillwater’s actual results, performance or achievements to differ materially from those in the forward-looking statements include,
among others, our future business prospects; financial positions; debt position and our ability to reduce debt leverage; business, political and social conditions in the United States,
South Africa, Zimbabwe and elsewhere; plans and objectives of management for future operations; our ability to obtain the benefits of any streaming arrangements or pipeline
financing; our ability to service our bond instruments; changes in assumptions underlying Sibanye-Stillwater’s estimation of their current mineral reserves and resources; the ability to
achieve anticipated efficiencies and other cost savings in connection with past, ongoing and future acquisitions, as well as at existing operations; our ability to achieve steady
state production at the Blitz project; the success of Sibanye-Stillwater’s business strategy; exploration and development activities; the ability of Sibanye-Stillwater to comply with
requirements that they operate in a sustainable manner; changes in the market price of gold, PGMs and/or uranium; the occurrence of hazards associated with underground and
surface gold, PGMs and uranium mining; the occurrence of labour disruptions and industrial action; the availability, terms and deployment of capital or credit; changes in relevant
government regulations, particularly environmental, tax, health and safety regulations and new legislation affecting water, mining, mineral rights and business ownership, including
any interpretations thereof which may be subject to dispute; the outcome and consequence of any potential or pending litigation or regulatory proceedings or other
environmental, health and safety issues; power disruptions, constraints and cost increases; supply chain shortages and increases in the price of production inputs; fluctuations in
exchange rates, currency devaluations, inflation and other macro-economic monetary policies; the occurrence of temporary stoppages of mines for safety incidents and
unplanned maintenance; the ability to hire and retain senior management or sufficient technically skilled employees, as well as their ability to achieve sufficient representation of
historically disadvantaged South Africans in management positions; failure of information technology and communications systems; the adequacy of insurance coverage;
any social unrest, sickness or natural or man-made disaster at informal settlements in the vicinity of some of Sibanye-Stillwater’s operations; and the impact of HIV, tuberculosis
and the spread of other contagious diseases, such as coronavirus (“COVID-19”). Further details of potential risks and uncertainties affecting Sibanye-Stillwater are described in
Sibanye-Stillwater’s filings with the Johannesburg Stock Exchange and the United States Securities and Exchange Commission, including the Integrated Annual Report and the
Annual Report on Form 20-F.
These forward-looking statements speak only as of the date of the content. Sibanye-Stillwater expressly disclaims any obligation or undertaking to update or revise any forward-
looking statement (except to the extent legally required).

                                                                                                                                                                                       2
Poised to deliver sustainable returns in a "new" future - A unique, exciting global precious metals company - Sibanye ...
Who are we?
Poised to deliver sustainable returns in a "new" future - A unique, exciting global precious metals company - Sibanye ...
A unique, diversified, global, precious metals Group
Long life Reserves (70Moz), only 14% of                                 US PGM contribution to Adj. EBITDA to                                                        Americas assets
          Resources (493Moz)                                                 increase as Blitz ramps up

                                                                                                                                                                                                            Marathon project (49%)

                             22%                                                    21%               20%                    US PGM                                                                         with Generation mining

                                                                                                                             East Boulder mine(100%)                                                        Denison project (80%)
      38%                                                                              Adj EBITDA1
                Reserves                                                                                                     Reserves: 10.2Moz 2E                                                           with Wallbridge Mining
                   (%)                                                                   (Rm %)
                                                                                                                             Stillwater mine(100%)                                                          Altar project (100%)
                  2019                                                                  Q3 2020                              Reserves: 16.7Moz 2E                                                           with Aldebaran (in
                                                                                                                                                                                                            Argentina)
                                                                17%
                           40%                                                               59%
                                            33%
                                                    Production                                                               SA PGM                             Southern African assets                     SA GOLD
                                                      (oz %)                                                                 Mimosa (50%)                                                                   Cooke surface (100%)
                                                                                                 SA gold (oz%)
                                                     Q3 2020                                                                 Reserves: 1.7Moz 4E                                                            Reserves: 0.1Moz Au
Production of approximately                                                                      SA PGM (4E %)
950koz gold and 1,800koz 4E                                                                                                  Marikana (100%)4                                                               Kloof (100%)
     PGMs per annum                                             50%                              US PGM (2E %)               Reserves: 9.2Moz 4E                                                            Reserves: 4.5Moz Au

                                                                                                                             Platinum Mile (91.7%)                                                          Driefontein (100%)
                                                                                                                             Reserves: n.a.                                                                 Reserves: 2.6Moz Au
    Shares in issue1                      2,925,001,704
                                                                                                                             Rustenburg (100%):                                                             DRDGOLD (50.1%)
    Shares in ADR form2                   463,339,488 (ADR ratio 1:4 ordinary share)
                                                                                                                             Reserves: 16.1Moz 4E                                                           Reserves: 2.2Moz Au
    Market cap                            R156 billion (US$10 billion)
                                                                                                                             Kroondal (50%)                                                                 Beatrix (100%)
    Net debt: adjusted                    0.05x (proforma 30 Sep 2020)
                                                                                                                             Reserves: 1.2Moz 4E                                                            Reserves: 1.5Moz Au
    EBITDA
                                                                                                                             Various SA PGM projects                                                        Various SA gold projects
    Listings                              JSE Limited share ticker: SSW                                                                                                                                     Reserves: 4.5 Moz Au
                                                                                                                             Resources: 86.8Moz 4E
                                          NYSE ADR programme share ticker: SBSW                                                                                                                             Resources: 44.3Moz Au

   Geographically diversified, with unique precious metals mix and long life assets
   ¹ Shares in issue and market cap as at 9 Nov 2020 2 American depository receipts (ADRs) as at 12 October 2020 3 Definition as per debt covenants which includes 12 months pro-forma adjusted EBITDA of Marikana operations *The
   Group reports adjusted earnings before interest, taxes, depreciation and amortisation (EBITDA) based on the formula included in the facility agreements for compliance with the debt covenant formula. For a reconciliation please   4
   refer to the additional results disclosure available on https://www.sibanyestillwater.com/news-investors/
Poised to deliver sustainable returns in a "new" future - A unique, exciting global precious metals company - Sibanye ...
Prospering in South-Africa’s investment climate

 • Credible and respectful relationships with unions based on our
   right to manage the business in the interest of all stakeholders
 • Diversified asset base provides operating flexibility to ensure we
   can adopt a principled stance
 • Engaged and committed workforce supportive of management
   - winning the hearts and minds of employees
 • Leading industry role in protecting shareholder interests and
   advocating for more investor friendly policies
 • Industry interests supported by a fair and robust judiciary system
 • Intense focus on social factors through our ESG strategy to
   ensure more stable communities which benefit from our mining

Protecting shareholder interests through principled positioning and actions
                                                                              5
Poised to deliver sustainable returns in a "new" future - A unique, exciting global precious metals company - Sibanye ...
Our Ethos

                 OUR PURPOSE
            Our mining improves lives

                                                 SUPERIOR VALUE
                                                    CREATION
                                                   FOR ALL OUR
                                                  STAKEHOLDERS
                                             through the responsible
                                              mining of our mineral
                                                     resources

             Strengthen our position as a
            leading international precious
                    metals Group

                                                                       6
Poised to deliver sustainable returns in a "new" future - A unique, exciting global precious metals company - Sibanye ...
Our strategic intent and focus areas

Strengthen our position
as a leading international
precious metals mining
Group by:

Continues focus on delivery of key strategic goals
                                                     7
Poised to deliver sustainable returns in a "new" future - A unique, exciting global precious metals company - Sibanye ...
Exposure to the right commodities at the right time
                                                                              Group
                                        3 year               Group        Revenue
                                  performance            Produced       contribution
     Commodity                             (%)       prill split 2(%)           2(%)

1    Rhodium                             1 041.5                  4             26
2    Ruthenium                             315.4                  6             0.4
3    Palladium                             138.3                 26             33
4    Iridium                                69.6                  2             0.8
5    Silver                                 63.1
6    Gold                                   55.9                 32              27
7    Iron Ore CFR                           50.6
 8   Nickel                                 33.0
 9   Copper                                 (0.6)
10   Platinum                               (1.7)                31              13
11   NYM Rot fuel oil                        (3.6)
12   NYM Sin fuel oil                        (8.2)
13   Coking coal                             (8.6)
14   NYM HH NAT Gas                        (10.2)
15   Tin                                   (14.4)
16   NYM WTI Crude                         (14.6)
17   Aluminium                             (14.8)
18   ICE Brent crude                       (15.9)
19   Lead                                  (16.5)
20   NYM NYH Gasoline                      (19.2)

Sound fundamentals for the metals we produce with platinum market well placed for future upside
Source: JP Morgan; Bloomberg, period 1 January 2015 to 18 August 2020
Note: 1. Based on Johnson Matthey Spot Index
      2. Representing Group data for Q3 2020. PGM prill splits including SA gold with production ounces, while revenue contribution is based on sold ounces   8
Poised to deliver sustainable returns in a "new" future - A unique, exciting global precious metals company - Sibanye ...
E SG – our products are essential to future combatting of climate change

 Auto                                              Renewable energy generation                      Alternative power generation
 catalysts                                         and conservation                                 and storage

 •   Platinum (Pt), palladium (Pd) and             •   Ruthenium(Ru) an essential component         •     Pt’s unique catalytic properties make it
     rhodium (Rh) - unique catalytic                   of wind turbine blades and high-quality            an essential component of the hydrogen
     properties transform noxious exhaust              glass for photo voltaic (solar) panels             economy.
     gasses - hydrocarbons (HC), nitrogen                                                           •     An environmentally friendly source of
     oxide (NOx) and carbon monoxide (CO)                                                                 energy - Pt’s conductivity makes it ideal
     - into more benign components (water          •   Rh utilised in energy efficient fiberglass
                                                       which is widely used as an insulating              for the electrolysis of hydrogen from
     (H2O), carbon dioxide (CO2) and                                                                      water
     nitrogen gas (N2))                                material to reduce heat loss
                                                                                                        • Hydrogen fuel cells – an efficient and
 •   One of the world's largest recyclers of                                                              environmentally friendly alternative for
     auto catalysts – re-use of critical metals.                                                          generating electricity
 •   Treating more recycled ounces than
     mined ounces in the US operations

Making a difference – one PGM ounce at a time
                                                                                                                                                      9
Poised to deliver sustainable returns in a "new" future - A unique, exciting global precious metals company - Sibanye ...
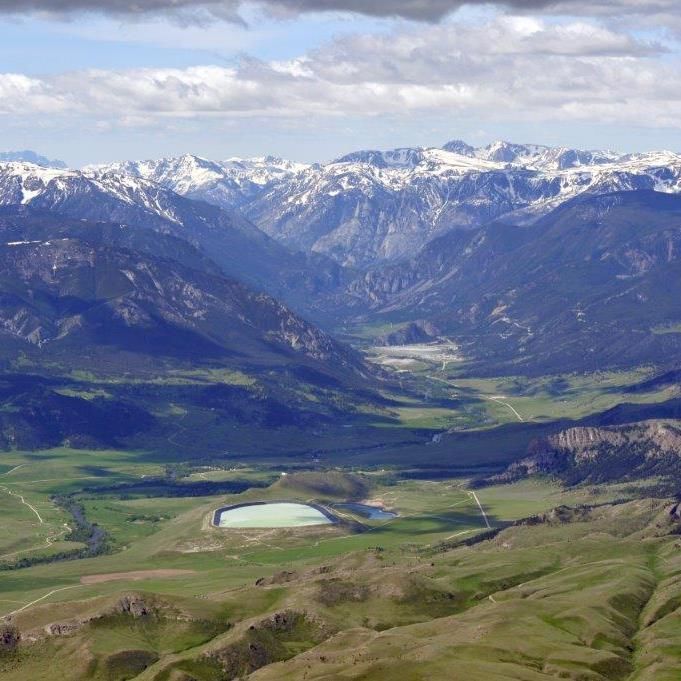
Sibanye-Stillwater delivering superior value relative to peers….

                               300            Sibanye-Stillwater                 Sibanye-Stillwater ADR            Barrick

                                              Newcrest                           Newmont                           Kinross

                                              AgnicoEagle                        AngloGold                         Gold Fields
                               250
                                              Harmony                            Implats                           AngloPlats

                                              Norilsk Nickel                     FTSE / JSE ALSI                   Gold Miners GDX
Share price (rebased to 100)

                               200            Gold Junior Miners GDXJ
                                                                                                                                                                                    +83.1%
                                                                                                                                                                                    +76.3% (ADR)

                               150

                               100

                                50

                                  0
                               November/19   December/19       January/20   February/20        April/20   May/20                 June/20   July/20   August/20   October/20   November/20

Other than Gold Fields, Sibanye-Stillwater has outperformed key peers and indices over the past twelve months
Source: Factset as at 12 November 2020
All data in USD
                                                                                                                                                                                         10
Delivering sustainable
          total returns
Larger, diversified production base drives record earnings and cash flow

• Significant increase in earnings and cash                                                                      Profitability (adjusted EBITDA 1) and gearing
  flow                                                                                                                                                                      Q3
                                                                                                   1,200                                                                    2020             3
     - Driven by increase in production from                                                                                            2.6
                                                                                                                                              2.5

                                                                                                                                                                                                    Net debt: adjusted EBITDA ratio
                                                                                                   1,000                          2.4                 2.4
       acquisitions and higher precious metals                                                                             2.3
                                                                                                    800                                                                            21%
                                                                                                                                                                                   36%
       prices
                                                                                                                                                                                             2
                                                                                                    600
• Record adjusted EBITDA for Q3 of R15,592
                                                                                                                                                                                   59%
  million (US$922 million)                                                                          400                                                      1.3

                                                                                     US$ million
                                                                                                                                                                                   54%
     - more than 2019 full year adj. EBITDA                                                         200
                                                                                                           99%                                                                               1
                                                                                                                                                                                   20%
                                                                                                      0
• Accelerated deleveraging – ND:adjusted
  EBITDA below pre-acquisition levels                                                              (200)           0.6                                              0.55
                                                                                                                                                                                   10%
                                                                                                           0.4                                                              0.33
                                                                                                   (400)                                                                              0.05 0
• 84% of earnings from operations acquired
                                                                                                           H1      H2      H1     H2    H1    H2*    H1*     H2      H1      Q3          Proforma
  through successful acquisition strategy                                                                                                                                                Q3#
                                                                                                              2016           2017         2018          2019        2020

                                                                                                    SA gold              SA PGM         US PGM              Net debt: adjusted EBITDA (rhs)

From single commodity to multicommodity with 84% of current earnings being generated from acquired operations
Source: Company results information
1. The Group reports adjusted earnings before interest, taxes, depreciation and amortisation (EBITDA) based on the formula included in the facility agreements for compliance with the debt covenant
    formula. For a reconciliation of profit/loss before royalties and tax to adjusted EBITDA, see note 8.1 of the condensed consolidated interim financial statements in the H1 2020 results booklet
• H2 2018 and H1 2019 at the SA gold operations have been impacted by the five month gold strike from Nov 2018 to April 2019 with subsequent gradual build up to new normalised levels
• # Proforma using Q3 2020 adjusted for the conversion of the Convertible bond which converted in October 2020 (refer https://www.sibanyestillwater.com/news-investors/news/news-releases/2020/)                                      12
Sustainable dividends from larger diversified production base

                                           Normalised earnings/(loss) and dividend payments2                                                                         • Over R1.3bn (US$76m) interim dividend paid for 2020
                                                                                                                                                                        - Conservative 15% of normalised earnings paid due to COVID-
                                    600                                                                                               90                                  19 uncertainty (dividend policy 25%-35%)
                                                                                                                               80
                                    500                                                                                               80                                - interim dividend more than full dividends between 2013-2015
                                                                                                                                      70                             • Full year dividend will be reviewed in line with dividend policy
                                    400
Normalised earnings (loss) US$ m

                                                                                                                                           Dividend payment (US$m)
                                                                                     56                                               60                             • Also paid ~R135m (US$8m) to participants of the Marikana and
                                    300                52                      54
                                                                   48                                                                                                  Rustenburg employee share option schemes
                                                                                                                                      50
                                    200                      41                            42
                                                                                                                                      40
                                    100
                                                 27                                                                                   30
                                      0
                                                                                                                                      20
                                   (100)                                 7                                                            10

                                   (200)                                                                                              0
                                                 Dec

                                                             Dec

                                                                         Dec

                                                                                     Dec

                                                                                                 Dec

                                                                                                             Dec

                                                                                                                         Dec
                                                                                                                               Jun*
                                           Jun

                                                       Jun

                                                                   Jun

                                                                               Jun

                                                                                           Jun

                                                                                                       Jun

                                                                                                                   Jun

                                            2013       2014        2015        2016        2017        2018        2019 2020
                                                 Dividend paid (rhs)                        Normalised Earnings (lhs)

Consensus free cash flow forecast of US$2.37bn or R37.0bn for 20213 supports further increase in dividends
*                       June 2020 interim dividend of 50 SA cents per share has been paid in September 2020 (bar just for illustrative purposes)
1.                      Converted at US$/R17.00 exchange rate
2.                      Exclude minority dividends payments by DRDGOLD due to the consolidation as recorded in the financial statements
3.                      Source: FactSet at 16 Nov 2020                                                                                                                                                                                    13
The capital allocation conundrum – a nice problem to have!
Capital allocation considerations as a result of sustainable earnings
and cash flow:
•   Debt reduction
    •   Following conversion of CB, gross debt at target level of US$1bn
    •   Corporate bonds likely to be rolled over and refinanced on more
        favourable terms

•   Predictable and consistent dividends
    •   Dividend resumed in August 2020
    •   Policy is to pay 25-35% of normalised earnings
    •   Current proforma cash flow generation implies comfortable yield of over
        5% pa
•   Consistent share buybacks through cash settled incentive scheme
    •   Excess cash could be opportunistically deployed
•   Organic growth
    •   Attractive projects under review
•   M&A growth
    •   Gold diversification and tech metal strategy

We are particularly competent at recognising M&A value opportunities and smart transaction structuring
                                                                                                         14
Offering value and
positioned for a rerating
Solid cash flow consensus supports sustained leading dividend

                                 Cumulative three year consensus free cash flow (FCF) & Market capitalisation (US$m)
                                                                                                                       60000
                       14000

                                                                                                                               Market capitalisation (US$ million)
                                                                                                                       50000
                       12000

                       10000                                                                                           40000
   FCF (US$ million)

                       8000
                                                                                                                       30000
                       6000
                                                                                                                       20000
                       4000
                                                                                                                       10000
                       2000

                          0                                                                                            0

                                                 2020    2021    2022    Market capitalisation (US$'m) (rhs)

Three year cumulative forecast free cash flow equivalent to 62% of market capitalisation
Source: Factset at 16 Nov 2020                                                                                                                                       16
Offering clear upside based on consensus forecasts
                                                                                 Market consensus analysis

  EV / EBITDA (2020e / 2021e)                         P / FCFPS (2020e / 2021e)                           Net debt / 2020e EBITDA                 EV & market cap (USDm)

                                              9.2x                                               22.4x                                                                         31,996
                                                                                                         Intermediate
  Senior Gold¹                                        Senior Gold¹                                                                        0.2x    Senior Gold¹
                                                                                                                Gold²
                                       6.7x                                            13.1x                                                                                  29,143

                                      6.3x                                               14.6x                                                                       13,164
 Intermediate                                        Intermediate
                                                                                                          Senior Gold¹                   0.2x     Senior PGM³
        Gold²                                            Gold²
                                  5.0x                                               10.4x                                                                           13,616

                                    5.2x                                        7.2x                                                                               9,826
                                                                                                              Sibanye-                               Sibanye-
  Senior PGM³                                         Senior PGM³                                                                     0.05x
                                                                                                              Stillwater 4                           Stillwater
                             3.3x                                            4.3x                                                                                  9,506

                             3.4x                                               6.9x                                                                              8,110
      Sibanye-                                            Sibanye-                                                                                Intermediate
                                                                                                          Senior PGM³ (0.2x)
      Stillwater                                          Stillwater                                                                                     Gold²
                           2.5x                                               4.6x                                                                                7,500

Sources: Public information, FactSet, broker reports. Market data as of November 11, 2020
1. Senior Gold consists of Newmont, Barrick, Newcrest, Agnico Eagle and Kirkland Lake
2. Intermediate Gold (excluding Sibanye – Stillwater) consists of AngloGold, Northern Star, Kinross, Gold Fields, B2Gold, Evolution and Harmony
3. Senior PGM (excluding Sibanye – Stillwater) consists of Anglo American Platinum and Impala Platinum
4. As disclosed in Q3 2020 operating update on 29 th October 2020                                                                                                                  17
How did we get here?
Value creation journey - significant evolution and growth

                                                                     • 2013 SA gold operations unbundled by Gold Fields and independently listed
                       2013 listing – a mature SA                    • Restructured for profitability and created platform for future growth
                                                                     • Maintained industry leading dividend yield of 5% pa until 2017
                       gold producer
                                      Decisive
                                                                     • 2016 - Significant PGM acquisitions at a low point in the PGM price cycle
                                      implementation of              • Innovatively financed strategic growth, enhancing value
                                      PGM growth strategy            • Realisation of consolidation synergies yielding superior value ahead of schedule
                                      – transformative and
                                      value enhancing                • 2017- Transformative acquisition of Stillwater in May 2017
                                                                     • creating a globally competitive and unique SA mining company
                                                                     • Unique commodity mix and global geographic presence
                                                                     • 2018 – Acquired 38.5% of DRDGOLD a leading surface tailings retreatment
                                                2020 - a leading,      company
                                                integrated, global   • Increased shareholding to 50.1% in 2020
                                                precious metals      • June 2019 – concluded Lonmin acquisition
                                                Group                • Secured exposure to entire beneficiation chain in SA
                                                                     • Significant optionality to PGM prices and realisation of consolidation synergies

2013¹ market cap: US$1.1 billion                                                                                            2020² market cap: ~US$9.8 billion

 Delivering value while diversifying risk at a low point in precious metal price cycles

  ¹ 11 February 2013, Source: IRESS
  ² 16 November 2020, Source: IRESS                                                                                                                       19
…..at low point in the precious metals cycle

                • Total investment of US$3bn1 (R43bn) to build leading global PGM business – concluded within four
                  years at a favourable stage in the precious metals price cycle.

                                 300
                                         Aquarius and       Stillwater               DRDGOLD             Lonmin
                                 250
                                         Rustenburg         transaction              transaction         transaction
Relative price performance (%)

                                         transactions       announced -              announced -         announced –
                                 200
                                         announced -        US$/2E basket            R/kg gold           R/4E basket
                                         R/4E basket        price up 200%            price up 75%        price up 225%
                                 150     price up 225%      since

                                 100

                                  50

                                   0

                                 (50)
                                   Sep 15         Mar 16      Sep 16        Mar 17          Sep 17      Mar 18             Sep 18            Mar 19            Sep 19            Mar 20             Sep 20

                                            Gold US$/oz    Gold R/kg        PGM basket (R/4Eoz)      PGM basket (US$/4Eoz)                PGM basket (US$/2Eoz)
                                 Source: IRESS

 Successfully established a leading global PGM business through well priced transactions –surge in price enhancing value multiples
    1. Exchange rate applied to acquisition prices: Aquarius at US$/R14.87 on 12 April 2016, Rustenburg at US$/R13.60 on 1 Nov 2016, Stillwater at US$/R13.64 on 4 May 2017 and Lonmin at US$/R14.83 on 10 June 2019
    2. US$269m1 (R4.0bn) for Aquarius in Apr 2016; US$331m1 (R4.5bn4) for Rustenburg in Nov 2016; US$2.2bn (R30bn1) for Stillwater in May 2017; US$290m1 (R4.3bn³) for Lonmin in June 2019
    3. Estimate purchase price (not accounting value) of the Lonmin transaction based on Lonmin share capital figure of 290,394,531 shares in fixed ratio of 1:1 resulting in 290,394,531
       new Sibanye- Stillwater shares. Considerations estimate based on spot Sibanye-Stillwater closing share price on the JSE of R14.83 per share on 7 June 2019
    4. Minimum payment of R4.5 billion (R1.5bn upfront payment made). Balance settled from 35% of free cash flows from the Rustenburg operations                                                                20
SA gold operations
• Initial base from which the Group has expanded        • Reserves of 15.4Moz
• Industry leading dividends between 2014 – 2017          and Resources of
  average yield of 5%                                     98.1Moz

• Current life of mine (reserve declaration at 31 Dec   • Projects pipeline for
  2019)                                                   future consideration
                                                           - Burnstone
   - Beatrix 6 years
                                                           - Southern Free State
   - Driefontein 9 years                                     projects
   - Kloof 14 years
   - DRDGOLD Limited (50.1% interest) +20 years

Optimising gold base
                                                                                   21
SA PGM operations
• Consolidation of Western Limb of Bushveld Igneous           • Reserves of 28.2Moz (4E)
  Complex unlocking value through synergies                     and Resources of
                                                                                                                                    1
• Mine-to-market value exposure achieved with                   304.8Moz
                                                                                                                           2
  acquisition of Marikana’s processing facilities             • Attractive portfolio of
• Currently contributing to 59% of Group adjusted EBITDA        brownfields PGM projects                           3
                                                                                                                               1.   Northam

• Current life of mine (reserve declaration at 31 Dec 2019)     could extend life further                                      2.   Anglo America Platinum
                                                                                                                               3.   Siyanda Resources
                                                                 - K4                                      4
   - Kroondal 11 years                                                                                                         4.   Sedibelo Platinum
                                                                                                   2                           5.   Wesizwe Platinum
   - Mimosa 13 years                                             - E3                                                          6.   Royal Bafokeng Platinum
   - Marikana 14 years                                           - Pandora                                                     7.   Impala Platinum
                                                                                                                               8.   Eastern Platinum
   - Rustenburg 35 years                                                                           6
                                                                                                          5                         Rustenburg and Kroondal
                                                                                                               6                    Marikana (previously Lonmin)
                                                                                                                           6
                                                                                            Western Bushveld
                                                                                            Joint Venture
                                                                                                                       7

                                                                                                                                                7        8    1

                                                                                                                           Sibanye-Stillwater SA PGM
                                                                                                                               (excluding Mimosa)

Consistent operational performance ensuring leverage to higher rand 4E PGM basket price
                                                                                                                                                                   22
US PGM operations
                                                                                     191
                                                                                                 Sweet Grass                                                                  Yellowstone              87

• High grade, low cost operations with full
                                                                                                                                                                         72
                                                                                           Big Timber
                                                                                                                                                  Metallurgical                             Billings

  downstream smelting, refining and recycling
                                                         89

                                                                             90    298                                                                Complex,
  business in stable jurisdiction                                                                                                            Recycling Facilities
                                                                                                                                             Columbus           Laurel

                                                                Livingston        McLeod

• Largest global producer of primary palladium                 East
                                                    89

  in the world                                                Boulder                                             420                    Absarokee
                                                                                              NYE
                                                                                                                                                               310
                                                                                                                              Fishtail               212

                                                               Mine
                                                                                                                   419                                                                  Big Horn

• Leading global PGM recycling business                                                                                              Carbon

                                                                Park

                                                                                                        Stillwater
                                                                                                Stillwater Mine              78

• Current life of mine (reserve declaration at 31
  Dec 2019)                                                                                                Mine          Red Lodge

   - Stillwater (West) 27 years
   - Blitz (Stillwater East) 36 years
                                                                                              12.2km
   - East Boulder 35 years

                                                    • Reserves of 26.9Moz (2E) and Resources of 84.2Moz (2E)
                                                    • Lower East Boulder and lower Blitz projects offer additional growth potential
                                                    • 12.2 kilometres of undeveloped, mineralised section between Stillwater and East Boulder

Geographical diversification benefits evident during lockdown in SA
                                                                                                                                                                                              23
Integration specialists - proven track record of M&A value creation*
Rustenburg integration and payback                                                                        Lonmin (Marikana) integration and payback

                                                                                                           • Realised annual synergies of
• Realised annual synergies of over
                                                                                                             R1.05bn/US$62m* in the first 13
  R1bn /US$59m* in the first 14 months
                                                                                                             months
     - initially expected R800m/US$47m* over
                                                                                                                - initially expected R730m/US$43m* over
       3 years
                                                                                                                  2-3 years

• Synergies run rate of R1.2bn/US$71m* pa within 14                                                        • Synergies run rate of R1.85bn/US$109m* pa by end
  months - 22% of R4.5bn/US$331m1 acquisition price                                                          2020 - 43% of R4.3bn/US$290m1 acquisition price
  recovered in synergies every year                                                                          recovered in synergies each year
• Generated R14.4bn/US$994m adj EBITDA to date (48                                                         • Generated R10.2bn/US$629m adj EBITDA to date (17
  months)                                                                                                    months)

Track record of value creation through consolidation
*Where indicated, ZAR converted to US dollar using US$/R17.00                                                                                                                                               24
1. Exchange rate applied to acquisition prices: Aquarius at US$/R14.87 on 12 April 2016, Rustenburg at US$/R13.60 on 1 Nov 2016, Stillwater at US$/R13.64 on 4 May 2017 and Lonmin at US$/R14.83 on 10 June 2019
Conclusion
Strategic delivery

✓ Evolved from single SA gold assets to     ✓ Distinctive commodity and regional     ✓ Re-establishing leading total
  diversified precious metals company         diversification, a unique investment     shareholder return investment case
✓ Proven ability to prosper in South Africa   proposition                            ✓ Robust and flexible financial position
✓ Successful track record of strategic      ✓ Basket of metals produced essential       enables optionality for allocation of
  and efficient M&A delivery                  for delivery of low carbon future         capital
                                              globally                               ✓ Rerating in infancy
✓ Proven ability to integrate & realise
  value from acquisitions                   ✓ Sustained growth in earnings and       ✓ Implied low risk upside to achieve
                                              cash flow driven by production            peer ratings
                                              growth and fundamentally supported
                                              precious metal prices

                                                                                                                          26
Questions?
                                            Contacts
    James Wellsted/ Henrika Ninham/ Chris Law
                      ir@sibanyestillwater.com
Tel: +27(0)83 453 4014/ +27(0)72 448 5910/ +44 (0)7923126200

       Website: www.sibanyestillwater.co.za

 Tickers: JSE: SSW and NYSE: SBSW
You can also read