Platypus: an open-access software for integrating lymphocyte single-cell immune repertoires with transcriptomes
←
→
Page content transcription
If your browser does not render page correctly, please read the page content below
Published online 14 April 2021 NAR Genomics and Bioinformatics, 2021, Vol. 3, No. 2 1
doi: 10.1093/nargab/lqab023
Platypus: an open-access software for integrating
lymphocyte single-cell immune repertoires with
transcriptomes
Alexander Yermanos 1,2,3,* , Andreas Agrafiotis1 , Raphael Kuhn1 , Damiano Robbiani1 ,
Josephine Yates 1 , Chrysa Papadopoulou 1 , Jiami Han 1 , Ioana Sandu2 ,
Cédric Weber 1 , Florian Bieberich1 , Rodrigo Vazquez-Lombardi1 , Andreas Dounas4 ,
Daniel Neumeier1 , Annette Oxenius2 and Sai T. Reddy1,*
1
Department of Biosystems Science and Engineering, ETH Zurich, 4058 Basel, Switzerland, 2 Institute of
Microbiology, ETH Zurich, 8093 Zurich, Switzerland, 3 Department of Pathology and Immunology, University of
Geneva, 1211 Geneva, Switzerland and 4 Institute for Biomedical Engineering, University and ETH
Zurich, 8092 Zurich, Switzerland
Received October 15, 2020; Revised March 05, 2021; Editorial Decision March 15, 2021; Accepted March 17, 2021
ABSTRACT cytes. Platypus will expedite progress by facilitat-
ing the analysis of single-cell immune repertoire and
High-throughput single-cell sequencing (scSeq)
transcriptome sequencing.
technologies are revolutionizing the ability to molec-
ularly profile B and T lymphocytes by offering the
INTRODUCTION
opportunity to simultaneously obtain information on
adaptive immune receptor repertoires (VDJ reper- Immune repertoires are comprised of a diverse collection
toires) and transcriptomes. An integrated quantifi- of B-cell receptors (BCRs) and T-cell receptors (TCRs),
cation of immune repertoire parameters, such as which enable molecular recognition to a vast number of
germline gene usage, clonal expansion, somatic hy- pathogen and disease antigens. Immune repertoire diver-
sity is initially generated as a result of lymphocyte V(D)J
permutation and transcriptional states opens up new
recombination and, in the case of B cells, can undergo fur-
possibilities for the high-resolution analysis of lym- ther sequence diversification in the form of somatic hyper-
phocytes and the inference of antigen-specificity. mutation. Targeted deep sequencing of BCRs and TCRs
While multiple tools now exist to investigate gene from bulk populations of lymphocytes has paved the way
expression profiles from scSeq of transcriptomes, to quantify the diversity, distribution and evolution of im-
there is a lack of software dedicated to single- mune repertoires (1–4). However, one major challenge in
cell immune repertoires. Here, we present Platypus, immune repertoire sequencing is acquiring information on
an open-source software platform providing a user- correct receptor chain pairing [variable light (VL) and vari-
friendly interface to investigate B-cell receptor and able heavy (VH) for BCR and variable alpha (V␣) and vari-
T-cell receptor repertoires from scSeq experiments. able beta (V) for TCR], which greatly complicates identi-
Platypus provides a framework to automate and ease fication of clonal groups and antigen-specificity (5,6). Until
only recently it was not possible to directly integrate a lym-
the analysis of single-cell immune repertoires while
phocyte’s phenotypic gene expression information (i.e. acti-
also incorporating transcriptional information involv- vation, exhaustion and antibody secretion) with its immune
ing unsupervised clustering, gene expression and receptor sequence.
gene ontology. To showcase the capabilities of Platy- Recent developments in microfluidic and scSeq tech-
pus, we use it to analyze and visualize single-cell nologies have now made it possible to obtain information
immune repertoires and transcriptomes from B and on immune repertoires or transcriptional profiles at high-
T cells from convalescent COVID-19 patients, reveal- throughput (7–9). Several of these methods have been tai-
ing unique insight into the repertoire features and lored specifically for lymphocytes, thus making it possi-
transcriptional profiles of clonally expanded lympho- ble to perform parallel sequencing of immune repertoires
and whole transcriptomes (10,11). Furthermore, commer-
* To
whom correspondence should be addressed. Tel: +41 613874027; Email: ayermanos@gmail.com
Correspondence may also be addressed to Sai T. Reddy. Tel: +41 613873368; Email: sai.reddy@ethz.ch
C The Author(s) 2021. Published by Oxford University Press on behalf of NAR Genomics and Bioinformatics.
This is an Open Access article distributed under the terms of the Creative Commons Attribution License (http://creativecommons.org/licenses/by/4.0/), which
permits unrestricted reuse, distribution, and reproduction in any medium, provided the original work is properly cited.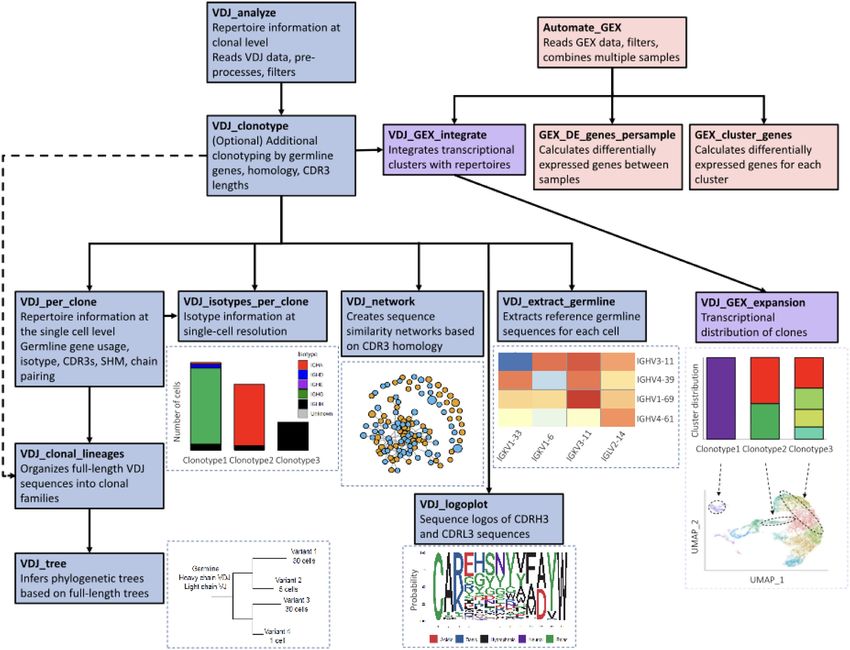
2 NAR Genomics and Bioinformatics, 2021, Vol. 3, No. 2
cially available instruments and protocols [10× Genomics Paque Plus reagent (GE Healthcare, #17-1440-02). After
Chromium and VDJ and gene expression (GEX) libraries] separation, the upper plasma layer was collected for ELISA
are further accelerating progress in this field. This simul- detection of IgG and IgA SARS-CoV-2-specific antibod-
taneous sequencing of immune repertoires and transcrip- ies (Euroimmun Medizinische Labordiagnostika, #EI2668-
tomes produces single-cell datasets with features rang- 9601G, #EI2606-9601A). Peripheral blood mononuclear
ing from quantitative gene profiles, cellular phenotypes, cells (PBMC) were collected from the interphase, resus-
transcriptional clustering, clonal diversity and expansion, pended in freezing medium (Roswell Park Memorial Insti-
germline gene usage, somatic hypermutation, among many tute (RPMI) medium 1640, 10%(v/v) fetal bovine serum
others. These high-dimensional datasets can be mined to (FBS), 10%(v/v) dimethyl sulfoxide) and cryopreserved in
discover novel insight on lymphocyte immunobiology, func- liquid nitrogen. Point-of-care lateral flow immunoassays as-
tion and specificity. For example, one recent study leveraged sessing the presence of IgG and IgM SARS-CoV-2-specific
scSeq to discover the distinct transcriptional profiles and antibodies (Qingdao Hightop Biotech, #H100) were per-
specificity of B cells following influenza vaccination (8). In formed at the time of blood collection.
another study, clonal expansion and activation signatures
of tumor-infiltrating T cells were profiled (12). Other studies
Immunomagnetic isolation of B and T cells
have leveraged this technology to answer fundamental ques-
tions across a variety of areas in immunology such as bacte- PBMC samples were thawed, washed in complete media
rial infection responses (13), tumor-immune microenviron- (RPMI 1640, 10%(v/v) FBS) and pelleted by centrifuga-
ment (14), clonal expansion in Alzheimer’s disease (9) and tion. Cells were resuspended in 0.5 ml complete media,
B-cell differentiation (15). counted and treated with 10 U ml–1 DNase I (Stemcell
While multiple bioinformatic tools exist to facilitate rapid Technologies, #07900) for 15 min at RT in order to pre-
analysis of gene expression from scSeq (16–19), they do vent cell clumping. After DNase I digestion, cells were
not allow the incorporation of immune repertoire informa- washed in complete media, pelleted by centrifugation and
tion. Analogously, existing software packages to analyze resuspended in 0.5 ml flow cytometry buffer [phosphate-
immune repertoires do not allow the user to supply accom- buffered saline (PBS), 2%(v/v) FBS, 2 mM ethylenedi-
panying gene expression and transcriptome data (20–22). aminetetraacetic acid]. The cell suspension was filtered
Taken together, these considerations complicate the analy- through a 40 M cell strainer prior to immunomagnetic
sis of BCR and TCR repertoires for those with little bioin- isolation. As a first step, plasma cells were isolated using
formatics experience and who are unfamiliar with the out- the EasySep Human CD138 Positive Selection Kit II for
put data from scSeq experiments. To address the lack of future studies (Stemcell Technologies, #17877). The nega-
software specifically tailored to single-cell lymphocyte se- tive fraction of the above selections was divided into two
quencing data, we developed Platypus, an open-source R aliquots that were subjected to negative immunomagnetic
package that contains an automated pipeline to analyze and isolation of either B cells (EasySep Human Pan-B-cell En-
integrate single-cell immune repertoires with transcriptome richment Kit, Stemcell Technologies, #19554) or T cells
data. With only a few lines of code, Platypus allows users (EasySep Human T cell Isolation Kit, Stemcell Technolo-
to easily extract immune repertoire features such as clonal gies, #17951). After isolation, B and T cells were pelleted
expansion, somatic hypermutation, isotype switching and by centrifugation, resuspended in PBS, 0.4% bovine serum
integrate it with transcriptome features such as differential albumin (BSA)(v/v), filtered through a 40 M cell strainer
gene expression. We subsequently demonstrate the value and counted. T and B cells originating from the same pa-
of this package using scSeq data from convalescent coro- tient were pooled in equal numbers and the final suspen-
navirus disease 2019 (COVID-19) patients. Our analysis re- sion was counted and assessed for viability using a fluores-
vealed clonal expansion in B and T cells, and within these cent cell counter (Cellometer Spectrum, Nexcelom). When-
we could identify distinct patterns of somatic hypermuta- ever possible, cells were adjusted to a concentration of 1 ×
tion, amino acid usage, clonal convergence and transcrip- 106 live cells/ml in PBS, 0.04%(v/v) BSA before proceeding
tional heterogeneity. Taken together, Platypus helps facili- with droplet generation.
tate the analysis of single cell immune repertoires and tran-
scriptomes and reveal novel insights such as the transcrip-
Single cell sequencing libraries
tional profile of clonal expanded and potentially pathogen-
reactive lymphocytes. Single cell 10× libraries were constructed from the iso-
lated single cells following the Chromium Single Cell V(D)J
MATERIALS AND METHODS Reagent Kits User Guide (CG000086 Rev M). Briefly, single
cells were co-encapsulated with gel beads (10× Genomics,
Patient samples
1000006) in droplets using four lanes of one Chromium
Patients were participants of the SERO-BL-COVID-19 Single Cell A Chip (10× Genomics, 1000009). V(D)J li-
study sponsored by the Department of Health, Canton brary construction was carried out using the Chromium
Basel-Landschaft, Switzerland. Both patients tested posi- Single Cell 5’ Library Kit (10× Genomics, 1000006) and the
tive for SARS-CoV-2 after reverse transcription polymerase Chromium Single Cell V(D)J Enrichment Kit, Human B
chain reaction (RT-PCR) of naso- and oropharyngeal swab Cell (10× Genomics) and Human T Cell (10× Genomics).
and did not require hospitalization. Whole blood was col- The reverse transcribed cDNA was split in three and GEX,
lected 31 and 32 days following a positive RT-PCR test and B and T cell V(D)J libraries were constructed following the
subjected to density gradient centrifugation using the Ficoll instructions from the manufacturer. Final V(D)J libraries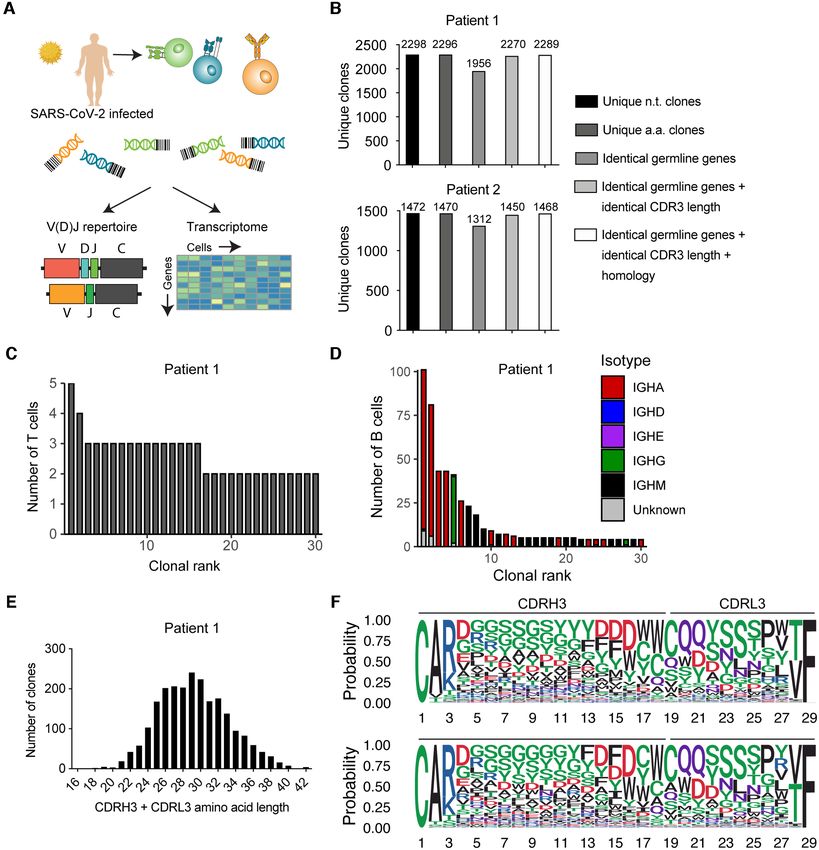
NAR Genomics and Bioinformatics, 2021, Vol. 3, No. 2 3
were pooled and sequenced on the Illumina NovaSeq plat- determined from the output function of call MIXCR
form (300 cycles, paired-end reads). Pooled 5’ gene expres- in Platypus. The reference germline sequence was first
sion libraries were and sequenced on the Illumina NextSeq extracted from the initial cellranger alignment using the
500 (26/91 cycles, paired-end) with a concentration of 1.6 function VDJ extract germline in Platypus and added to
pM with 1% PhiX. Resulting FASTQ files were demulti- the set of input sequences which were supplied to VDJ tree.
plexed and subsequently used as input to cellranger (v3.1.0, Sequence similarity networks were calculated using the
10× Genomics). GEX sequencing libraries were aligned function VDJ networks in Platypus by calculating the
to the refdata-cellranger-GRCh38–3.0.0 reference genome edit distance separately for CDRH3 and CDRL3 amino
and VDJ genes and the VDJ sequencing libraries were acid sequences and then summing the two matrices. Edges
aligned to the vdj GRCh38 alts ensembl-3.1.0–3.1.0 refer- were then drawn between those clones separated by less
ence using Single Cell V(D)J R2-only chemistry. than either 14 or 10 amino acid mutations. Networks
from the VDJ network function in Platypus relied upon
igraph (v1.2.4.1). The heatmap integrating clonotype
Immune repertoire analysis using Platypus
membership with user-defined gene lists was created using
The R package, accompanying code, and processed the GEX heatmap function in Platypus. Additional R
sequencing data used in this study are publicly packages utilized by Platypus in this study include ggplot2
available at github.com/alexyermanos/Platypus and (v3.2.1), stringdist (v0.9.5.5), stringr (v1.4.0), dplyr (v1.0.1),
doi.org/10.5281/zenodo.4140161. Briefly, clonotyping in- seqinr (v3.6.1), org.Mm.eg.db 3.10.0, scales (v1.0.0) and
formation was extracted directly from the output directory knitr (v1.28). All analysis was performed using R (v3.6.1)
of cellranger using the function analyze VDJ in Platypus within Rstudio (v1.2.5019) using a MacBook Pro (2016,
(v2.0.3). Quantifying the number of unique clones was v10.14.16) and could be reproduced on Windows 10 Pro
performed using the VDJ clonotype function in Platy- (v1909) using R (v4.0.0) within Rstudio (v1.1.463).
pus, with clone.strategy set to either ‘cdr3.aa’, ‘hvj.lvj’, Circos plots depicting V-J gene usage were produced the
‘hvj.lvj.cdr3length.cdr3homology’, or ‘hvj.lvj.cdr3lengths’. VDJ VJ usage circos function in Platypus for the top 10
The isotype distributions for the top thirty B-cell clones clones with the c.threshold = 1, label.threshold = 50 and
were calculated using the VDJ isotypes per clone function cell.level = T arguments. This function relies upon the cir-
in Platypus. CDR3 length distribution and sequence logo clize R package (v0.4.12) (33). V-J gene usage heatmaps
plots were calculated on the output of the VDJ per clone were produced using the pheatmap package (v1.0.12). Gene
function. Sequence logos were calculated based on the ontology was performed using the GEX GOterm function
the R package ggseqlogo (v0.1) (32), with method set to in Platypus under default parameters, which relies upon
‘prob’ and seq type set to ‘aa’. The output directory from functions from edgeR (v3.28.1) (34) and limma (v3.42.2)
cellranger count was supplied as input to the function auto- (35). Gene set enrichment analysis was performed using
mate GEX, that analyzes and integrates transcription data the GEX GSEA function in Platypus under default pa-
using functions from the R package Seurat (v3.1.1). Briefly, rameters, which additionally relies upon fgsea (v1.12) (36),
the GEX libraries were integrated using the SCTransform tibble (v2.1.3) and the C7 gene set from the molecular
function from Seurat. Cells containing more than 20% signatures database (37) (MSigDB, gsea-msigdb.org/gsea/
mitochondrial genes were removed. TCR and BCR genes msigdb/collections.jsp#C7).
were filtered prior to integration and gene expression
analysis. The number of variable features selected was 2000 RESULTS
for the RunPCA function using the first 10 dimensions
Single-cell immune repertoire sequencing analysis
and cluster resolution was set to the default 0.5. Transcrip-
tional cluster and clonotype information were integrated Platypus allows the user to integrate single-cell immune
using the VDJ GEX integrate function in Platypus under repertoire and transcriptome sequencing data, which in-
default parameters. Quantification of the transcriptional cludes automation of pre-processing, filtering and data vi-
cluster distribution for the 10 most expanded clones sualization (Figure 1). While Platypus is optimized for data
from patient 1 were calculated and visualized using the generated by the 10× Genomics System, it is also adapt-
VDJ GEX expansion function in Platypus. Those cells able to other cell-barcode based scSeq data (e.g. RAGE-seq,
from the two most expanded clones containing barcodes Split-Seq (10,23)). Users can supply the path to the out-
in both VDJ and GEX datasets were highlighted on the put directory from the 10× cellranger alignment as input
UMAP plot using the function visualize clones GEX in to Platypus, which then extracts and annotates key immune
Platypus under default parameters. Somatic hypermu- repertoire metrics such as clonal diversity, clonal expan-
tation was calculated in the VDJRegion as defined by sion, somatic hypermutation, reference germline gene usage
MiXCR via the function call MIXCR in Platypus, which and sequence motifs (Figure 1). Platypus can perform ad-
utilized MiXCR (v3.0.12) (22). The number of nucleotide ditional clonotyping, either increasing or relaxing the pre-
alignment mismatches between the reference germline and determined stringency of upstream alignment tools by in-
the full-length VDJRegion for both heavy and light chain corporating information regarding germline gene usage or
nucleotide sequence was then computed based on the best sequence homology thresholds. In addition to clonal se-
alignment determined by MIXCR. The phylogenetic tree quence information [based on complementarity determin-
was inferred by appending the full-length VDJRegion ing region 3 (CDR3)], it also extracts full-length sequences
of the heavy and light chain for each unique sequence of both immune receptor variable chains (VH and VL for
after appending VH VDJRegion and VL VDJRegion, as BCRs and V␣ and V for TCRs). Furthermore, Platypus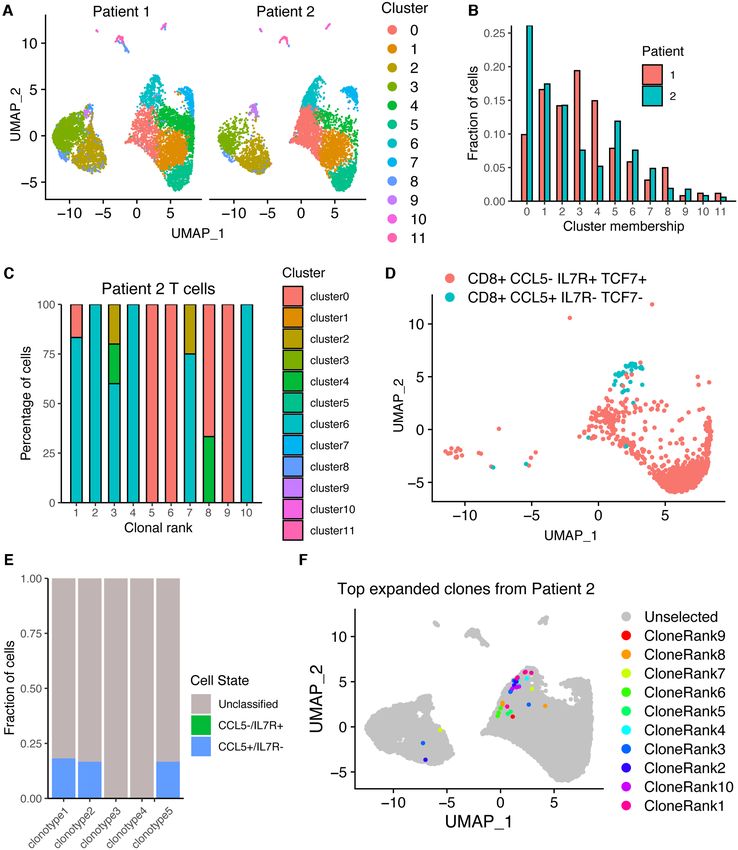
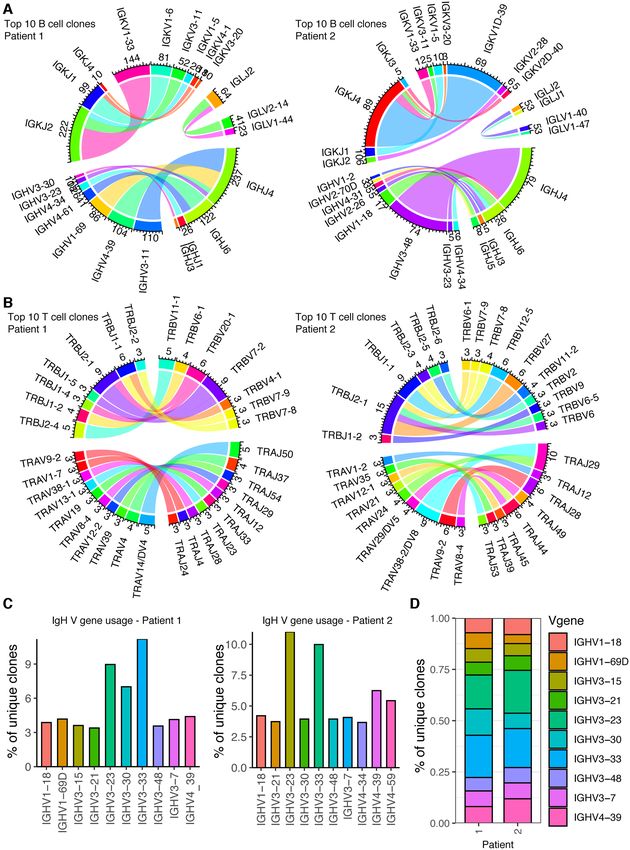
4 NAR Genomics and Bioinformatics, 2021, Vol. 3, No. 2

Figure 1. Flowchart demonstrating the workflow of Platypus. A selection of functions internal to Platypus and their respective relationships are depicted.
Each node in the flow chart indicates a process in the workflow requiring just a single line of code with user-definable parameters.

enables the quantification, comparison and visualization of                    and B). We were able to relate isotype information with
more advanced repertoire features such as sequence simi-                       clonal expansion at single-cell resolution, thereby observ-
larity networks (1), phylogenetic tree construction (24,25),                   ing that the majority of the most expanded B-cell clones
isotype quantification and diversity metrics (26).                             were predominantly of the IgA isotype and that some clones
   To demonstrate the potential of Platypus, we performed                      contained cells of multiple isotypes (e.g. BCRs with iden-
single-cell immune repertoire and transcriptome sequenc-                       tical CDRH3 + CDRL3 sequence but different constant
ing on B and T cells isolated from PBMCs of two convales-                      regions) (Figure 2D and Supplementary Figure S2B). We
cent COVID-19 patients (Figure 2A). 10× Genomics’ basic                        questioned how relaxing the clonotyping definition from
alignment tool is cellranger, which has a default clonotyp-                    identical CDRH3 + CDRL3 nucleotide sequence to iden-
ing strategy that groups identical CDRH3 + CDRL3 nu-                           tical V and J germline genes, identical CDR3 lengths, and
cleotide sequences into clonal families; this approach would                   a 70% CDR3 homology threshold would alter the clonal
be too restrictive in identifying clonotypes of B cells that                   expansion profile for each patient. This analysis revealed
have undergone somatic hypermutation in the CDR3s. We                          that the clonal frequency and isotype distribution was mi-
thereby demonstrated the ability and impact of changing                        norly impacted for the most expanded clones for both pa-
the clonotyping strategy to include germline genes, CDR3                       tients (Supplementary Figure S1B). We next used built-in
length restrictions and sequence homology requirements for                     functions of Platypus to extract other common immune
the B-cell repertoires of the two COVID-19 patients, which                     repertoire statistics and features, such as CDR3 length dis-
resulted in a decrease in the number of unique clones when                     tribution and common sequence space motifs (sequence
additional repertoire features were included in the clonotyp-                  logo plots) (Figure 2E and F; Supplementary Figure S1C).
ing definition (Figure 2B). Next, using Platypus, we were                      This revealed tremendous diversity in the B-cell response at
able to detect and visualize clonal expansion for both B                       the most common paired CDRH3 + CDRL3 amino acid
and T cells (Figure 2C and D; Supplementary Figure S1A                         sequence length in both COVID-19 patients (Figure 2F).
NAR Genomics and Bioinformatics, 2021, Vol. 3, No. 2 5 Figure 2. Extracting and visualizing clonal information of PBMCs from patients recently infected with SARS-CoV-2 using Platypus. (A) Experimental overview for single-cell immune repertoire of B and T cells in two patients previously infected with SARS-CoV-2. (B) Multiple B-cell clonotyping strategies involving CDR3 sequence identity, germline gene usage and sequence homology thresholds from the two patients previously infected with SARS-CoV-2. (C) Clonal expansion profiles of the T cells from the blood repertoires of one individual recently infected with SARS-CoV-2. Clone is defined as unique CDR3 + CDR␣3 nucleotide sequence. (D) Clonal expansion profiles of the B cells from the blood repertoires of one individual recently infected with SARS-CoV-2. Clone is defined by unique CDRH3 + CDRL3 nucleotide sequence. Color depicts isotype on the cell level within each clone determined by the VDJ repertoire sequencing libraries. Plots produced using VDJ isotypes per clone in Platypus. (E) Length distribution of the paired CDRH3 + CDRL3 amino acid sequences from the B-cell clones of a single patient. (F) Sequence logo plots of those paired CDRH3 + CDRL3 amino acid sequences with a combined sequence length of 29 in two patients. Colors correspond to biochemical properties: red = acidic, blue = basic, black = hydrophobic, purple = neutral, green = polar. Top logo plot corresponds to patient 1 and bottom logo plot corresponds to patient 2.
6 NAR Genomics and Bioinformatics, 2021, Vol. 3, No. 2

While we focused on the most frequent CDRH3 + CDRL3              to sample heterogeneity (Supplementary Figure S3A). To
sequence length, such an analysis using Platypus could the-      better characterize the gene expression signatures dictat-
oretically be applied to other single-cell subsets, such as B    ing the unsupervised clustering, we computed differentially
cells with known antigen-specificity or cells that underwent     expressed genes based on Seurat’s FindAllMarkers func-
extensive somatic hypermutation.                                 tion. A notable difference in the Platypus workflow is that
                                                                 the user can directly filter out mitochondrial and riboso-
                                                                 mal genes and can additionally visualize either the most ex-
Expanded clones demonstrate diverse germline gene usage
                                                                 pressed (log fold-change) or most significant (adjusted P-
Studying germline gene usage in the context of immune            value) genes that define each cluster. Performing this analy-
repertoires has been crucial to understanding selection in       sis for the COVID-19 patients demonstrated clear B- and T-
the context of disease, infection and immunization (26–28).      cell clusters, defined by expression of TCF7, LEF1 (clusters
We therefore designed Platypus to provide a diverse set of       0 and 1), CD74, CD79A (clusters 2 and 3), IL7R (cluster 4)
functions to quantify and visualize germline gene usage.         and CCL5, NKG7, GNLY (cluster 6) (Supplementary Fig-
Leveraging this pipeline for the two COVID-19 patients           ure S3B). This was confirmed by highlighting gene expres-
demonstrated diverse germline gene usage for both B and T        sion of CD4, CD8A, CD3E and CD19 on the UMAP, which
cells, with certain V-J pairing arising more frequently than     revealed a separation between B and T cells and confirmed
others across heavy, light, beta and alpha chains (Figure        similarly distributed lymphocyte populations arising from
3A and B; Supplementary Figures S2A–C). We could simi-           both patients (Supplementary Figure S4). Of note is that
larly investigate the most frequently used germline genes for    we detected CD3E expression in the B-cell clusters on the
each patient, revealing that while some genes were among         UMAP, in addition to minor CD19 expression in the T-cell
the ten most expressed V genes in both patients (IgHV1–18,       clusters (Supplementary Figure S4), together suggesting the
IgHV3–23), others (IgHV1–69D) were found exclusively in          possibility of doublets in which B and T cells were present
a single patient (Figure 3C). When integrating the V genes       in the same microfluidic droplet.
from both patients; however, the overall IgH V gene us-             We next investigated which transcriptional-based clus-
age of the most expressed V genes was highly comparable          ter contained the most expanded T-cell clones. We could
(Figure 3D), potentially representing either SARS-CoV-2-         demonstrate in one of the COVID-19 patients that some of
induced clonal convergence or simply a representation of         the most expanded T-cell clones were located across mul-
the germline gene usage of the natural human repertoire.         tiple transcriptional clusters, demonstrating heterogeneous
                                                                 gene expression signatures (Figure 4C). Furthermore, we
                                                                 observed that the majority of expanded CD8+ T cells were
Integration of single-cell immune repertoires and transcrip-
                                                                 located in cluster 6 (Figure 4C), which corresponded to
tomes
                                                                 high expression of CCL5, NKG7 and GNLY (Supplemen-
A critical feature of Platypus is that it can seamlessly in-     tary Figure S1B). We next leveraged the GEX phenotype
tegrate single-cell immune repertoire data with transcrip-       function in Platypus to assign custom phenotypes based
tome sequencing data. It allows users to directly interact       on gene expression to gain insight into the relationship be-
with the commonly used scSeq transcriptome analysis pro-         tween gene expression and clonal expansion. To this end,
gram Seurat (16), while tuning parameters specifically rele-     we labeled cells either as memory-like (CD8+, CD44+,
vant for immune repertoires. Therefore, we next investigated     SELL+, IL7R+, CCL5-) or effector-like (CD8+, CD44+,
additional repertoire and transcriptional data of highly ex-     SELL-, IL7R-, CCL5+) (Figure 4D). CCL5 was selected
panded B and T cell clonal groups, which allows us to relate     because it coincided with granzyme, NKG7 and GNLY ex-
repertoire information (e.g. expansion, CDR3 sequence and        pression but was present in a higher proportion of cells
isotype) to phenotypic cellular behavior (e.g. whether a cell    (Supplementary Figure S3B). Quantifying the proportion
is proliferating, differentiated, activated, exhausted, etc.).   of cells in the five most expanded T-cell clones indeed con-
We first integrated the transcriptome sequencing data from       firmed that they were more often labeled effector-like de-
both COVID-19 patients by normalizing and scaling the            spite many more total cells corresponding to the memory-
data using default parameters in Seurat (although Platypus       like phenotype (Figure 4E). This analysis further revealed
supports other normalization methods, such as SCTrans-           that many of the cells from the most expanded clones
form and Harmony) (16,17). We could thereby compute              were unclassified, which was likely due to relatively low
clusters based on gene expression and subsequently visu-         RNA counts common to scSeq experiments. We therefore
alize the cells from each patient on the same 2D uniform         utilized the GEX visualize clones function in Platypus to
manifold approximation projection (UMAP) plot (Figure            overlay clonal information directly onto the UMAP plot
4A). Quantifying the distribution of cells in each cluster       to overcome the high proportion of cells lacking a pheno-
demonstrated variability between the two patients despite        typic label. To investigate the transcriptional heterogene-
identical experimental conditions (Figure 4B). Utilizing the     ity of clonally expanded T cells, we supplied the clonal in-
Seurat-based pipeline in Platypus, we performed global dif-      dex of the top 10 most expanded clones from a single pa-
ferential gene expression between the two patients and pro-      tient and visualized where these cells lie within the UMAP
duced heatmaps of the most up- and downregulated genes           plot, again revealing that many of the expanded clones
based on either expression (log-fold change) or significance     were located in cluster 6 (Figure 4F). This approach can be
(adjusted P-value) (Supplementary Figure S3A). This re-          leveraged to profile transcriptome signatures of well-defined
vealed that varying expression levels of MHC-related and         clones, for example, ones in which antigen specificity is
immune-related (CXCR4, IL32, IL7R) genes contributed             known.
NAR Genomics and Bioinformatics, 2021, Vol. 3, No. 2 7 Figure 3. Analyzing and visualizing germline gene usage from B and T cell repertoires of two patients recently infected with SARS-CoV-2. (A and B) Circos plots for the ten most expanded B- and T-cell clones for each patient. Each line indicates the V and J gene usage for either the heavy or light chain (alpha/beta in the case of T cells) for an individual cell. The inner track number and the corresponding thickness of the bar indicates the number of cells using a given germline gene. Color corresponds to germline gene. Plots were produced using VDJ VJ usage circos in Platypus. (C) VH gene usage for the ten most used VH genes in each repertoire. Clone is defined as unique CDRH3 + CDRL3 nucleotide sequence for B cells and unique CDR3 + CDR␣3 nucleotide sequence for T cells. Plots were produced using VDJ Vgene usage in Platypus. (D) Stacked bar plot comparing the ten most used VH genes across both patients. Plots produced using VDJ Vgene usage stacked barplot in Platypus.
8 NAR Genomics and Bioinformatics, 2021, Vol. 3, No. 2 Figure 4. Integration of gene expression (GEX) and repertoire (VDJ) sequencing datasets from two patients recently infected with SARS-CoV-2. (A) Uniform manifold approximation projection (UMAP) of gene expression data from both COVID-19 patients. Cluster corresponds to the transcriptional clustering performed on the GEX datasets after excluding TCR and BCR receptor genes. Each point corresponds to a cell in one of the two patients. (B) Distribution of the fraction of cells located in each transcriptional cluster for all cells of each patient. Produced using the GEX cluster membership function in Platypus. (C) Distribution of the fraction of cells located in each transcriptional cluster for the top 10 most expanded T-cell clones of a single COVID-19 patient. Only those cells found in both GEX and VDJ sequencing datasets were included in the quantification. T-cell clone was defined by unique CDR3 + CDR␣3 nucleotide sequence. (D) UMAP displaying those cells from both patients corresponding to memory-like or effector-like phenotypes labeled using the GEX phenotype function from Platypus. (E) Fraction of cells from the top five most expanded T-cell clones from patient 2 matching either of the phenotypes in (D). Unclassified indicates lack of CD8, CCL5, IL7R and TCF7 expression. Plot was produced with GEX phenotype per clone in Platypus. (F) The 10 most expanded T-cell clones defined by unique CDR3 + CDR␣3 nucleotide sequence from a single COVID-19 patient are highlighted on the UMAP containing all cells from both patients. Each point corresponds to a unique cell barcode. Only those cells found in both GEX and VDJ sequencing datasets were included in the quantification. Plot was produced using GEX visualize clones in Platypus.
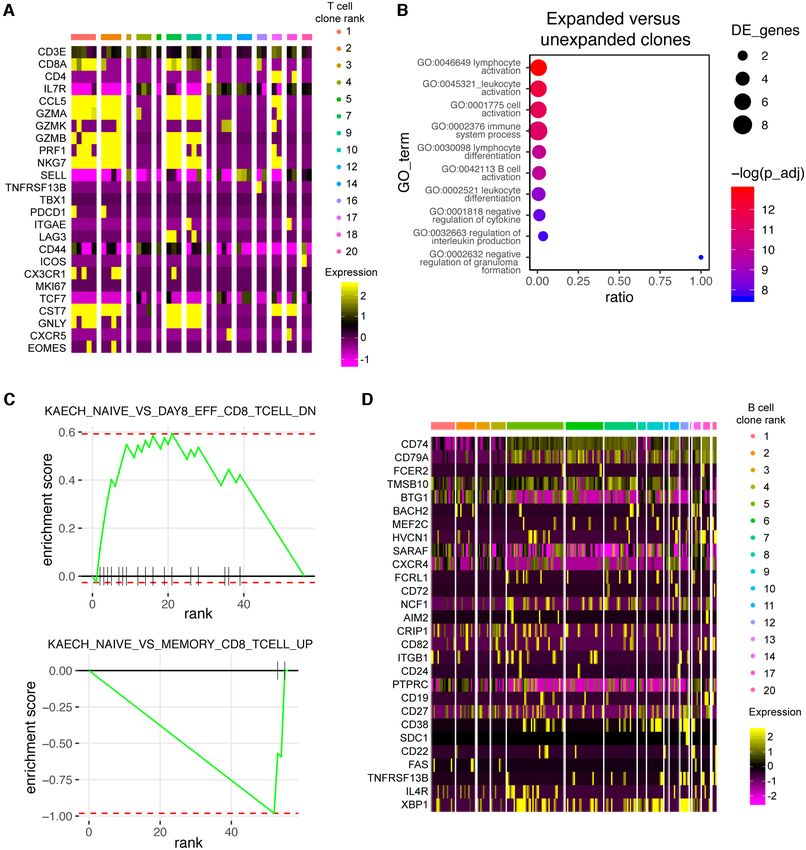
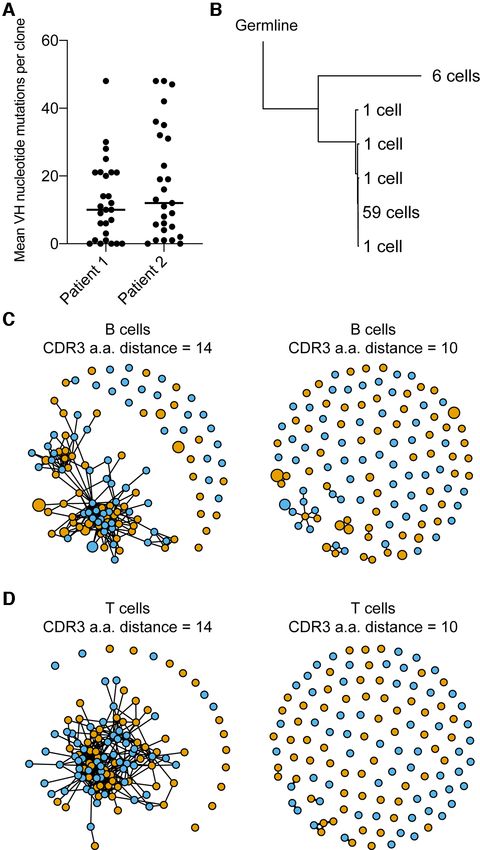
NAR Genomics and Bioinformatics, 2021, Vol. 3, No. 2 9

   Next, we determined whether we could use Platypus to           tional heterogeneity based on commonly used T-cell mark-
identify potentially virus-reactive B- and T-cell clones by in-   ers. Using the built-in gene sets internal to Platypus, we
tegrating repertoire metrics, such as somatic hypermutation       could visualize expression levels for genes, such as CD44,
and clonal similarity with phenotypic markers of activation       PD1 (PDCD1), LAG3, TCF7, granzymes, perforin, TBET,
and differentiation. We first noticed that 30 most expanded       EOMES, among others, at single-cell resolution (Figure
B-cell clones had undergone somatic hypermutation in their        6A). Together, these genes allowed us to distinguish between
VH segments, and since these patients were convalescent           naı̈ve (CD44-, TCF1+, SELL+), memory (IL7R+), effector
but still actively infected, highly mutated antibodies repre-     (KLRG1+) and exhausted (PD1+, LAG3+), subtypes that
sent potential-specific clones to SARS-CoV-2 (Figure 5A).         coexist within clonotypes (Figure 6A). Of interest was that
Next, we used Platypus to infer the phylogenetic tree for the     the cells arising from expanded clones (e.g. clonotypes 1, 2,
most expanded B-cell clone while also annotating informa-         3) expressed CCL5 and granzymes, whereas several clones
tion about clonal expansion (based on identified number of        corresponding to either one or two cells did not express
cell barcodes) (Figure 5B). Surprisingly, we uncovered that       these markers (Figure 6A). Importantly, the user can cus-
59 cells produced the exact same, full-length nucleotide an-      tomize the genes of interest to explore in the context of ex-
tibody sequence and was actually the least mutated relative       panded clones. We next explicitly questioned whether gene
to the unmutated germline ancestral sequence (Figure 5B).         ontology and gene set enrichment analyses would confirm
The potential specificity of an antibody that has minor so-       our observations that expanded T-cell clones have a more
matic hypermutation is compatible with the recent discov-         effector-like phenotype. To this end, we computed and vi-
ery that B cells from COVID-19 patients that have germline-       sualized the differentially expressed genes upregulated in
like antibodies with specificity to SARS-CoV-2 (22).              the expanded (>1 cell) clones relative to the unexpanded
   We next questioned whether we could detect similar             (1 cell) clones, which confirmed that granzymes, CCL5 and
CDR3 sequences shared between the two COVID-19 pa-                NKG7 were among the most significantly upregulated genes
tient repertoires by inferring sequence similarity networks       by adjusted P-value. Leveraging the GEX GOterm and
for the top 60 most expanded B- and T-cell clones (1).            GEX GSEA functions in Platypus, we used these upregu-
This involved first calculating the edit distance between         lated genes as input to unbiased gene ontology and gene set
the CDR3s of clones from both patients and then drawing           enrichment, which both resulted with hits relating to im-
edges between those clones that were separated by either          mune activation (Figure 6B) and enrichment matching ef-
10 NAR Genomics and Bioinformatics, 2021, Vol. 3, No. 2

Figure 5. Functions from Platypus extract parameters relevant to the discovery of antigen-specific B- and T-cell clones. (A) Mean nucleotide somatic hy-
permutation for the 30 more expanded B-cell clones found in the blood repertoire following SARS-CoV-2 infection. Somatic hypermutation was quantified
in the V and J segments for both the heavy and light chains for each cell by comparing misalignments to the reference germline segments. (B) Phylogenetic
tree rooted by germline reference sequence. The reference germline as determined by cellranger was set as the root. The number of cells in the tip label
corresponds to the number of unique nucleotide variants producing the exact, full-length antibody sequence. Each tip label represents a single unique
nucleotide paired VH + VL sequence. (C and D) Similarity networks depicting the B- and T-cell clones that are separated by either
NAR Genomics and Bioinformatics, 2021, Vol. 3, No. 2 11 Figure 6. (A) Heatmap depicting normalized gene expression for the most expanded T-cell clones that were found in both the VDJ and gene expression (GEX) sequencing libraries from the blood repertoires of COVID-19 patients. The color of each column corresponds to an individual clonal family and the width of the bar corresponds to the number of cells found in the GEX library for that clone. Clone is defined as cells containing identical CDR3 + CDR␣3 nucleotide sequences. (B) Gene ontology (GO) term enrichment for the top 10 most upregulated genes in the expanded clones relative to the unexpanded clones by average log fold-change. The color of each dot corresponds to adjusted P-value. The size of the dot corresponds to the number of genes of the particular GO term. Ratio corresponds to the number of differentially expressed genes relative to the number of total genes corresponding to each GO term. Produced using the GEX GOterm function in Platypus. (C) Gene set enrichment (GSEA) plots based on the C7 immunological signatures from the Broad institute. The top 10 most upregulated (top panel) and the top 10 most downregulated (bottom panel) genes between expanded and unexpanded T-cell clones were produced using the GEX GSEA function in Platypus. The enrichment plot of the highest scoring gene set is displayed. (D) Heatmap depicting normalized gene expression for the most expanded B cells found in both VDJ and GEX sequencing libraries. Clone is defined as those cells containing identical CDHR3 + CDRL3 sequence.
12 NAR Genomics and Bioinformatics, 2021, Vol. 3, No. 2

lowed us to analyze and extract full-length, paired, heavy-                  8. Horns,F., Dekker,C.L. and Quake,S.R. (2020) Memory B-cell
light chain information for clonally expanded and heavily                       activation, broad anti-influenza antibodies, and bystander activation
                                                                                revealed by single-cell transcriptomics. Cell Rep., 30, 905–913.
mutated clones, which offers a possible approach to iden-                    9. Gate,D., Saligrama,N., Leventhal,O., Yang,A.C., Unger,M.S.,
tify SARS-CoV-2-specific lymphocytes. Leveraging Platy-                         Middeldorp,J., Chen,K., Lehallier,B., Channappa,D., De Los
pus, we were able to visualize this information and have full-                  Santos,M.B. et al. (2020) Clonally expanded CD8 T cells patrol the
length BCR and TCR sequences ready for cloning in less                          cerebrospinal fluid in Alzheimer’s disease. Nature, 577, 399–404.
than 10 lines of code––something that can greatly acceler-                  10. Singh,M., Al-Eryani,G., Carswell,S., Ferguson,J.M., Blackburn,J.,
                                                                                Barton,K., Roden,D., Luciani,F., Giang Phan,T., Junankar,S. et al.
ate the discovery of adaptive immune therapeutics. In con-                      (2019) High-throughput targeted long-read single cell sequencing
clusion, Platypus enables a broad range of immunologists                        reveals the clonal and transcriptional landscape of lymphocytes. Nat.
and bioinformaticians alike to gain quantitative insight at a                   Commun., 10, 3120.
single-cell resolution of how immune repertoire parameters                  11. Meyer,K.D. (2019) DART-seq: an antibody-free method for global
                                                                                m6A detection. Nat. Methods, 16, 1275–1280.
relate to heterogeneous transcriptome information.                          12. Wu,T.D., Madireddi,S., de Almeida,P.E., Banchereau,R.,
                                                                                Chen,Y.-J.J., Chitre,A.S., Chiang,E.Y., Iftikhar,H., O’Gorman,W.E.,
DATA AVAILABILITY                                                               Au-Yeung,A. et al. (2020) Peripheral T-cell expansion predicts
                                                                                tumour infiltration and clinical response. Nature, 579, 274–278.
The R package, code and example data used in this pub-                      13. Bossel Ben-Moshe,N., Hen-Avivi,S., Levitin,N., Yehezkel,D.,
                                                                                Oosting,M., Joosten,L.A.B., Netea,M.G. and Avraham,R. (2019)
lication are available at github.com/alexyermanos/Platypus                      Predicting bacterial infection outcomes using single cell
and https://doi.org/10.5281/zenodo.4140161.                                     RNA-sequencing analysis of human immune cells. Nat. Commun.,
                                                                                10, 3266.
                                                                            14. Cheung,D., Adams,B.A., McDonnell,W.J., Jaffe,D.B., Puleo,A.R.,
SUPPLEMENTARY DATA                                                              Sukovich,D.J., Reyes,D.J., Royall,A.J., Chi,J.C., Srinavas,N.J. et al.
                                                                                (2020) Profiling the immune infiltrate in tumor samples at single cell
Supplementary Data are available at NARGAB Online.                              resolution. J. Immunol., 204, 243.20.
                                                                            15. King,H.W., Orban,N., Riches,J.C., Clear,A.J., Warnes,G.,
ACKNOWLEDGEMENTS                                                                Teichmann,S.A. and James,L.K. (2021) Single-cell analysis of human
                                                                                B cell maturation predicts how antibody class switching shapes
We acknowledge and thank Dr Christian Beisel, Elodie                            selection dynamics.Sci Immunol., 6, eabe6291.
Burcklen and Ina Nissen, at the ETH Zurich D-BSSE Ge-                       16. Butler,A., Hoffman,P., Smibert,P., Papalexi,E. and Satija,R. (2018)
                                                                                Integrating single-cell transcriptomic data across different conditions,
nomics Facility Basel for excellent support and assistance.                     technologies, and species. Nat. Biotechnol., 36, 411–420.
Author Contributions: A.Y., A.A., R.K., D.R., J.Y., C.P.,                   17. Korsunsky,I., Millard,N., Fan,J., Slowikowski,K., Zhang,F., Wei,K.,
J.H., I.S. and C.W. contributed to the code used in this                        Baglaenko,Y., Brenner,M., Loh,P. and Raychaudhuri,S. (2019) Fast,
manuscript. F.B. and R.V.L. performed experiments. All au-                      sensitive and accurate integration of single-cell data with Harmony.
                                                                                Nat. Methods, 16, 1289–1296.
thors contributed to the study and manuscript design.                       18. Zhang,X., Xu,C. and Yosef,N. (2019) Simulating multiple faceted
                                                                                variability in single cell RNA sequencing. Nat. Commun., 10, 2611.
                                                                            19. Zappia,L., Phipson,B. and Oshlack,A. (2017) Splatter: simulation of
FUNDING                                                                         single-cell RNA sequencing data. Genome Biol., 18, 174.
European Research Council, Starting Grant [679403 to                        20. Lefranc,M.-P., Giudicelli,V., Duroux,P., Jabado-Michaloud,J.,
                                                                                Folch,G., Aouinti,S., Carillon,E., Duvergey,H., Houles,A.,
S.T.R.]; ETH Zurich, Research Grants (to S.T.R., A.O.).
                                                                                Paysan-Lafosse,T. et al. (2014) IMGT® , the international
Conflict of interest statement. None declared.                                  ImMunoGeneTics information system® 25 years on. Nucleic Acids
                                                                                Res., 43, 413–422.
                                                                            21. Li,S., Lefranc,M.-P., Miles,J.J., Alamyar,E., Giudicelli,V., Duroux,P.,
REFERENCES                                                                      Freeman,J.D., Corbin,V.D.A., Scheerlinck,J.-P., Frohman,M.A. et al.
1. Miho,E., Yermanos,A., Weber,C.R., Berger,C.T., Reddy,S.T. and                (2013) IMGT/HighV QUEST paradigm for T-cell receptor IMGT
   Greiff,V. (2018) Computational strategies for dissecting the                 clonotype diversity and next generation repertoire immunoprofiling.
   high-dimensional complexity of adaptive immune repertoires. Front.           Nat. Commun., 4, 2333.
   Immunol., 9, 224.                                                        22. Bolotin,D.A., Poslavsky,S., Mitrophanov,I., Shugay,M.,
2. Greiff,V., Miho,E., Menzel,U. and Reddy,S.T. (2015) Bioinformatic            Mamedov,I.Z., Putintseva,E.V. and Chudakov,D.M. (2015) MiXCR:
   and statistical analysis of adaptive immune repertoires. Trends              software for comprehensive adaptive immunity profiling. Nat. Meth.,
   Immunol., 36, 738–749.                                                       12, 380–381.
3. Georgiou,G., Ippolito,G.C., Beausang,J., Busse,C.E., Wardemann,H.        23. Rosenberg,A.B., Roco,C.M., Muscat,R.A., Kuchina,A., Sample,P.,
   and Quake,S.R. (2014) The promise and challenge of                           Yao,Z., Graybuck,L.T., Peeler,D.J., Mukherjee,S., Chen,W. et al.
   high-throughput sequencing of the antibody repertoire. Nat. Biotech.,        (2018) Single-cell profiling of the developing mouse brain and spinal
   32, 158–168.                                                                 cord with split-pool barcoding. Science, 360, 176–182.
4. Yaari,G. and Kleinstein,S.H. (2015) Practical guidelines for B-cell      24. Yermanos,A., Greiff,V., Krautler,N.J., Menzel,U., Dounas,A.,
   receptor repertoire sequencing analysis. Genome Med., 7, 121.                Miho,E., Oxenius,A., Stadler,T. and Reddy,S.T. (2017) Comparison
5. Shugay,M., Britanova,O.V., Merzlyak,E.M., Turchaninova,M.A.,                 of methods for phylogenetic B-cell lineage inference using
   Mamedov,I.Z., Tuganbaev,T.R., Bolotin,D.A., Staroverov,D.B.,                 time-resolved antibody repertoire simulations (AbSim).
   Putintseva,E.V., Plevova,K. et al. (2014) Towards error-free profiling       Bioinformatics, 33, 3938–3946.
   of immune repertoires. Nat. Meth., 11, 653–655.                          25. Yermanos,A.D., Dounas,A.K., Stadler,T., Oxenius,A. and
6. Brown,A.J., Snapkov,I., Akbar,R., Pavlović,M., Miho,E.,                     Reddy,S.T. (2018) Tracing antibody repertoire evolution by systems
   Sandve,G.K. and Greiff,V. (2019) Augmenting adaptive immunity:               phylogeny. Front. Immunol., 9, 2149.
   progress and challenges in the quantitative engineering and analysis     26. Greiff,V., Menzel,U., Miho,E., Weber,C., Riedel,R., Cook,S.,
   of adaptive immune receptor repertoires. Mol. Syst. Des. Eng., 4,            Valai,A., Lopes,T., Radbruch,A., Winkler,T.H. et al. (2017) Systems
   701–736.                                                                     analysis reveals high genetic and antigen-driven predetermination of
7. Picelli,S., Faridani,O.R., Björklund,Å.K., Winberg,G., Sagasser,S.         antibody repertoires throughout B-cell development. Cell Rep., 19,
   and Sandberg,R. (2014) Full-length RNA-seq from single cells using           1467–1478.
   Smart-seq2. Nat. Protoc., 9, 171–181.
NAR Genomics and Bioinformatics, 2021, Vol. 3, No. 2 13
27. Yermanos,A., Sandu,I., Pedrioli,A., Borsa,M., Wagen,F., Oetiker,N., 32. Wagih,O. (2017) ggseqlogo: a versatile R package for drawing
Welten,S.P.M., Pallmer,K., Reddy,S.T. and Oxenius,A. (2020) sequence logos. Bioinformatics, 33, 3645–3647.
Profiling virus-specific Tcf1+ T-cell repertoires during acute and 33. Gu,Z., Gu,L., Eils,R., Schlesner,M. and Brors,B. (2014) circlize
chronic viral infection. Front. Immunol., 11, 986. Implements and enhances circular visualization in R. Bioinformatics,
28. Kräutler,N.J., Yermanos,A., Pedrioli,A., Welten,S.P.M., Lorgé,D., 30, 2811–2812.
Greczmiel,U., Bartsch,I., Scheuermann,J., Kiefer,J.D., Eyer,K. et al. 34. Robinson,M.D., McCarthy,D.J. and Smyth,G.K. (2010) edgeR: a
(2020) Quantitative and qualitative analysis of humoral immunity Bioconductor package for differential expression analysis of digital
reveals continued and personalized evolution in chronic viral gene expression data. Bioinformatics, 26, 139–140.
infection. Cell Rep., 30, 997–1012. 35. Ritchie,M.E., Phipson,B., Wu,D., Hu,Y., Law,C.W., Shi,W. and
29. Robbiani,D.F., Gaebler,C., Muecksch,F., Lorenzi,J.C.C., Wang,Z., Smyth,G.K. (2015) limma powers differential expression analyses for
Cho,A., Agudelo,M., Barnes,C.O., Gazumyan,A., Finkin,S. et al. RNA-sequencing and microarray studies. Nucleic Acids Res., 43, e47.
(2020) Convergent antibody responses to SARS-CoV-2 in 36. Sergushichev,A.A. (2016) An algorithm for fast preranked gene set
convalescent individuals. Nature, 584, 437–442. enrichment analysis using cumulative statistic calculation. bioRxiv
30. Raybould,M.I.J., Kovaltsuk,A., Marks,C. and Deane,C.M. (2020) doi: https://doi.org/10.1101/060012, 20 June 2016, preprint: not peer
CoV-AbDab: the coronavirus antibody database. Bioinformatics, reviewed.
https://doi.org/10.1093/bioinformatics/btaa739. 37. Liberzon,A., Subramanian,A., Pinchback,R., Thorvaldsdóttir,H.,
31. Todd,D.J., McHeyzer-Williams,L.J., Kowal,C., Lee,A.-H., Tamayo,P. and Mesirov,J.P. (2011) Molecular signatures database
Volpe,B.T., Diamond,B., McHeyzer-Williams,M.G. and (MSigDB) 3.0. Bioinformatics, 27, 1739–1740.
Glimcher,L.H. (2009) XBP1 governs late events in plasma cell
differentiation and is not required for antigen-specific memory B-cell
development. J. Exp. Med., 206, 2151–2159.You can also read