PLASTIC POLLUTION IN AFRICA - IDENTIFYING POLICY GAPS AND OPPORTUNITIES - SOUTH AFRICA - WWF
←
→
Page content transcription
If your browser does not render page correctly, please read the page content below

SOUTH AFRICA

               PLASTIC POLLUTION
               IN AFRICA
               IDENTIFYING POLICY GAPS AND OPPORTUNITIES

                                                           1
Authors
Zaynab Sadan and Lorren de Kock (WWF)

Contributors
Alex Kubasu, Lara Muaves, Lethabo Pholoto (WWF)

Internal reviewers
Torbjørn Graff Hugo, Durrell Nzene Halleson,
Nour Mansour, Moloko Masipa (WWF)

External reviewers
Edward Kimakwa (Private), Peter Manyara (IUCN),
Griffins Ochieng (CEJAD)

WWF editorial
Sue Northam-Ras

Text editor
Marlene Rose

Cover photo
© WWF / Juozas Cernius

Design and layout
Design for development

© Text 2022 WWF

All rights reserved.

Published in 2021 by WWF – World Wide Fund for Nature
(formerly World Wildlife Fund), Cape Town, South Africa.
Any reproduction in full or in part must mention the title
and credit the above-mentioned publisher as the copyright
owner.

Citation: Sadan, Z. and De Kock, L. 2021. Plastic Pollution
in Africa: Identifying policy gaps and opportunities.
WWF South Africa, Cape Town, South Africa.

If you would like to share copies of this paper, please do so
in electronic PDF format. Available online at
www.wwf.org.za/report/plastic_pollution_policy_in_africa

For more information:
Zaynab Sadan at info@wwf.org.za or
call +27 (0)21 657 6600.

WWF is one of the world’s largest and most experienced
independent conservation organisations with over
6 million supporters and a global network active in more
than 100 countries.

WWF’s mission is to stop the degradation of the planet’s
natural environment and to build a future in which humans
live in harmony with nature, by conserving the world’s
biological diversity, ensuring that the use of renewable
natural resources is sustainable, and promoting the
reduction of pollution and wasteful consumption.

       Dedication
       This report is dedicated to Lara Muaves, a faithful
       colleague, friend, mother and daughter, who passed
       away unexpectedly in 2021. In her career as a
       biologist, researcher and conservationist, she not
       only contributed to the conservation of marine life
       through her work in climate change and plastics but
       also transformed the way in which countless fishing
       communities today develop their relationship with
       nature. Lara will always be remembered with great
       affection. May her soul rest in peace.

WWF PLASTIC POLLUTION IN AFRICA: IDENTIFYING POLICY GAPS AND OPPORTUNITIES
CONTENTS
                                ABOUT THIS REPORT                                             4
                                KEY MESSAGES                                                  5

                                SECTION 1: PLASTIC POLLUTION IN AFRICA                        6
                                  NO PLASTIC IN NATURE                                        6
                                  A GLOBAL CHALLENGE NEEDS A GLOBAL RESPONSE                  6
                                  THE STATE OF THE PLASTICS LIFE CYCLE IN AFRICA              7
                                  THE STATE OF PLASTICS IN NATURE ACROSS AFRICA               8
                                  PLASTIC POLLUTION SOURCES AND HOTSPOTS                      9
                                  PLASTICS LIFE CYCLE IMPACTS ON THE AFRICAN CONTINENT       12
                                  SYSTEM FAILURES IN THE PLASTICS LIFE CYCLE                 16
                                  10 PRIORITIES TO ADDRESS PLASTIC POLLUTION IN AFRICA       18

                                SECTION 2: PLASTIC POLLUTION POLICY GAPS ACROSS AFRICA       19
                                  INTERNATIONAL POLICY AND LEGAL FRAMEWORKS                  19
                                  REGIONAL POLICY, LEGAL AND INSTITUTIONAL FRAMEWORKS        24
                                  NATIONAL POLICY AND LEGAL FRAMEWORKS                       28
                                  TOP 5 POLICY GAPS                                          31

                                SECTION 3: POLICY OPPORTUNITIES TO ADDRESS
                                PLASTIC POLLUTION IN AFRICA                                  39
                                  ACTIVELY PARTICIPATE IN SHAPING A NEW GLOBAL TREATY        40
                                  DEVELOP A REGIONAL STRATEGY                                41
                                  ENSURE VALUE-CHAIN ACCOUNTABILITY                          41
                                  SET NATIONAL TARGETS                                       43
                                  FACILITATE PUBLIC-PRIVATE COLLABORATION TO TRANSITION TO
                                  A CIRCULAR PLASTICS ECONOMY                                44
                                  SUPPORT THE INTEGRATION OF THE INFORMAL SECTOR             44
                                  INTERVENTIONS FOR BEHAVIOUR CHANGE AND CAPACITY BUILDING
                                  ACROSS THE PLASTICS VALUE CHAIN                            45
                                BIBLIOGRAPHY                                                 46
                                GLOSSARY                                                     47

© Shutterstock / DigArt / WWF

                                                                                                  3
ABOUT THIS
      REPORT
      There is currently no comprehensive report or reference
      available on the state and impacts of plastic pollution in
      Africa specifically, or on the policy and legal frameworks
      required to address this challenge from an African context
      and perspective. This report aims to fill this knowledge gap
      by providing a brief glance at the plastic pollution challenge
      in Africa, the policy options available to address it and
      recommendations on the policy frameworks still required to
      tackle the challenge urgently, holistically and in a coordinated
      manner. This report is primarily aimed at policymakers and
      experts working in the plastic policy landscape in Africa.

      The report focuses on the role of policy and legal frameworks
      in addressing the plastic pollution challenge in Africa.
      Section 1 provides a continent-wide perspective of the plastic
      pollution challenge and the major impacts experienced
      across the African continent. In order to assess the extent
      to which existing policy and legal frameworks tackle the
      plastic pollution challenge, Section 2 highlights the gaps in
      these frameworks at the global, regional and national level.
      Case studies from various countries across the continent are
      used to illustrate examples of policy and legal frameworks
      at national level. Section 3 outlines the opportunities for
      policy and legal responses for Africa across all the life cycle
      stages of plastic, including the growing support for a new
      legally binding global treaty to combat plastic pollution.
      Voluntary initiatives and interventions that support policy
      are mentioned but not explored in detail.

© WWF / Arnold Mugasha

WWF PLASTIC POLLUTION IN AFRICA: IDENTIFYING POLICY GAPS AND OPPORTUNITIES
KEY MESSAGES
1. Plastic pollution contributes to impacts on human health,
   loss of livelihoods, greenhouse gas emissions, biodiversity
   loss and compromised ecosystem functioning in all Africa’s
   land- and seascapes.
2. Plastic production and consumption are expected to
   increase globally and in Africa in the coming decades if
   “business as usual” continues.
3. The complexity of the plastic pollution challenge requires
   multi-stakeholder interventions and coordinated action to
   address failures across the full plastics life cycle.
4. The existing policy and legal frameworks are fragmented
   and ineffective due to policy gaps at the global, regional
   and national level.
5. There is an urgent need to address these gaps through
   policy interventions designed to stimulate action to combat
   plastic pollution systemically using circular economy
   principles.
6. At a global level, African governments should actively
   participate in negotiations towards a new global treaty in
   order to offer perspectives and priorities from the African
   context.
7. At a regional level, African governments should develop
   a strategy that is aligned with global actions and that
   considers regional, subregional and national contexts.
8. At a national level, African governments have the
   opportunity to develop specific policy responses across the
   full plastics life cycle, depending on their national context,
   priorities and plastic hotspots.

                                               © WWF-Vietnam / Denise Stilley

                                                                            5
SECTION 1

PLASTIC POLLUTION
IN AFRICA
Africa is well known for its beautiful sunsets, pristine land- and seascapes
and impressive wildlife. However, not too far from these idyllic nature-based
tourism scenes are densely populated African cities. Most of Africa’s rural
towns and burgeoning cities, rivers and coastlines are increasingly becoming
heavily polluted with discarded plastic packaging and other plastic waste.

Africa, unlike Asia, is not yet a regional                 at the end-of-life stage when plastic         pollution at the national, subregional,
plastic pollution hotspot, but that could                  items are thrown away after use. Yet          regional and global levels, these
change if “business as usual” continues.                   plastic leakage into the environment is       initiatives are mostly fragmented
                                                           a symptom of failures at every stage of       and insufficient. At present, there

NO PLASTIC IN NATURE
                                                           the plastics life cycle: from raw material    is no global instrument in place
                                                           extraction to polymer production and
                                                                                                         to comprehensively tackle plastic
                                                           product design, to consumption and
                                                                                                         pollution across the full plastics life
Plastic is not inherently bad; it is a                     waste collection, to the management
                                                                                                         cycle using circular economy principles.
man-made material that contributes                         of plastic after use. The true lifetime
multiple benefits to society. However,                     cost of plastic pollution is not fully        Furthermore, the global plastics
the current linear economic model of                       accounted for. These costs include            value chain exacerbates the
“take-make-waste” is the root cause                        greenhouse gas emissions, human               transboundary nature of the plastic
of plastic pollution. The way plastic                      and ecosystem health impacts and              pollution challenge. The life cycle
is produced, and the way products                          unmanaged plastic waste (Dalberg,
                                                                                                         of one plastic item is spread across
and packaging is designed, combined                        2021).
                                                                                                         multiple countries, for example. The
with how plastic items are managed                         We need to think systemically across          raw materials can be extracted in
after use, are highly unsustainable and                    the full life cycle of plastic products. We   one country, plastic polymers can
damaging to both human health and                          must strive to keep our iconic African        be produced in another, products
nature.                                                    landscapes, seascapes and cities free         and packaging can be designed and
                                                           from devastating plastic pollution.           manufactured somewhere else, those
This problem is far-reaching.
                                                           We need to improve integration and            products can be consumed in another
Discarded plastic items found in nature
                                                           coordination of policy instruments            place entirely and sometimes the waste
fragment over time into smaller and
                                                           to eradicate plastic pollution and            management is done in a different
smaller pieces called microplastics.
                                                           accelerate a shift towards a circular         country yet again.
Microplastics are found in the food we
                                                           plastics economy in Africa.
eat, the water we drink and the air we
                                                                                                         However, there are increasing calls
breathe. Animals, including livestock,
                                                                                                         for a negotiation mandate for a new
can also confuse microplastics for
food, which often leads to fatalities.
                                                           A GLOBAL CHALLENGE NEEDS                      international legally binding treaty to
Plus, marine life often gets entangled                     A GLOBAL RESPONSE                             combat plastic pollution.
in single-use plastic bags, ropes or                                                                     The 2019 African Ministerial
discarded fishing nets. Plastic pollution
                                                           Plastic pollution is not confined to an       Conference on the Environment
thus poses a threat to Africa’s blue
                                                           isolated country or continent because         (AMCEN) – held in Durban in South
economy, affecting ocean-based
                                                           plastic waste may be moved around via         Africa – emphasised the need to
economic activities such as tourism,
                                                           atmospheric currents, transboundary           address plastic pollution at a continent-
fishing and maritime trade.
                                                           waterways and ocean currents. While           wide scale, with all African member
Plastic, and the subsequent impacts                        there are existing initiatives that aim       states supporting a declaration calling
across its life cycle, are most visible                    to address various aspects of plastic         for global action on plastic pollution.

WWF PLASTIC POLLUTION IN AFRICA: IDENTIFYING POLICY GAPS AND OPPORTUNITIES
THE PLASTICS LIFE CYCLE IN AFRICA
                                                      Key actors
                                                          Petrochemical companies
                                                                                             Key actors
                                                          Oil and gas companies
        Key actors                                                                               Plastic converters
                                                                                                 (manufacturers)
                                                          Raw material importers
           Recyclers
                                                                                                 Brand owners, retailers,
           Plastic converters                                                                    hospitality industry
           (manufacturers)
                                                                                                 Importers of plastic products
           Other sectors using recycled                                                          and packaging
           plastic (e.g. building and
                                                                                                 End consumers (individual,
           construction, clothing and
                                                                                                 institutional and commercial)
           textiles, agriculture)
                                                                 Stage 1
                                                               PRODUCTION

                                      Stage 5
                                    SECONDARY                                                  Stage 2
                                     MARKETS                                                   USAGE

    Key actors                                                                                            Key actors
                                                                                                              End consumers
        Municipalities
                                                                                                              Municipalities
        Waste management
        companies                                                                                             Waste management
                                                                                                              companies
        Recyclers
        Producer                              Stage 4                               Stage 3                   Informal sector
        Responsibility                      TREATMENT                             COLLECTION                  Producer Responsibility
        Organisations                                                                                         Organisations (collective
        (collective or individual)                                                                            or individual)

        Leakage into the
        natural environment

 1                                      2                         3                     4                        5
PRODUCTION                             USAGE                     COLLECTION            TREATMENT                SECONDARY MARKETS
Raw material extraction                Product and               Collecting            Treatment of             Reprocessing
                                       packaging design          plastic from          plastic waste            plastic into
Manufacturing of virgin plastic                                  end users and         through landfilling,     recycled plastic for
from fossil fuels or bio-based         Manufacturing/            sorting it into       incineration,            use in secondary
materials                              converting plastic        various streams       recycling and            markets
                                       resins into products      for treatment         dumping
Addition of chemical additives         and packaging             (formal and
that make the plastic resistant,                                                       Leakage into
                                                                 informal)
flexible (plasticisers), durable,      Sale and distribution                           the natural
grease-resistant or less               of products and                                 environment
flammable                              packaging

                                                                                                                                          7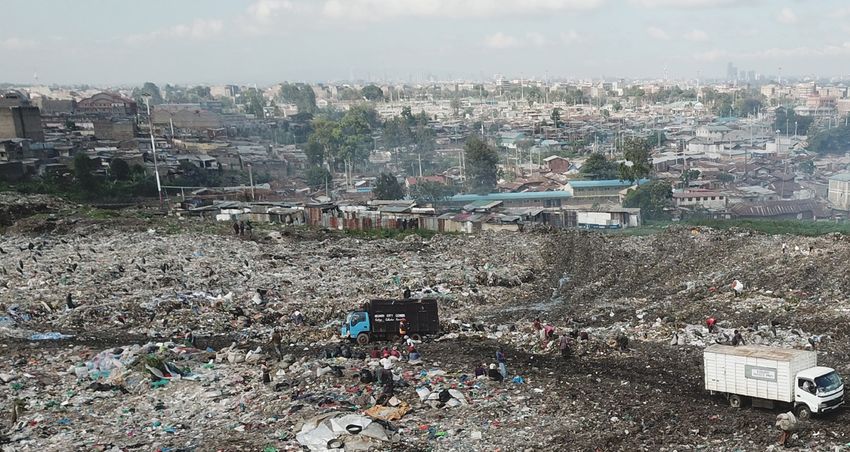
THE STATE OF THE PLASTICS                                  population growth (Lebreton and
                                                           Andrady, 2019).
                                                                                                       (AfCFTA) agreement and an increase
                                                                                                       in the availability of consumer goods
LIFE CYCLE IN AFRICA                                       While these production and
                                                                                                       on the market, coupled with increasing
                                                                                                       rates of urbanisation and rising living
                                                           consumption figures in Africa are small
                                                                                                       standards (UNEP, 2018a).
With 1,3 billion people living in                          compared to the rest of the world, the
Africa as of 2018 (16% of the world’s                      increase in imports of manufactured
population), Africa produces 5%
and consumes 4% of global plastic
                                                           plastic products and packaging into         THE STATE OF PLASTICS IN
                                                           African countries is concerning.
volumes (according to 2015 data).                          Extrapolating data on imports from          NATURE ACROSS AFRICA
Total global plastic production in                         1990 to 2017 from 33 African countries
2020 was over 400 million tonnes                           to 54 countries has found a steady          It is perhaps not surprising that Egypt,
(UNEP, 2021a). Most of the plastics                        increase in plastic product imports over    Nigeria and South Africa are the
are produced in China (28%), North                         the period. An estimated 230 million        largest contributors to plastic leakage
America (19%) and Western Europe                           tonnes of plastic (primary material         on the continent. These countries are
(19%). Interestingly, the same countries                   and products) entered Africa during         joined by Algeria and Morocco among
are the leading consumers of plastics,                     this period. This is projected to remain    the top 20 coastal countries in the
with China accounting for 20%, North                       on the upward trajectory with the           world contributing to marine plastic
America for 21% and Western Europe                         business-as-usual scenario (Babayemi        pollution (Jambeck et al., 2018). The
for 18% (Ryberg et al., 2018). Plastic                     et al., 2019). This is corroborated by      total amount of mismanaged plastic
consumption in Africa in 2015 was                          the fact that many global consumer          waste in coastal African countries was
16 kg per person, compared to the global                   brands are looking to grow their            estimated at 4,4 million tonnes in 2010
average of 45 kg per person and 136 kg                     markets in Africa, which indicates an       (Jambeck et al., 2018). A more recent
per person in Western Europe                               expected increase in imports, with few      study estimates a much larger number,
(Statista, 2016).                                          to no plans to invest in infrastructure     which also included contributions from
                                                           to manage the end-of-life stages of         landlocked countries. Africa generated
The countries with the largest
                                                           these plastic products and packaging        a total of 19 million tonnes of plastic
economies in Africa are Egypt, Nigeria
                                                           (Heinrich Böll Foundation, 2019).           waste in 2015, of which 17 million tonnes
and South Africa. According to a 2019
study using data between 2009 and                          Since the 1990s, there has been an          were mismanaged. This is compared
2015, these three countries were also                      increase in the presence of formal retail   to the global amount of 60–99 million
the highest producers and importers                        companies in many African countries,        tonnes of mismanaged plastic waste in
of plastic polymers and products. In                       with a subsequent increase in plastic       2015, projected to triple by 2060 in the
the same study, but using available                        packaging being placed on the market        business-as-usual scenario (Lebreton
data between 1990 and 2017, plastic                        (Mwamba and Qutieshat, 2021).               and Andrady, 2019).
imports in the form of polymers and                        A myriad emerging challenges has
                                                                                                       Geographical plastic leakage hotspots,
products from 33 African countries                         also arisen, such as the cost of doing
                                                                                                       stemming from land-based sources,
were analysed (Babayemi et al., 2019).                     business, the lack of infrastructure
                                                                                                       have been identified in many rivers
The total amount of imported plastic                       and decreasing commodity prices in
                                                                                                       close to urban centres where there
consumption in these countries was                         African countries. Because of this, a few
                                                                                                       is high waste generation but poor
118 million tonnes over the 27-year                        formal retail chains have exited some
                                                                                                       waste management. Over a quarter of
period. Collectively, six countries –                      countries. In turn, this has provided
                                                                                                       the total global mismanaged plastic
Egypt, Nigeria, South Africa, Algeria,                     opportunities for the expansion of the
                                                                                                       waste was leaked into the watersheds
                                                           informal market, including spaza shops
Morocco and Tunisia – made up                                                                          of 14 major rivers around the world,
                                                           and flea markets, which also makes
75% of the total imported plastic                                                                      including four big African rivers –
                                                           use of plastic packaging (Mwamba
consumption of those 33 African                                                                        the Congo, Niger, Nile and Zambezi
                                                           and Qutieshat, 2021). Due to the
countries – 51% of the extrapolated                                                                    (Lebreton and Andrady, 2019). These
                                                           ongoing Covid-19 pandemic, there has
total plastic consumption in Africa                                                                    four river basins overlap with the urban
                                                           been a rise in e-commerce in various
(1990–2017). However, other countries,                                                                 regions of some of the largest cities
                                                           African countries. This has resulted
including Ethiopia, Ghana, Kenya and                                                                   in Africa where the bulk of the plastic
                                                           in the rising consumption of plastic
Mozambique, have growing production                                                                    waste is generated, causing their plastic
                                                           packaging, which is higher relative
and imports of plastic goods, as well                      to the packaging consumed in                leakage hotspot status. Furthermore,
as growing plastic distribution and                        physical stores.                            these four river basins are part of
manufacturing industries (Babayemi et                                                                  63 major transboundary river basins in
al., 2019; Hasan, n.d.).                                   Plastic consumption and subsequent          Africa (UNEP, 2010) and are therefore
                                                           waste generation, along with the            potential carriers of plastic waste to
Plastic consumption demand is                              additives and toxic chemicals needed        other African countries and, eventually,
predicted to increase by 375% from                         to produce plastics, are growing in         into the ocean.
2015 to 2060 if “business as usual”                        African countries due a few main
continues. This expected exponential                       factors. These include the opening up       Domestic consumption and subsequent
increase is fuelled by predicted                           of markets across the continent via the     waste generation is not the only driver
gross domestic product (GDP) and                           African Continental Free Trade Area         of plastic pollution in Africa; large

WWF PLASTIC POLLUTION IN AFRICA: IDENTIFYING POLICY GAPS AND OPPORTUNITIES
amounts of plastic waste are also
imported from other countries that do
not treat this waste locally. With the
2018 ban on imports of plastic waste
                                            JOBS IN THE PLASTICS VALUE CHAIN
into China, plastic waste exports –
mainly from developed countries             Africa’s average unemployment rate is 12%. Angola, Namibia, Nigeria
including the United States of America      and South Africa have the highest unemployment rates, all of which are
and some countries in the European          above 30%. A large proportion of the unemployed or vulnerably employed
Union – were diverted to other              population consists of women and youth.
developing nations largely in Southeast     The plastics value chain provides several formal and informal jobs, but
Asia, but also to certain African           accurate and up-to-date data on the number and types of jobs in the
countries including Ethiopia and            plastics value chain in African countries is scarce. In South Africa, the total
Senegal (McCormick et al., 2019). This      number of formal jobs provided by plastics converters (manufacturers)
could lead to increased plastic pollution   were approximately 60 000 in 2018 (Tsotsi and Jenkins, 2019). This high
in countries with poor and limited          number can be attributed to the maturity of the plastics value chain in
solid-waste management and recycling        South Africa. This is not the case in other African countries, particularly
infrastructure, making it extremely         those without production and manufacturing infrastructure. A further
important for African countries to          7 892 formal jobs are provided in the plastics recycling sector in
limit the amount of imported plastic        South Africa (Plastics SA, 2019). In Nigeria, the formal and informal
waste. The Basel Convention (see            waste sectors are estimated to provide over 100 000 jobs (Heinrich Böll
page 20), which revised amendments          Foundation, 2020a).
to improve control of transboundary
movements of plastic waste, came into       There is an argument that decreasing plastic production and consumption
effect in January 2021. The aim is to       may result in job losses, which is a particular concern in African countries
                                            with high unemployment rates. However, research shows that circular
ensure that importing countries provide
                                            economy interventions present an opportunity for job creation in many
prior informed consent for plastic
                                            value chains, including plastics (Ribeiro-Broomhead and Tangri, 2021).
waste entering into those countries.
It is unclear what the effects of this      Informal waste collectors – also known as waste pickers or waste
amendment have been on the trade of         reclaimers – account for many more self-created livelihoods in the waste
plastic waste into Africa.                  sector. They earn their livelihoods from collecting, sorting and aggregating
                                            waste found in streets and landfills, or sourced directly from households.

PLASTIC POLLUTION SOURCES                   They then sell recyclable waste, including plastic items, to buyback centres
                                            or formal recyclers. In South Africa, some researchers estimate that
AND HOTSPOTS                                there are up to 215 000 waste reclaimers (Godfrey and Oelofse, 2017). In
                                            Morocco, the official estimate is between 7 000 and 10 000 informal waste
                                            collectors but other estimates indicate that there may be as many as 34 000
A global study by UN Environment            (Heinrich Böll Foundation, 2020b).
Programme (UNEP, 2018a), based on
2015 data, indicated that the largest       The collection and recycling of plastic and other waste are important
land-based activities contributing to       activities in a circular economy as they help to divert plastic waste from
both macro- and microplastic pollution      landfill and thus reduce plastic leakage into nature. These services –
are mismanaged solid waste and tyre         collection and recycling – are largely the responsibility of municipalities
abrasion. Ghost fishing gear, discarded     and, more recently, product producers as mandated by emerging Extended
plastic equipment from aquaculture          Producer Responsibility (EPR) regulatory frameworks (see page 35).
activities and littering from ships are     Yet the informal waste sector has been fulfilling this informal but vital
the main sea-based sources of plastic       “bridging service”, albeit in hostile living and working conditions and
pollution.                                  with minimal to no financial compensation. According to 2014 figures, the
                                            informal waste sector in South Africa saves local municipalities up to R750
                                            million (~$49 million) every year in landfill airspace for little to no cost
Solid waste from households                 (Godfrey et al., 2016).
According to the 2018 Africa Waste
                                            In countries like Ghana and Nigeria, policies that exclude considerations
Management Outlook Report, plastic
waste accounted for 13% of the              for the informal waste sector are a major setback to improving the informal
municipal solid waste in sub-Saharan        sector’s operations (Zolnikov et al., 2021; Gall et al., 2020). As a result, the
Africa. In Morocco, plastic accounts        formal waste management system (municipalities and industry) remains
for 10% of household waste or               largely exclusionary and exploitative in its approach to the activities of the
690 000 tonnes each year (Heinrich          informal waste sector (Oguge, 2019).
Böll Foundation, 2020b).

                                                                                                                               9
A recent study by the International                        problematic sectors are fishing and            regarding absolute plastic leakage, which
Union for Conservation of Nature                           medical, followed by agriculture and           includes macro- and microplastic leakage.
(IUCN) included a detailed analysis of                     automotive tyres. However, all these
plastic material flows in four African                     sectors contribute little to the overall
                                                                                                          Plastic carrier bags
countries – Kenya, Mozambique,                             absolute leakage compared to the
South Africa and Tanzania. That report                     packaging sector.                              Plastic carrier bags have been identified
provided updated data on the source                                                                       as problematic in most countries
of plastic pollution hotspots by sector,                                                                  globally due to their ubiquitous
                                                           Textiles                                       use and propensity to leak into the
application and polymer, as well as the
                                                           Synthetic textiles contribute to both          environment. By 2018, 127 countries
plastic leakage rates for these
                                                           macro- and microplastic pollution              had put into force some type of
four African countries. A total of
                                                                                                          legislation to ban the use, manufacture,
190 000 tonnes of plastic leaked into                      throughout their life cycle. The rise of
                                                                                                          free distribution and import of plastic
the marine environment from these                          the “fast fashion” industry has resulted
                                                                                                          bags (UNEP, 2018b). African countries
countries in 2018, with South Africa                       in increased consumption globally of
                                                                                                          have taken the lead on regulating
contributing the largest volume                            clothing made from polyester fibre.            plastic bags, with 37 countries having
(107 000 tonnes) and Mozambique                            Due to the markets being flooded with          some form of regulation on plastic
the least (17 000 tonnes) (Pucino et al.,                  polyester textiles, clothing prices are        bags in 2018. Even so, the enforcement
2020).                                                     continuously plummeting, resulting             of these bans have been a challenge
                                                           in 64% of clothing being disposed to           due to various factors such as illegal
Plastic packaging sector                                   formal waste treatment or informal dumps       trade and the exploitation of loopholes
                                                           (Heinrich Böll Foundation, 2020b). On          in regulations. Rwanda has been the
Packaging is the sector with the highest                                                                  most successful with plastic bag and
                                                           a global scale, the source of 98% of
absolute leakage (i.e. the total amount                                                                   other single-use plastic bans due to
                                                           microplastic pollution is from land-
of leaked plastic) in all four countries.                                                                 strict enforcement (Development
                                                           based activities and the rest from
It is also the sector with the highest                                                                    and Cooperation, 2021). In other
                                                           activities at sea. One of the largest
volumes of mismanaged waste. Plastic                                                                      African countries, plastic bags remain
                                                           sources of microplastics is from the
packaging is most likely the sector                                                                       a problem: this application has been
                                                           washing of synthetic textiles, which           identified as a hotspot in the case
hotspot for the continent (Babayemi
                                                           causes microfibres to enter wastewater         of Mozambique and Tanzania. The
et al., 2019).
                                                           streams (Boucher and Friot, 2017). In          infographics on this and the next page
In terms of relative leakage (i.e. the                     the four African countries listed in the       present plastic leakage hotspots per
amount of leaked plastic divided by the                    infographics, the textile sector is ranked     sector, application and polymer for four
amount of waste generated), the most                       second in three of the four countries          African countries.

                                                     PLASTIC LEAKAGE HOTSPOTS (TOP 2)

      COUNTRY                                        SECTORS                         APPLICATIONS                POLYMER
                                                                                     Other bottles
                                                            Packaging                                            Polypropylene (PP)
                       Kenya                                Textiles
                                                                                     (non-drinking)
                                                                                                                 Polyethylene (PE)
                                                                                     Lids and caps

                                                                                                                 Polyethylene
                                                            Packaging                Plastic bags                Terephthalate (PET)
                       Mozambique                           Textiles                 Disposable nappies          Low-density Polyethylene
                                                                                                                 (LDPE)

                                                            Packaging                Beverage bottles            LDPE
                       South Africa                         Automotive tyres         Disposable nappies          PET

                                                            Packaging                Plastic bags                PET
                       Tanzania                             Textiles                 Lids and caps               PP

                                                                                                      Source: Adapted from Pucino et al., 2020

WWF PLASTIC POLLUTION IN AFRICA: IDENTIFYING POLICY GAPS AND OPPORTUNITIES
Plastic from the fishing additional strain on the already limited Disposable nappies
waste collection and management
sector Single-use nappies (infant and adult)
infrastructure and exacerbate the
are a substantial contributor to plastic
An analysis of the fishing sector shows impacts of plastic pollution, specifically
waste globally. A recent study by
that between 12% and 36% of the blocked waterways and drainage
UNEP (2021d) has found that these
plastic used in fishing activities, which systems (Arimiyaw et al., 2021).
items have environmental impacts
includes fishing nets and packaging across their entire life cycle and are
used on board, leaks into the ocean. Disposable water sachets also a leading cost for local authorities
However, the absolute leakage from that are most often tasked with their
fishing activities usually contributes
and plastic bottles
disposal. The global disposable nappy
less than 1% of the total plastic leakage In many African countries, the use of market has experienced unprecedented
in each country (Pucino et al., 2020). bottled or sachet drinking water is a growth in the last few decades and is
growing business due to the lack of expected to exceed $71 billion by 2022.
access to potable water, with tap water This growth in consumption is most
Disposable plastic
often being of a lesser quality (Nyarko prevalent in developing countries,
medical gear and Adu, 2016). Unfortunately, these including African countries, due to high
In the past two years, the Covid-19 bottles (PET), lids, caps and sachets birth rates, improving economies and
pandemic has resulted in the increased (LDPE or HDPE) are major plastic urbanisation, and increased availability
leakage hotspots in countries like and marketing, among other factors
use of personal protective equipment
Ghana and Nigeria (Babayemi et al., (UNEP, 2021d). There is limited data
(PPE), including disposable surgical
on consumption and volumes for
masks and gloves, by individuals 2019). In the Ada East District of
disposable nappies in Africa but a
beyond medical professionals. The Ghana, an increase in plastic waste
recent study in South Africa, which
recommended frequency of replacing is noticeable, especially around the
investigated the feasibility of pyrolysis
surgical masks for hygiene reasons market region, consisting largely
plants to treat used nappies, found that
further adds to the increased generation of water bottles and sachets. The
a typical city generates between 67 000
of this waste stream. Evidence of these accumulation of plastic fragments
to 160 000 tonnes per annum (DFFE,
items being mismanaged after use, from plastic water sachets has led 2021). Less than 30% of these nappies
ending up as litter in city areas and to soil pollution in the surrounding are collected and taken to compliant
the natural environment, has been agricultural land, causing problems or non-compliant landfills. The
reported in the major cities of Kenya, such as decreased water penetration remaining volumes are uncollected and
Nigeria (Arimiyaw et al., 2021) and into the soil due to blockages, improperly disposed of, with significant
South Africa (Langa, 2021; Olatayo contamination of groundwater and poor volumes leaking into the environment
et al., 2021). These waste items put soil aeration (Nyarko and Adu, 2016). (IUCN-EA-QUANTIS, 2021).
PLASTIC POLLUTION SOURCES AND HOTSPOTS
SECTOR HOTSPOTS APPLICATION HOTSPOTS
PET bottles: 13 kt
Textiles:
Other bottles
7,7 kt
(non-drinking):
Packaging: 13,1 kt
114,2 kt
Bags: 9,5 kt
Automotive
Lids and caps: 3,1 kt
tyres:
9 kt Nappies: 4,6 kt
Kenya Mozambique South Africa Tanzania Kenya Mozambique South Africa Tanzania
Packaging Packaging Packaging Packaging Other bottles Bags PET bottles Other bottles
20,3 kt 12,9 k 63 kt 18 kt 5,4 kt 4,9 kt 13 kt 7,7 kt
Textiles Textiles Automotive tyres Textiles Lids and caps Nappies Nappies Bags
4,4 kt 0,7 kt 9 kt 2,6 kt 3,1 kt 1,6 kt 3 kt 4,6 kt
11© WWF / Juozas Cernius
PLASTICS LIFE CYLE IMPACTS IN THE AFRICAN CONTEXT
Human health impacts – plastic exposure Human health impacts – exposure to
and ingestion disease and toxic emissions
Studies have indicated that humans are ingesting micro- Contaminated solid waste is a vector for disease. With
platics due to bio-accumulation in various commercial marine the limited waste collection in many African cities, open
species (EFSA CONTAM Panel, 2016) and other products, dumps are prevalent in lower-income and marginalised
including bottled (Common and Szeto, 2018) and tap water, communities, putting residents in nearby communities, and
salt, fruit and vegetables (Conti et al., 2020). A recent study especially people who collect this waste, at risk. Plastic and
by Senathirajah et al. (2020) found that through routine food other solid waste can trap water or clog sewer lines, resulting
and beverage consumption, humans ingest up to 5 grams of in stagnating water that acts as a breeding ground for diseases
microplastics per week. That is the equivalent of one credit such as malaria and cholera, as reported in Kenya and the
card of plastic per week. This was a first attempt to determine Democratic Republic of the Congo (DRC) (UNEP, 2018a;
a mass range of microplastic ingestion and a key contribution Webster 2018).
towards the assessment of microplastic ingestion on human
health. Even though the human health impacts of ingestion Marginalised or “fence-line”’ communities are in many cases
via food intake or air is still unknown, it is clear that plastics situated near refineries and chemical facilities. Exposure to
are accumulating in human organs and tissue with future toxic substances places these communities at a higher risk
implications due to the absorption of embedded toxins. for heart disease, cancer and respiratory problems, such as
asthma and emphysema, related to poor air quality (UNEP,
In 2021, IPEN released two reports on research conducted 2021c). Various practices for heating or discarding purposes,
in Africa on the impact of plastic waste in food chains on such as the open burning and incomplete incineration of
human health. The research found that the levels of persistent plastic waste, cause the release of dangerous toxic gases and
organic pollutants (POPs) present in free-range chicken egg POPs into the atmosphere. These substances, such as dioxins,
samples show that current plastic waste sorting, dumping furans, mercury and polychlorinated bipheny, are harmful for
and open burning practices lead to severe contamination human inhalation (Verma et al., 2016). In Kenya, for example,
of the food chain in developing countries. Recycling of PVC recent assessments estimated the air pollution caused by
and e-waste can also lead to serious contamination with noxious chemical gases from open burning of mismanaged
POPs (Petrlik et al., 2021a). Another study analysed plastic plastic at 233 kilotonnes in 2018 (IUCN-EA-QUANTIS, 2020).
used in children’s toys and other consumable items for
hazardous chemicals such as POPs (Petrlik et al., 2021b). The
vast majority of items analysed presented dangerous levels
of POPs and fall above the limit defined in the Stockholm
Convention. These two studies provide evidence of significant
human health impacts from hazardous materials used as
additives in plastic.
WWF PLASTIC POLLUTION IN AFRICA: IDENTIFYING POLICY GAPS AND OPPORTUNITIES© Credit
© naturepl.com / Terry Whittaker / 2020VISION / WWF
Socio-economic impacts Infrastructure impacts
According to a 2021 WWF report authored by Dalberg, Poor and marginalised communities are more vulnerable to
Plastics: The Costs to Society, Environment and the the impacts of plastic pollution. These include the blockage
Economy (Dalberg, 2021), the minimum life cycle cost that of waterways and urban drainage systems, causing urban
was imposed on South Africa by the plastic produced in flooding and related damage. In South Africa, after a heavy
2019 is approximately $60,72 billion (±28%). This includes rainfall event, the Port of Durban is often forced to close due
damage to livelihoods and key economic industries such to the accumulation of large volumes of plastic and other
as tourism and fisheries, clean-up costs incurred by the wastes. This also causes damage to the engines of the ships
government and threats to the population’s health. A study docked in the area, all of which result in high costs of clean-up
conducted in Cape Town, South Africa, found that plastic and repair.
pollution on beaches has a major impact on the tourism
sector, potentially reducing tourism revenue and employment In the DRC, reports on the major cities of Kinshasa
by up to 91% (Jain et al., 2021). The City of Cape Town spends (Webster, 2018; Kubanza and Simatele, 2016) and
R13 million (~$819 000) on regular beach clean-ups per year, Lubumbashi (Mpinda et al., 2016) highlight that there are
and through this avoids damage of an estimated R8,5 billion limited formal waste management services in these cities,
(~$536 million) to the local tourism sector. For every rand particularly in areas with informal settlements. As a result,
(~$0,06) spent on beach clean-ups, 1,9 g of plastic litter is households resort to crude waste management methods such
collected, and R665 (~$42) is saved in tourism revenue. as open dumping, burying of waste and open burning. These
methods cause further negative environmental and health
The life cycle cost of plastic in other African countries is also impacts. Open burning, in particular, can damage roads,
understood to be significant and is an additional burden on waste skips and other municipal infrastructure and release
developing countries compared to higher-income countries. noxious chemicals into the environment.
In Tunisia in North Africa, the island of Djerba is a major
tourist destination that was visited by 1,8 million tourists The Hulene rubbish dumpsite is the largest of its kind in
in 2018. Here, the hotels alone account for up to 40% of the Maputo, Mozambique. It is situated next to an informal
total waste generated on the island, 11% of which is plastic settlement, where residents would scavenge for food,
(Heinrich Böll Foundation, 2020b). The estimated cost of recyclables and other items to sell. In February 2019, after
environmental degradation caused by waste and pollution heavy rains, the dumpsite collapsed and buried several houses
on the island was calculated at TND14,1 million (~$85 million) in the settlement. At least 17 people died and several were
in 2014. injured (BBC News, 2018).
13© Shutterstock / Ian Dyball / WWF-Peru
Ecosystem impacts – focus on agriculture Ecosystem impacts – focus on wildlife
and fisheries Much research has focused on the impact of plastic pollution
In terrestrial environments, landfills, urban surroundings and in the marine environment, but there is a significant
agricultural fields may be among those most contaminated increase in research in other environments, including
by plastic (Ng et al., 2018). Cases of land animals, such as inland water bodies and terrestrial environments. Globally,
camels and cows, dying from ingesting plastic have also been plastic pollution has affected 914 marine species through
reported (Plastic Soup Foundation, 2018; Priyanka and Dey, entanglement and/or ingestion (Kuhn and Van Franeker,
2018). These impacts on livestock, in turn, have negative 2020). In Africa, 59 research papers were analysed by
downstream impacts on African communities who depend on Akindele and Alimba (2021), which found plastic ingestion
livestock farming for subsistence and/or livelihoods. or entanglement in zooplankton, annelids, molluscs, fish,
birds and marine species in the inland and coastal waters of
In addition, subsistence fishing for food is significant in Africa. The toxicological implications of this ingestion are
coastal communities in Africa. Plastic pollution caused by detrimental to aquatic health and ecosystem services
ghost fishing gear and discarded aquaculture equipment in Africa.
poses a threat to food security and, most importantly, marine
ecosystems (Jambeck et al., 2018).
WWF PLASTIC POLLUTION IN AFRICA: IDENTIFYING POLICY GAPS AND OPPORTUNITIES© Credit
© WWF / Juozas Cernius
Ecosystem impacts – focus on mangroves Climate change impacts
Plastic waste from urban areas is often washed away by Plastic pollution and climate change are closely linked
rainwater and deposited in surrounding mangroves in many because plastic is primarily derived from fossil fuels. Fossil-
tropical countries with mangrove forests (Van Bijsterveldt fuel companies see plastics as a diversification strategy in the
et al., 2021). In Mozambique, this occurs in the cities of light of the increasing pressure for climate action.
Beira, Dondo, Inhambane, Maputo, Maxixe, Pemba and
Quelimane, as well as the district towns in the coastal zone of Greenhouse gas (GHG) emissions occur at every stage of the
Mozambique. Plastic litter in mangroves directly interferes plastics life cycle – from oil extraction and refining, transport
with the ecosystem, creating disturbance to the life of and plastic production to usage and final disposal of waste
invertebrates, fish in nurseries and frequently visiting birds. (UNEP, 2021c). The total GHG emissions from the plastics
Plastic pollution also interferes with the natural regeneration life cycle was 1,7 Gigatonnes (Gt) in 2015, which was 3,8%
of mangroves, hindering the natural process of tidal transport of total global emissions. By 2050, considering planned
of propagules and seeds, as it creates barriers that block expansion by the petrochemical industry, total life cycle
circulation and hamper the establishment of seedlings. GHG emissions are projected to increase fourfold to 56 Gt,
which will be 15% of the global carbon budget. Coupled with
findings that plastic pollution interferes with the life cycle of
zooplankton in the ocean, which is the largest natural carbon
sink on the planet (Shen et al., 2020), this should be cause for
serious concern and immediate attention.
SYSTEM FAILURES
There are multiple system failures at every stage in the plastics life cycle – and some cutting across all the stages – that
lead to increasing plastic pollution, as shown on the next page.
15SYSTEM FAILURES IN THE PLASTICS LIFE CYCLE
System failures specific to each life cycle stage
Virgin plastic still largely dependent on the fossil-fuel industry
Stage 1 Fossil-fuel industry projects have increased investments into plastic production
PRODUCTION Toxic or hazardous chemical additives used in the production of plastic products
Producers not accountable for the end-of-life stages of materials or products
Prevalence of single-use, problematic and unnecessary plastic product and packaging design
and unsustainable business models
No incentives for upstream innovation at the product design stage
A lack of standards for sustainability, safety and circularity in product design and accurate
Stage 2 labelling
USAGE A lack of individual or collective business commitments to transition to sustainable and
circular plastics
Multiple barriers for end consumers to make sustainable choices about plastic products and
packaging, including inconvenience, a lack of access and the high costs of sustainable options/
alternatives
Limited infrastructure and capacity for collection and sorting
Stage 3 A vulnerable and marginalised informal waste sector – not compensated or supported for their
collection services
COLLECTION A lack of separation-at-source or deposit-return schemes
A lack of information to empower consumers to reuse, refill and separate plastic correctly
The majority of plastics ever manufactured are not recyclable
A limited supply of quality plastic waste as input
Stage 4 A limited recycling infrastructure
TREATMENT Recyclable plastic not collected and still sent to landfills or leaking into nature
Some landfills still non-compliant, with open dumping and open burning of uncollected waste
Imports of plastic waste from other countries
Low profitability and high costs in the recycling sector and secondary markets for recycled
Stage 5 plastic
SECONDARY The price of virgin plastic competitive with the price of recycled plastic
MARKETS A lack of secondary markets for recycled plastic
Issues with the quality of recycled plastic, specifically for food-grade applications
System failures cutting across all life cycle stages
A lack of a common framing that outlines a clear, common vision for the plastics system, incorporating circular economy
principles; and common standards of action to combat plastic pollution, addressing the full life cycle impacts
A lack of accountability among stakeholders for the true life cycle cost of plastic, with a historic narrative skewed towards
blaming the consumer for plastic pollution
Weak or inadequate policy and regulatory frameworks, including limited capacity for enforcement and compliance
A lack of coordination among stakeholders across life cycle stages to ensure circular product and business model design
and material circulation and to prevent leakage
A skewed perception that the majority of actions to combat plastic pollution are failing because they merely address the
symptoms through clean-ups and waste management
A lack of technical capacity and understanding among all actors in the plastics value chain
A lack of monitoring and reporting on plastic volumes across the plastics life cycle stages
A lack of resources and investment into circular economy solutions
WWF PLASTIC POLLUTION IN AFRICA: IDENTIFYING POLICY GAPS AND OPPORTUNITIESSECTION 1 KEY FOCUS
10 PRIORITIES TO ADDRESS PLASTIC POLLUTION IN AFRICA
Based on the current system failures, the key priorities for addressing plastic
pollution systemically can be summarised in 10 key areas.
1. Adopt a common framing of the plastic pollution challenge with a
systems view, across the full plastics life cycle, within a circular economy
framework. This framing s should underpin the rationale behind policy
and legal frameworks and subsequent implementation plans.
2. Commit to a clear, continent-wide vision with common and
coordinated standards of actions, including agreed definitions,
sustainability standards and reporting methods, to adequately prepare for
the projected increase in plastic production and consumption in Africa and
the threat of increased imports of foreign plastic waste.
3. Create an enabling socio-economic environment for small,
medium-sized and micro-enterprises founded on circular economy
principles while leveraging opportunities to provide safe, decent jobs for
particularly vulnerable populations, including women and youth.
4. Ensure accountability throughout the system by developing
appropriate policy instruments and effective implementation to ensure
private sector accountability, and support investment into infrastructure
and solutions relevant for the country context.
5. Develop contextualised policy toolkits to support circular economy
interventions informed by regular, accurate and transparent data
monitoring and reporting on plastic material flows throughout the plastics
life cycle.
6. Prioritise actions to address current plastic leakage hotspots
based on best available data, using coordinated sector-based
approaches for the packaging, textile and fishing sectors. Also, encourage
targeted collaborative interventions to address product hotspots,
particularly drinking water containers (bottles and sachets), and
disposable PPE and nappies.
7. Mobilise resources linked to levies to support accountability within
the system, invest in circular economy interventions to design circular
products, infrastructure and technologies, and support the informal waste
sector.
8. Strengthen existing local production and manufacturing
capacity to adapt to circular economy product design and business
models, while prioritising non-toxic and low-carbon processes.
9. Build capacity across value chains and share knowledge about the
circular economy policy frameworks and solutions to comprehensively
address plastic pollution.
10. Launch and implement behaviour change programmes to
ensure that governments, businesses and citizens are aware, educated
and mobilised to support circular economy policies and interventions,
and to minimise the unintended consequences of false solutions such as
incineration, open burning and the indiscriminate use of alternatives to
conventional plastic, including biodegradable plastic.
17SECTION 2
PLASTIC POLLUTION
POLICY GAPS ACROSS AFRICA
Existing policy and legislation to adequately address plastic pollution in
Africa does not take a systemic, life cycle approach. Some of the major
limiting factors of existing policy and legislation may arise from the fact
that, historically, environmental protection policy focused solely on waste
management, one of the last stages of the plastics life cycle.
The end-of-life focus on waste hinders and legislation at a global, regional and and related issues such as marine
progress to address the root causes national level, linked to the plastics litter and pollution, the circular
of plastic pollution at the production life cycle failures outlined on page 16. economy and the blue economy.
(Stage 1) and usage (Stage 2) life cycle The aim is to uncover potential African countries that are parties or
stages. This is coupled with the fact that opportunities to close those policy gaps signatories to these frameworks are
the concepts of the circular economy so as to adequately address plastic expected to translate these laws to
and a life cycle approach are still vague. pollution in Africa. national level. The effectiveness of
It is also evident that policy frameworks national implementation depends
on what is outlined in the policy
INTERNATIONAL POLICY AND
or legislation is only as good as a
government’s capacity to enforce and framework as well as the country’s
LEGAL FRAMEWORKS
effectively implement its policies as capacity and resources to fulfil the
legislation, which in many cases is a requirements. Although voluntary
major issue in African countries. initiatives are useful, the current global
There are a number of international governance structure is fragmented and
This section explores the most policy frameworks that include ineffective to tackle the plastic pollution
significant gaps in policy frameworks measures to address plastic pollution challenge at the necessary pace and scale.
© Shutterstock / Elizaveta Galitckaia / WWF
WWF PLASTIC POLLUTION IN AFRICA: IDENTIFYING POLICY GAPS AND OPPORTUNITIESEXISTING GLOBAL GOVERNANCE FRAMEWORKS RELEVANT TO PLASTIC POLLUTION
1972: Convention on the Prevention of Marine Pollution by Dumping of Wastes and other Matter
(London Convention)
· Regulation requires parties to report dumping of plastic waste at sea by any vessels (ships) and aircrafts.
· No regulation of plastic waste leakage into nature from land-based activities that contribute to marine
pollution, nor of dumping in inland waters, rivers and estuaries.
· No compliance mechanism.
16 African countries have ratified the London Convention
1973/1978: International Convention for the Prevention of Pollution from Ships (MARPOL) Annex V
(entry into force in 1983)
· Annex V prohibits disposal of garbage, including plastic waste, from operational or accidental causes.
· Regulation only covers pollution from ships, not other sources.
· Compliance requirements differ for vessels depending on tonnage, the number of persons the vessel carries
and whether it is fixed or floating, and penalties are set according to each country.
· Exemptions include many fishing vessels, which are large contributors to pollution from ghost fishing gear.
36 African countries have ratified MARPOL Annex V
1982: UN Convention on the Law of the Seas (UNCLOS)
· A global agreement that establishes a legal framework for all marine and maritime activities.
· Countries are required to “adopt laws and regulations to prevent, reduce and control pollution” from land-
based sources and dumping. However, no detail is provided on how this should be done. As a result, separate
or supplementary arrangements are required to fill this gap, such as MARPOL and the London Convention.
· Encourages the establishment of global and regional rules, standards and recommended practices to achieve
the UNCLOS mandate, but does not provide these.
· General provisions prohibit dumping of waste in rivers and estuaries.
47 African countries have ratified and five have signed the Convention but fewer than half of
coastal countries have fully maximised their maritime zone benefits through UNCLOS, which compromises its
implementation (Surbun, 2021).
1992: Convention on Biological Diversity
· A global agreement that covers all aspects of biological diversity: the conservation of biological diversity,
sustainable use of its components and the fair and equitable sharing of benefits arising from genetic
resources.
· Aichi Biodiversity Target 8, adopted in 2010, called for the reduction in pollution that is detrimental to
ecosystem functioning and biodiversity by 2020, with particular focus on marine litter, including plastics.
This target was not achieved.
· Decision XIII/10, adopted in 2016, included voluntary guidelines for preventing and mitigating the impacts
of marine litter.
54 African countries have ratified, acceded to or accepted the Convention
timeline continues...
191992: Convention on the Control of Transboundary Movements of Hazardous Wastes and their
Disposal (Basel Convention)
· Aims to reduce the generation of hazardous and other waste, promote its environmentally sound
management and regulate its transboundary movements.
· The 2019 amendments extend the scope of the convention to incorporate certain categories of plastic waste.
· Data on the transboundary movements of hazardous waste in Africa is not readily available due to the lack of
reporting to the Convention Secretariat by African countries.
53 African countries have ratified or acceded to the Convention
CRITICAL AMENDMENTS TO THE BASEL CONVENTION
At its 14th Conference of the Parties (COP14) in 2019, the Basel Convention adopted amendments to three
annexes to incorporate certain categories of plastic waste under its scope. These included giving parties
the right to prohibit the import of plastic waste and to obtain prior written informed consent for the export
of plastic waste. The amendments provide exemptions from the obligations for uncontaminated plastic
waste, provided that it is “destined for recycling in an environmentally sound manner”. These exemptions
were added to avoid creating barriers to recycling. However, in the face of weak border enforcement
and corruption, these exemptions potentially provide a loophole to bypass the prohibitions, making
transboundary trade more prevalent. Countries are expected to implement the law nationally, but it is
unclear how many countries have already done so.
The Basel Convention COP14 also adopted a decision for further action on plastic waste, which included,
among others, updating the technical guidelines for plastic waste management and establishing a
partnership on plastic waste.
These amendments obtained great media coverage and were seen as a statement from the 187 member
countries to address the plastic pollution problem. Since then, the world has seen developing countries,
specifically the Philippines and Indonesia, sending back shipments of plastic waste to the countries of origin
including the USA, the UK and Australia (Ellis-Petersen, 2019).
1995: The UN Agreement for the Implementation of the Provisions of UNCLOS relating to the
Conservation and Management of Straddling Fish Stocks and Highly Migratory Fish Stocks
(UN Fish Stocks Agreement)
· Includes obligations for parties to minimise pollution, waste and abandoned gear (ghost fishing gear).
· Covers areas beyond national jurisdiction; however, the scope is limited to specific species, thus does not
cover all fishing activities resulting in ghost gear.
13 African countries have ratified or acceded to the Convention and seven have signed the
Convention
1996: Protocol to the London Convention (entry into force in 2006)
· Added a compliance mechanism to the London Convention.
· Introduced a “reverse list” of items that may be dumped at sea – plastic waste is not included and is
therefore prohibited from being dumped.
10 African countries have ratified the Protocol
1997: Convention on the Law of the Non-Navigational Uses of International Watercourses
(UN Watercourses Convention)
· Requires parties to take appropriate measures to prevent harm in international watercourses (e.g. rivers,
lakes or other surface water bodies that fall under the jurisdiction of two or more countries).
· This includes preventing, reducing and controlling pollution, which includes plastics.
13 African countries have ratified or acceded to the Convention
2001: Convention on Persistent Organic Pollutants (Stockholm Convention)
· Requires parties to implement measures to reduce or eliminate the release of persistent organic pollutants
(POPs), which are harmful to human health and the environment.
· This includes measures to restrict or eliminate the production, use and disposal of POP-based additives in
the manufacture of plastic products, and has relevance in the recycling, disposal and remanufacturing of
plastic products containing POPs.
53 African countries have ratified or acceded to the Convention
WWF PLASTIC POLLUTION IN AFRICA: IDENTIFYING POLICY GAPS AND OPPORTUNITIESYou can also read