Placebo response and effect in randomized clinical trials: meta-research with focus on contextual effects
←
→
Page content transcription
If your browser does not render page correctly, please read the page content below
Hafliðadóttir et al. Trials (2021) 22:493
https://doi.org/10.1186/s13063-021-05454-8
REVIEW Open Access
Placebo response and effect in randomized
clinical trials: meta-research with focus on
contextual effects
Sigurlaug H. Hafliðadóttir1,2 , Carsten B. Juhl2,3, Sabrina M. Nielsen1,4, Marius Henriksen5, Ian A. Harris6,7,8,
Henning Bliddal5 and Robin Christensen1,4*
Abstract
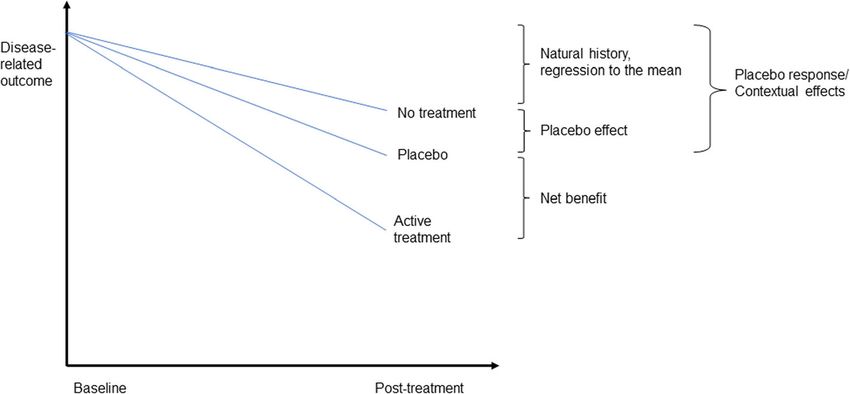
Background: Contextual effects (i.e., placebo response) refer to all health changes resulting from administering an
apparently inactive treatment. In a randomized clinical trial (RCT), the overall treatment effect (i.e., the post-
treatment effect in the intervention group) can be regarded as the true effect of the intervention plus the impact
of contextual effects. This meta-research was conducted to examine the average proportion of the overall
treatment effect attributable to contextual effects in RCTs across clinical conditions and treatments and explore
whether it varies with trial contextual factors.
Methods: Data was extracted from trials included in the main meta-analysis from the latest update of the
Cochrane review on “Placebo interventions for all clinical conditions” (searched from 1966 to March 2008). Only RCTs
reported in English having an experimental intervention group, a placebo comparator group, and a no-treatment
control group were eligible.
Results: In total, 186 trials (16,655 patients) were included. On average, 54% (0.54, 95%CI 0.46 to 0.64) of the overall
treatment effect was attributable to contextual effects. The contextual effects were higher for trials with blinded
outcome assessor and concealed allocation. The contextual effects appeared to increase proportional to the
placebo effect, lower mean age, and proportion of females.
Conclusion: Approximately half of the overall treatment effect in RCTs seems attributable to contextual effects
rather than to the specific effect of treatments. As the study did not include all important contextual factors (e.g.,
patient-provider interaction), the true proportion of contextual effects could differ from the study’s results. However,
contextual effects should be considered when assessing treatment effects in clinical practice.
Trial registration: PROSPERO CRD42019130257. Registered on April 19, 2019.
Keywords: Placebo response, Placebo effect, Contextual effects, Proportional contextual effect
* Correspondence: Robin.Christensen@regionh.dk
1
Section for Biostatistics and Evidence-Based Research, the Parker Institute,
Bispebjerg and Frederiksberg Hospital, Nordre Fasanvej 57, DK-2000
Copenhagen F, Denmark
4
Research Unit of Rheumatology, Department of Clinical Research, University
of Southern Denmark, Odense University Hospital, Odense, Denmark
Full list of author information is available at the end of the article
© The Author(s). 2021 Open Access This article is licensed under a Creative Commons Attribution 4.0 International License,
which permits use, sharing, adaptation, distribution and reproduction in any medium or format, as long as you give
appropriate credit to the original author(s) and the source, provide a link to the Creative Commons licence, and indicate if
changes were made. The images or other third party material in this article are included in the article's Creative Commons
licence, unless indicated otherwise in a credit line to the material. If material is not included in the article's Creative Commons
licence and your intended use is not permitted by statutory regulation or exceeds the permitted use, you will need to obtain
permission directly from the copyright holder. To view a copy of this licence, visit http://creativecommons.org/licenses/by/4.0/.
The Creative Commons Public Domain Dedication waiver (http://creativecommons.org/publicdomain/zero/1.0/) applies to the
data made available in this article, unless otherwise stated in a credit line to the data.Hafliðadóttir et al. Trials (2021) 22:493 Page 2 of 15 Background effects [12]. While the net benefit remains an important The importance of patients’ expectations, emotions, and goal for any randomized trial, a shift in focus to the clinical context in medical practice should not be ig- overall benefit and the PCE would mitigate the efficacy nored, but their impact on health care outcomes has paradox and highlight the contribution of contextual ef- only recently been evaluated [1–6]. Patients’ expecta- fects, both in research and clinical practice. tions and memories, the place in which the treatment is Our primary objective of this meta-epidemiological delivered, and the interaction between the patient and study was to examine the average proportion of the provider are just some of many factors in a “therapeutic overall treatment effect that may be explained as con- environment” that can affect the treatment outcome [7, textual effects, in an attempt to address the aforemen- 8] and are linked to the placebo response [1, 7]. tioned “efficacy paradox” [10, 11]. Our secondary The Society for Interdisciplinary Placebo Studies de- objective was to examine whether the contextual effects fines placebo effects as changes specifically attributable differ for different contextual factors; i.e., factors related to placebo mechanisms (e.g., the neurobiological and to study design, type of intervention, and patients in- psychological mechanisms of expectations), whereas pla- cluded. Our third objective was to explore the associ- cebo response refers to all health changes resulting from ation between the contextual effects and placebo effect. administering an inactive treatment, including regression towards the mean and natural course of the disease [9]. Methods Hence, the placebo response includes the placebo effect Study selection, assessment of eligibility criteria, data ex- and is also referred to as contextual effects; see Fig. 1. traction, and statistical analysis were performed based Because any positive health change is of importance to on a predefined protocol (PROSPERO registration no. patients, clinicians should acknowledge both the placebo CRD42019130257, Additional file 1), in accordance with effect (i.e. in research) and the placebo response (i.e. in the methodology guidelines from Cochrane. The find- practice). In clinical trials, the difference between the ings are reported according to the Preferred Reporting group receiving the experimental intervention and the Items for Systematic reviews and Meta-Analysis (PRIS placebo (comparator) group indicates the strength of the MA) statement [13] (Additional file 2). active treatment (i.e., net benefit). By looking only at the difference between these two groups, the clinical impact Data sources and searches of the placebo response (i.e., the contextual effects) gets Only trials included in the latest update of the Cochrane overlooked [10]. This omission can result in an ‘efficacy review “Placebo interventions for all clinical conditions” paradox’—a discrepancy between treatment effects re- by Hróbjartsson and Gøtzsche [14] were considered eli- ported in randomized clinical trials (RCTs), and the gible, and therefore, no new literature search was per- overall treatment effect experienced by patients and ob- formed [15, 16]. served in clinical practice [11]. Contextual effects have been quantified by using the Study selection proportional contextual effect (PCE)—the proportion of Only randomized trials having an experimental interven- the overall treatment effect attributable to contextual tion group, a placebo comparator group, and a no- Fig. 1 Explanatory diagram illustrating the contribution of the placebo effect and placebo response relative to the estimated effect of active treatment
Hafliðadóttir et al. Trials   (2021) 22:493                                                                   Page 3 of 15

treatment (control) group were considered eligible. As in     concealment of allocation, (ii) dropout rate no more
the original meta-analysis [14, 17], participants were pa-    than 15%, and (iii) inclusion of at least 50 patients.
tients with any somatic or psychiatric disease or symp-
toms. Besides the exclusion criteria described in detail in
                                                              Summary measures
the Cochrane review [14], trials without an intervention
                                                              Proportional contextual effect (PCE)
group and trials written in languages other than English
                                                              For each trial, the PCE was calculated by dividing the
were excluded.
                                                              improvement in the placebo control group (ΔmC) by the
                                                              improvement in the experimental intervention (ΔmI)
Data collection process and data items
                                                              group (i.e., PCE=ΔmC/ΔmI) [19]. For trials with continu-
A data-extraction form was developed for data collec-
                                                              ous outcomes, the improvement was defined as the
tion. One reviewer (S.H.H.) extracted data and selected
                                                              mean change from baseline in the group, in the unit of
the outcome of interest based on the description in the
                                                              standard deviation (SD). For trials with binary outcomes,
Cochrane review [14]. A second reviewer (R.C) was con-
                                                              improvement was defined as the number of participants
sulted when necessary, and doubts were discussed to
                                                              improved in each group (placebo: nC, and intervention:
consensus. The extracted data included the year of pub-
                                                              nI), divided by the number of participants randomized to
lication, study design, number of participants random-
                                                              that particular group (NC and NI). For trials with more
ized and analyzed, baseline characteristics (average age,
                                                              than one relevant experimental intervention group (or
proportion of women, diagnosis, chronic or non-chronic
                                                              placebo group), where all arms were relevant, treatment
condition), time of outcome measurement, type of pla-
                                                              groups were combined into one group by calculating a
cebo (pharmacological, physical, or psychological), ex-
                                                              weighted mean prior to perform the meta-analysis tech-
perimental and no-treatment intervention and primary
                                                              niques. The PCE ratio was loge-transformed to
outcome.
                                                              normalize the distribution for the analysis and back-
   Further, the type of outcome was categorized in (i)
                                                              transformed for reporting. Theoretically, the PCE should
patient-reported outcomes (e.g., pain); (ii) observable
                                                              range from 0 to 1, where 0 indicates no contribution
patient-reported outcomes (e.g., vomiting); (iii)
                                                              from contextual effects while 1 indicates 100% contribu-
observer-reported outcomes dependent on cooperation
                                                              tion from contextual effects [10].
of the patient (e.g., forced expiratory volume); (iv)
                                                                In trials with continuous outcomes, where either the
observer-reported outcomes not dependent on patient
                                                              intervention or placebo group showed no improvement
cooperation (e.g., blood pressure); and (v) laboratory
                                                              (change score = 0) or worsening (negative score) from
data (e.g., hemoglobin concentration). Other extracted
                                                              baseline, a miniscule effect (i.e., 1% benefit [multiplying
information included dropout rate; blinding of partici-
                                                              by 1.01]) was imputed to enable estimation of the ratio
pants, providers, and observers; allocation concealment;
                                                              (rather than excluding the trial from the primary ana-
settings (i.e., single-center or multicenter); and informa-
                                                              lysis). In trials with binary outcomes, where no partici-
tion given to participants (i.e., whether participants were
                                                              pants improved in the placebo group, it was not possible
informed that the trial involved a placebo intervention).
                                                              to log-transform the PCE. In these cases, we applied a
End-of-treatment data were preferred over follow-up
                                                              “modified Woolf approach” where 0.5 was added to all
data to reduce bias due to patients leaving the primary
                                                              cells as if 0.5 participant had improved and correspond-
trial and effects consequentially diminishing. Change
                                                              ing 0.5 participant had worsened, making it possible to
from baseline was preferred, but if only final values were
                                                              include the trial in the primary quantitative synthesis.
available, these were used. For crossover trials, data were
extracted from the first treatment period only, to avoid
any carry-over effect. If that was not possible, summary      Placebo effect in Cochrane review
data were used (naively) as if they had been derived from     For our third objective, exploring the association be-
a parallel-group trial.                                       tween the PCE and placebo effect, we used the estimates
                                                              directly from the Cochrane review [14], odds ratio (OR)
Risk of bias in individual studies                            for binary outcomes, and standardized mean difference
Risk of bias of the included studies was assessed and         (SMD) for continuous outcomes—estimated by compar-
compared to those from the original Cochrane review           ing the placebo comparator group and the no treatment
[14]. This approach enabled us to rate the risk of bias in    control group. As a second step, in order to enable a
domains from the Cochrane Risk of Bias tool [18] as           meta-analytic combination of results, these placebo ef-
High, Low, or Unclear risk. In addition, a simple risk-of-    fect results were converted from OR to SMD. This con-
bias assessment proposed in the Cochrane review [14]          version was done by converting the ln(OR) to the
                                                                                                          pffiffiffi
was used, where trials with low risk of bias were defined     corresponding SMD, dividing by 1.81 (i.e.,π= 3), as sug-
as fulfilling the three following criteria: (i) adequate      gested by Chinn [20].
Hafliðadóttir et al. Trials (2021) 22:493 Page 4 of 15 Data synthesis and analysis placebo effect (i.e., SMD), as reported in the Cochrane A Restricted Maximum Likelihood (REML) mixed- review [14]. Small-study bias was examined using a fun- effects model was applied to combine the loge(PCEs) nel plot and Egger’s test [22]. Furthermore, based on the across trials. To evaluate the degree of heterogeneity, the various risk-of-bias assessments for each trial, pre- I2 index was estimated describing the percentage of total specified exploratory sensitivity analyses were conducted variation attributable to heterogeneity [21]. in order to assess whether possible biases could affect As outlined in the protocol, a number of pre-specified the estimates. Trial characteristics, such as overall risk of stratified analyses were performed: (i) time of outcome bias, sample size [23], and trial settings (single-center or measurement, (ii) type of intervention, (iii) type of out- multicenter trial) [24], were further used in the pre- come, (iv) blinding of participants and treatment pro- specified analyses to evaluate possible bias across studies. viders, (v) blinding of outcome assessor, (vi) allocation P values were obtained as part of the meta-regression concealment, (vii) risk of bias, (viii) information to par- analysis; i.e., based on F tests if more than two groups ticipants, and (ix) trial settings. Furthermore, the pa- were compared and t tests if only two groups were com- tient’s condition (i.e., chronic or non-chronic) was pared. All statistical tests were performed using STATA/ assessed at trial-level (based on the trial’s eligibility IC 15.1 (Stata Corp LLC, TX, USA). criteria). Meta-regression analysis (REML models) was con- Results ducted involving covariates at trial-level to investigate Search results whether individual covariates could explain heterogen- All 202 trials included in the main analysis of the eity (i.e., reduce variability) of the PCE among studies. Cochrane review by Hróbjartsson and Gøtzsche [14] These variables were (i) patient age, (ii) proportion of fe- were screened for inclusion (Fig. 2). Five trials [25–29] males, (iii) sample size, and (iv) year of publication. A were not in English. The remaining 197 trials were read meta-regression analysis was also performed to investi- in full text, of which 7 trials [30–36] did not meet the in- gate the association between PCE and the corresponding clusion criteria. Relevant outcome data were not Fig. 2 Flow diagram of study selection criteria.aTrials where either intervention or placebo group showed no improvement or got worse, requiring adjustment in the form of imputation of a small treatment effect
Hafliðadóttir et al. Trials   (2021) 22:493                                                                     Page 5 of 15

accessible in 4 trials [37–40], leaving 186 trials for inclu-   Proportional contextual effect
sion in the meta-analysis.                                      As illustrated in Additional file 4, there was a consider-
                                                                able degree of heterogeneity across PCE’s from various
Included studies                                                trials (I2=93.6). The pooled PCE across all 186 trials cor-
The included trials were conducted in 23 countries and          responded to 54% of the observed effect (0.54, 95%CI
published between 1961 and 2008, with the majority              0.46 to 0.64). There was statistically significantly higher
published after 1994. There were 11 crossover trials            PCE in trials with pharmacological and physical inter-
[41–51], of which 10 (total of 250 patients) had no data        ventions, compared to psychological, and PCE was non-
available from the first period only, and thus were han-        significantly higher for patient-involved outcomes (pa-
dled as parallel trials by using summary data (ignoring         tient-reported outcomes and observer-reported out-
the design). There were 54 trials (total of 5,160 patients)     comes dependent on patient cooperation). Trials where
having more than three arms. In 18 of those [52–69],            patients were not informed that the study involved pla-
one or more additional arms were disregarded (a total of        cebo had non-significantly higher PCE. Trials with bin-
796 patients) in order to calculate the PCE for groups          ary outcomes had statistically non-significant, but
that had comparable interventions. In the remaining 36          potentially higher PCE’s compared to trials with con-
trials with more than three arms, all arms were relevant        tinuous outcomes. None of these factors, however, ex-
and therefore included which left a total number of             plained much of the observed heterogeneity. Publication
16,655 patients for the meta-analysis.                          year and sample size did not have any effect on hetero-
   Trial characteristics are summarized in Table 1. The         geneity either, and no association was found with PCE
mean age of participants ranged from 0 (infants) to 83.8        (see Additional file 5). There was a significant associ-
years, with an average mean age of 39.9 years (age was          ation between PCE and mean age and percentage of fe-
not reported in 11 trials). The percentage of females           males, where PCE decreased with higher mean age of
ranged from 0 to 100, with mean percentage of 58.6 (fe-         participants (slope = 0.986; 95%CI 0.976 to 0.995) and
male/male proportions was not reported in 23 trials). Pa-       increased with higher percentage of females (slope =
tients included in the trials had a broad spectrum of           1.006; 95%CI 1.000 to 1.012). However, only the propor-
conditions, such as depression, hypertension, obesity, or       tion of females in the trial populations seemed to explain
headaches. Pain was the most common outcome meas-               some of the between-study variance (reduction in τ2 =
ure (reported in 53 trials). Other frequent measures were       14.1%, I2 = 92.5); see Table 2.
for anxiety, medication use, smoking cessation, and nau-           Neither patient’s condition/diagnosis (e.g., fibromyal-
sea. Interventions were categorized into three types:           gia, cancer, smoking; increase in τ2 = 4.5%, I2 = 93.8)
pharmacological (e.g., medication or supplements given          nor outcome domain (e.g., pain, nausea, smoking cessa-
orally or via injection/inhalation), physical (e.g., acu-       tion; increase in τ2 = 0.7%, I2 = 93.5) was an important
puncture or transcutaneous electrical nerve stimulation),       factor in reducing the between-study variance. However,
and psychological (e.g., cognitive therapy or hypnosis).        whether the condition was chronic or not reduced
In 22 trials, patients were not informed that the study         between-study variance slightly (slope = 0.69; 95%CI
involved placebo. There were 97 single-center trials and        0.49 to 0.96; reduction in τ2 = 3.0%); chronic conditions
33 multicenter trials (unclear in 56 studies). Explicit trial   had a significantly lower PCE.
characteristics are presented in Additional file 3.
                                                                Proportional contextual effects and placebo effect
Risk of bias within studies                                     As illustrated in Fig. 3, there was an association between
Methodological characteristics were assessed by Hrób-           PCE and the corresponding placebo effect, estimated as
jartsson and Gøtzsche [14] and are listed in detail in the      SMD and reported in the Cochrane review [14], where
original Cochrane review. In summary, adequate se-              PCE increased with an increasing placebo effect (slope =
quence generation was reported in 39 trials (21%); 28 tri-      1.55; 95%CI 1.07 to 2.24).
als (15%) reported adequate concealment of allocation;
59 trials (32%) were judged to have adequate blinding of        Risk of bias across studies
patients and providers; and 81 trials (44%) to have ad-         The risk of small-study bias across trials was assessed
equate blinding of outcome assessor. Overall, 81 trials         using funnel plot, followed by Egger’s test [22]. The fun-
(44%) had a sample size of at least 50 patients, and 80         nel plot was asymmetrical (Fig. 4), which Egger’s test
trials (43%) had a dropout rate of 15% or lower. Follow-        confirmed (p < 0.001). Small studies tended to show
ing the simple risk-of-bias assessment proposed in the          smaller PCE. Furthermore, the funnel plot showed a ver-
Cochrane review, 16 trials [70–85] (9%) fulfilled all three     tical line of points (ln[PCE] = − 4.6) that indicated the
criteria and were therefore judged as having low risk of        trials where either the intervention group or the placebo
bias among the included trials.                                 group showed no improvement or got worse, requiring
Hafliðadóttir et al. Trials (2021) 22:493 Page 6 of 15 Table 1 Summary of trial characteristics Characteristic Trials (k = 186) Number of patients 16,655 Proportion of women (SD) 58.6 (28.6) Mean age, years (SD) 39.9 (17.1) Condition Abortion, n (%) 3 (1.6) Anxiety, n (%) 3 (1.6) Asthma, n (%) 3 (1.6) Cancer, n (%) 5 (2.9) Dementia, n (%) 3 (1.6) Depression, n (%) 9 (4.8) Fibromyalgia, n (%) 3 (1.6) Headache, n (%) 8 (4.3) Hypertension, n (%) 7 (3.8) Insomnia, n (%) 5 (2.9) Low back pain, n (%) 3 (1.6) Obesity, n (%) 8 (4.3) Osteoarthritis, n (%) 5 (2.9) Phobia, n (%) 3 (1.6) Schizophrenia, n (%) 3 (1.6) Smoking, n (%) 9 (4.8) Surgery/procedure, n (%) 45 (24.2) Othera, n (%) 61 (32.8) No. center Single, n (%) 97 (52.1) Unclear, n (%) 56 (30.1) Multi, n (%) 33 (17.7) Type of intervention Psychological, n (%) 62 (33.3) Pharmacological, n (%) 56 (30.1) Physical, n (%) 68 (36.6) Study duration < 4 weeks, n (%) 83 (44.6) 4 to 8 weeks, n (%) 44 (23.7) 8 to 12 weeks, n (%) 27 (14.5) > 12 weeks, n (%) 32 (17.2) Outcome domain Anxiety, n (%) 9 (4.8) Depression, n (%) 10 (5.4) Diastolic blood pressure, n (%) 7 (3.8) Medication use, n (%) 9 (4.8) Nausea, n (%) 9 (4.8) Pain, n (%) 53 (28.5) Sleep disturbance, n (%) 6 (3.2) Smoking cessation, n (%) 9 (4.8)
Hafliðadóttir et al. Trials     (2021) 22:493                                                                                          Page 7 of 15

Table 1 Summary of trial characteristics (Continued)
Characteristic                                                                                                                      Trials (k = 186)
    Weight, n (%)                                                                                                                   8 (4.3)
    Otherb, n (%)                                                                                                                   66 (35.5)
High risk, n (%)                                                                                                                    170 (91.4)
a
Conditions investigated in less than three trials, bOutcomes reported in less than three trials

adjustment in the form of the described imputation of a                              overall low risk of bias, but only the blinding of outcome
small treatment effect. For sensitivity, when comparing                              assessor resulted in significantly higher PCE (slope =
the fixed-effect estimate for the PCE to the random-                                 1.22; 95%CI 1.03 to 1.44). The significantly higher PCE
effects estimate, the PCE increased from 0.54 (95%CI                                 in trials of non-chronic conditions diminished and was
0.46 to 0.64) to 0.82 (95%CI 0.80 to 0.83). This indicates                           no longer significant. None of these factors were import-
a discrepancy between random and fixed-effect models.                                ant in explaining the between-study variance. Neither
However, a subsequent visual inspection of the funnel                                sample size, publication year, whether trials had binary
plot did not indicate an important small study bias.                                 or continuous outcomes, mean age of participants, nor
  When conducting the pre-specified sensitivity analyses                             percentage of females seemed to have any effect on het-
according to the risk-of-bias assessment, the blinding of                            erogeneity, and no association was found with PCE in
the outcome assessor was the most important factor, be-                              the sensitivity analyses.
ing associated with a significantly higher PCE. Further-                                For the sensitivity analysis of the association between
more, the PCE was significantly higher in trials with                                PCE and placebo effect, an additional five trials with bin-
concealed allocation, and there was a non-significant in-                            ary outcomes were excluded because in these trials, no
creased PCE in trials with an overall low risk of bias.                              improvement was seen in the no-treatment group. In
Neither trial setting (single-center or multicenter) nor                             order to be eligible for inclusion in the synthesis, these
sample size had an important effect on PCE or explained                              trials needed adjustment (0.5 added to each cell of the 2
much of the reported heterogeneity, with blinding of                                 × 2 table) prior to calculating the OR, and afterwards
outcome assessor apparently being the most important                                 SMD. The association found earlier between PCE and
factor (reduction in τ2 = 5.8%).                                                     placebo effect diminished and was non-significant after
  What influenced the heterogeneity the most were the                                the exclusion of all 23 trials that needed adjustment.
18 trials [41, 46, 48, 86–100] (including 890 patients)                              The association between PCE and placebo effect (SMD)
where either the intervention or placebo group showed                                for the sensitivity analysis is illustrated in Fig. 5.
no improvement or got worse; these trials required im-                                  A new funnel plot and Egger’s test was conducted for
puting a very small treatment effect in order to calculate                           the remaining 163 trials in the sensitivity analysis, which
PCE so they could be included in the meta-analysis (re-                              also resulted in an asymmetrical funnel plot (Additional
duction in τ2 = 80.6%, I2 = 84.4). Due to this imputation                            file 7; Egger´s test, p < 0.001), suggesting that small stud-
technique, a sensitivity analysis was performed where                                ies report smaller PCE.
the aforementioned 18 trials were excluded.
                                                                                     Discussion
Sensitivity analysis                                                                 Summary of the evidence
A meta-analysis of the remaining 168 studies (total of                               This study shows, based on 186 trials, that the majority
15,765 patients) resulted in PCE of 0.72 (95%CI 0.67 to                              (average PCE: 54%) of the overall treatment effect of di-
0.79), τ2 = 0.2080, and a slightly lower heterogeneity (I2                           verse interventions across conditions was attributable to
= 85.7). Many of the trends apparent in the main ana-                                contextual effects. Several contextual factors and trial
lysis (e.g., higher PCE in trials with concealed allocation)                         characteristics were found to impact the observed vari-
diminished or disappeared (see Additional file 6). Ten of                            ation in PCE. The factors that increased the PCE, and
the 18 excluded trials had psychological interventions                               thus are potentially valuable, were adequate allocation
[87–90, 92, 93, 95, 97, 99, 100], which led to a radical                             concealment, blinded outcome assessor, lower mean age
shift in PCE for the remaining trials with psychological                             of participants, higher proportion of females, larger pla-
interventions. This shift in PCE, in turn, led to a non-                             cebo effect, and trials of non-chronic conditions. As an-
significantly higher PCE in trials with physical interven-                           ticipated the PCE was higher in trials with low risk of
tions compared to pharmacological and psychological                                  bias and using patient-reported outcomes. The propor-
interventions. The PCE was still higher in trials with                               tion of females was the only pre-specified covariate that
concealed allocation, blinded outcome assessor, and                                  significantly reduced the between-study variance; other
Hafliðadóttir et al. Trials (2021) 22:493 Page 8 of 15 Table 2 Results from random-effect meta-analysis and meta-regression analysis Study characteristic Trials (k) Patients (n) PCE (95% CI) τ2 I2 P Overall (REML) 186 16,655 0.54 (0.46 to 0.64) 1.027 93.6 Overall (REML, sensitivity analysis) 168 15,765 0.72 (0.67 to 0.79) 0.208 85.7 Overall (D-L random) 186 16,655 0.59 (0.54 to 0.65) 0.253 Overall (Fixed) 186 16,655 0.82 (0.80 to 0.83) 0.253 Allocation concealment 1.005 93.6 0.024 Clearly concealed 28 4322 0.82 (0.55 to 1.21) Not clearly concealed 158 12,333 0.50 (0.41 to 0.59) Blinding of patients and providers 1.034 93.6 0.451 Clearly a double-blind design 59 6477 0.62 (0.46 to 0.84) Clearly not a double-blind design 97 8275 0.49 (0.39 to 0.62) Unclear 30 1903 0.55 (0.37 to 0.82) Blinding of outcome assessor 0.967 93.5 0.002 Clearly stated that outcome assessor was blinded 81 7614 0.72 (0.56 to 0.91) Not stated that outcome assessor was blinded 105 9041 0.43 (0.34 to 0.54) Low risk of bias 1.016 93.6 0.084 Clearly concealed allocation, dropout rate ≤15%, sample size > 49 16 3360 0.83 (0.50 to 1.40) Criteria not fulfilled 170 13,295 0.51 (0.43 to 0.61) Information to participants 1.029 93.6 0.477 Not informed that trial involved placebo 22 2150 0.64 (0.39 to 1.03) Informed that trial involved placebo or not stated 164 14,505 0.53 (0.44 to 0.63) Time of outcome measurement 1.029 93.6 0.578 < 4 weeks 83 6422 0.60 (0.47 to 0.76) 4–8 weeks 44 2614 0.55 (0.38 to 0.78) > 8–12 weeks 27 2597 0.42 (0.27 to 0.65) > 12 weeks 32 5022 0.50 (0.34 to 0.75) Type of intervention 1.005 93.4 0.026 Pharmacological 56 6523 0.61 (0.45 to 0.82) Physical 68 6649 0.64 (0.50 to 0.83) Psychological 62 3483 0.38 (0.28 to 0.52) Type of outcome 1.029 93.7 0.523 Patient-reported outcomes that are observable 42 3605 0.59 (0.41 to 0.84) Patient-reported outcomes that are non-observable 88 7987 0.57 (0.45 to 0.72) Observer-reported outcomes dependent on patient cooperation 25 1143 0.53 (0.34 to 0.83) Observer-reported outcomes that were not dependent on patient cooperation 22 1314 0.42 (0.24 to 0.74) Laboratory outcomes 9 2606 0.31 (0.14 to 0.68) Settings 1.041 93.6 0.890 Single center 97 5268 0.54 (0.42 to 0.68) Multicenter 33 7394 0.51 (0.35 to 0.73) Unclear 56 3993 0.57 (0.42 to 0.78) Patient´s condition 0.996 93.4 0.028 Chronic condition 119 9771 0.47 (0.38 to 0.58) Non-chronic condition 67 6884 0.68 (0.52 to 0.88) Type of outcome 1.015 93.6 0.083 Binary outcome 39 5654 0.71 (0.50 to 1.01)
Hafliðadóttir et al. Trials      (2021) 22:493                                                                                                        Page 9 of 15

Table 2 Results from random-effect meta-analysis and meta-regression analysis (Continued)
Study characteristic                                                                     Trials (k)   Patients (n)    PCE (95% CI)          τ2        I2       P
  Continuous outcome                                                                     147          11,001          0.50 (0.42 to 0.60)
Sample sizea                                                                                                                                1.028     93.6     0.199
  ≤ 70 participants                                                                      93           2893            0.48 (0.37 to 0.61)
  ≥ 71 participants                                                                      93           13,762          0.60 (0.48 to 0.74)
Publication year                                                                                                                            1.02      93.5     0.116
  Published before 2000                                                                  120          8961            0.49 (0.39 to 0.60)
  Published in 2000 or later                                                             66           7694            0.64 (0.49 to 0.83)
Meta-regression of continuous variables                                                  Trials (k)   Patients (n)    Slope (95% CI)        τ2        I2       P
Publication year                                                                         186          16,655          1.00 (0.98 to 1.02)   1.035     93.58    0.989
Sample size                                                                              186          16,655          1.00 (1.00 to 1.00)   1.026     93.54    0.162
Mean age                                                                                 175          15,538          0.99 (0.98 to 0.99)   1.048     93.86    0.004
Percentage of females                                                                    163          15,259          1.01 (1.00 to 1.01)   0.8824    92.54    0.044
Placebo effect (SMD)                                                                     186          16,655          1.55 (1.07 to 2.24)   1.005     93.51    0.027
k, number of trials; n, number of patients analyzed; τ2, estimate of between-study variance; I2, variation in PCE attributable to heterogeneity, estimated by random-
effect subgroup analysis
a
 Sample size analyzed by dividing the trials in two groups, 70.5 (the median) being the cut-point

factors had only minimal impact on the between-study                                mean age, percentage of females, or placebo effects,
variance.                                                                           respectively.
  The sensitivity analysis showed insignificant vari-                                 Our findings support those reported in earlier PCE
ation of PCE for the most part; only blinding of out-                               study by Zou et al. [12], who also found larger PCE in
come assessor remained significant. No factors were                                 studies with concealed allocation. Neither study could
found to significantly reduce the between-study vari-                               explain, however, whether this is due to greater context-
ance, and no association was found between PCE and                                  ual effects or smaller experimental (intervention group)

  Fig. 3 Meta-regression plot illustrating the association between the PCE and the placebo effect (SMD). Larger SMD indicates a larger placebo
  effect. (k = 186). PCE, proportional contextual effect; SMD, standardized mean difference
Hafliðadóttir et al. Trials    (2021) 22:493                                                                                            Page 10 of 15

                                                                             PCE studies. The overall PCEs reported in previous
                                                                             studies are similar to the findings from the present sen-
                                                                             sitivity analysis (75% in osteoarthritis and 60% in fibro-
                                                                             myalgia compared to 72% in the present study). Zou
                                                                             et al. [12] reported the lowest PCE for treatments deliv-
                                                                             ered with oral medications and higher PCE for treat-
                                                                             ments delivered via physical means and needles/
                                                                             injections. In the present sensitivity analysis, there was
                                                                             also insignificantly higher PCE in physical interventions
                                                                             compared to pharmacological. The categories in this
                                                                             study, however, cover a broader range of interventions
                                                                             than the categories used by Zou et al. [12]; nevertheless,
                                                                             our study generally corroborates earlier findings. We
  Fig. 4 Funnel plot of all trials included in the main meta-analysis (k
                                                                             found that there was a direct association between PCE
  = 186). The vertical line shows the average effect size. The median        and the placebo effect reported in the Cochrane review
  SE(ln[PCE]) is 0.27; i.e., SE(ln[PCE]) larger than this are “smaller       [14]. This association, however, was not apparent in the
  studies.” PCE, proportional contextual effect                              sensitivity analysis, meaning that the PCE was constant
                                                                             even though the placebo effect diminished.
effects. Also, our findings support those found by White-                       There are several similarities between the findings in
side et al. [19], who reported an increase in PCE with                       the Cochrane review [14] and the findings in this study.
higher proportions of females. There are, however, two                       The Cochrane review reported a larger placebo effect in
crucial differences between this study and previous PCE                      trials with patient-reported outcomes, in trials where pa-
studies. First, the two previous studies examined a single                   tients were falsely informed that no placebo was in-
condition, (osteoarthritis [12] and fibromyalgia [19]),                      volved in the study, and in trials with concealed
where the primary outcome was pain. Second, both                             allocation. Similar results were seen in the sensitivity
studies excluded trials where one or more groups did                         analysis in the present study, where trials with patient-
not improve or even worsened. Due to these exclusions,                       reported outcomes suggested a higher PCE compared to
it might be more appropriate to compare the findings                         outcomes not dependent on patient involvement. Trials
from the sensitivity analysis in this study to the previous                  with concealed allocation had significantly higher PCE in

  Fig. 5 Meta-regression plot. Meta-regression plot, illustrating association between the PCE and the placebo effect (SMD) after exclusion of the 23
  trials that needed adjustment prior to analysis. Larger SMD indicates a larger placebo effect (k = 163). PCE, proportional contextual effect
Hafliðadóttir et al. Trials (2021) 22:493 Page 11 of 15
the main analysis but not in the sensitivity analysis. studies excluded such trials because the measure of PCE
These similarities between PCE and placebo effect re- does not allow negative values when the ratio is log-
ported in the Cochrane review indicate that the differ- transformed, and worsening in a group could indicate
ence between the improvements seen in the intervention side/nocebo effect, which is not the focus of interest for
and placebo groups is less prominent in studies with a the PCE [12]. However, we viewed the exclusion of stud-
large placebo effect. ies that did not fit to the pre-specified hypothesis as a
source of bias; we therefore decided to add a miniscule
Limitations effect to the groups that had not improved, in order to
A major limitation of this study was the inclusion of be able to perform the necessary calculations. This was
studies with high risk of bias, mainly due to lack of se- the case for 17 trials with continuous outcomes and one
quence generation and allocation concealment in 79% trial with binary outcomes. Afterwards, it was clear these
and 85% of trials, respectively. Only 16 trials (9%) out of 18 trials had great impact on the results, and it was
186 fulfilled all three predefined criteria for low risk of questionable whether this kind of adjustment was opti-
bias. An updated literature search may have added more mal for retaining the trials in our study.
studies at low risk of bias, as the majority of the included
trials did not describe factors such as sequence gener- Conclusion
ation and allocation concealment adequately. Since there This study suggests that at least half of the overall treat-
were trends for higher PCE in trials with a low risk of ment effect observed in clinical trials across conditions
bias this could have affected the outcomes. Furthermore, is attributable to contextual effects rather than to the
the meta-analytic methods used did not allow for specific experimental intervention on trial. Factors such
patient-and clinical-related variables changes over time. as blinding of outcome assessor, concealed allocation,
Many changes in the patient populations could be expe- lower mean age, and higher proportion of females had
rienced in 47 years. the most impact on the PCE. This analysis in our study
This study correlates with previous studies of bias, did not include all known important contextual factors
reporting that bias due to unblinded assessor or inad- (e.g., patient’s expectations), so the true proportion of
equate allocation concealment tends to overestimate contextual effects could have been underestimated. The
treatment effect [101–103]. Furthermore, a small-study association between PCE and methodological quality
bias was detected, whereby small-sample studies report (lower risk of bias) indicates that the true PCE may be
smaller PCE. Based on the presence of small-study bias, higher than estimated. These findings highlight the im-
and that studies with a lower risk of bias tended to have portance of contextual effects in clinical practice and
higher PCE, the PCE reported in this study could have their large impact on patient care. In reporting of RCTs,
been underestimated. it is important to not only focus on the net benefit of a
As described above, there was a considerably high de- treatment but also to consider the PCE when translating
gree of heterogeneity, which may have affected our findings from clinical trials to clinical practice. The find-
study’s outcomes. Although subgroup analyses were car- ings could encourage health care professionals to con-
ried out, the heterogeneity remained high, and no factors sider potentially modifiable contextual factors, such as
were able to explain the heterogeneity, except for the 18 their patient-provider interaction, in any attempt to en-
trials that needed adjustment prior to analysis. Further- hance the overall treatment response to interventions.
more, not all the important contextual factors were in- Contextual effects are important contributors to the
cluded in the model. This could lead to uncontrolled overall treatment effect and should be embraced in both
confounding in the meta-analytic study, leading to clinical trials and practice for their potential benefits to
biased effect estimates. Thus, the conclusions claimed in patients.
this article could be incorrect. A more in-depth sensitiv-
ity analysis would have been helpful to assess the magni- Abbreviations
tude of these biases. However, many contextual factors OR: Odds ratio; PCE: Proportional contextual effect; PRISMA: Preferred
Reporting Items for Systematic reviews and Meta-AnalysesRCTRandomized
that are known to be important, such as the patient- clinical trialREMLRestricted Maximum Likelihood; SMD: Standardized mean
provider interaction and patient’s expectations, were not difference95% CI95% confidence interval
considered because these factors are rarely reported in
RCTs. Supplementary Information
In contrast to earlier PCE studies, we decided to also The online version contains supplementary material available at https://doi.
include trials where either the intervention or placebo org/10.1186/s13063-021-05454-8.
group showed no improvement or even worsened (i.e.,
Additional file 1. Protocol.
where the PCE became negative). That decision might
Additional file 2. PRISMA Checklist.
have been both a strength and a limitation. Earlier PCEHafliðadóttir et al. Trials (2021) 22:493 Page 12 of 15
Additional file 3. Characteristics of included trials. NS, not specified; and Frederiksberg, Copenhagen, Denmark. 6Whitlam Orthopaedic Research
ADHD, attention deficit hyperactivity disorder; OA, osteoarthritis; RA, Centre, Ingham Institute for Applied Medical Research, Sydney, New South
rheumatoid arthritis. n, number of patients analyzed in intervention and Wales, Australia. 7Faculty of Medicine, South Western Sydney Clinical School,
placebo groups. aTrials with low risk of bias fulfilled all three criteria: (i) The University of New South Wales, Sydney, New South Wales, Australia.
8
clearly concealed allocation, (ii) dropout rate ≤15% and, (iii) sample size Institute of Musculoskeletal Health, School of Public Health, The University
of at least 50. bPatients analyzed in crossover trials that were handled as of Sydney, Sydney, New South Wales, Australia.
parallel-group trials (each patient counted twice).
Received: 28 October 2020 Accepted: 13 July 2021
Additional file 4. Forest plot. PCE, proportional contextual effect.
Additional file 5. Meta-regression plot, illustrating association between
the PCE and publication year. PCE, proportional contextual effect.
Additional file 6. Results of sensitivity analysis (random-effect meta- References
analysis). k, number of trials; n, number of patients analyzed; τ2, estimate 1. Di Blasi Z, Harkness E, Ernst E, Georgiou A, Kleijnen J. Influence of context
of between-study variance; I2, variation in PCE attributable to heterogen- effects on health outcomes: a systematic review. Lancet. 2001;357(9258):
eity, estimated by random-effect subgroup analysis. aSample size analyzed 757–62. https://doi.org/10.1016/S0140-6736(00)04169-6.
by dividing the trials in two groups, 75 (the median) being the cut-point. 2. Kaptchuk TJ, Friedlander E, Kelley JM, Sanchez MN, Kokkotou E, Singer JP,
et al. Placebos without deception: a randomized controlled trial in irritable
Additional file 7. Funnel plot of trials included in sensitivity analysis (k=
bowel syndrome. PLoS One. 2010;5(12):e15591. https://doi.org/10.1371/
163). The vertical line indicates the average effect size. PCE, proportional
journal.pone.0015591.
contextual effect.
3. Atlas LY, Wager TD. How expectations shape pain. Neurosci Lett. 2012;
Additional file 8. Dataset. Data on all screened trials. 520(2):140–8. https://doi.org/10.1016/j.neulet.2012.03.039.
4. Colloca Lab, Miller FGb. Role of expectations in health. Curr Opin Psychiatry.
Acknowledgements 2011;24(2):149–55.
Not applicable. 5. Amanzio M, Benedetti F. Neuropharmacological dissection of placebo
analgesia: expectation-activated opioid systems versus conditioning-
Data sharing activated specific subsystems. J Neurosci. 1999;19(1):484–94. https://doi.
The dataset has been published as additional information (Additional file 8). org/10.1523/JNEUROSCI.19-01-00484.1999.
6. Benedetti F, Pollo A, Lopiano L, Lanotte M, Vighetti S, Rainero I. Conscious
Authors’ contributions expectation and unconscious conditioning in analgesic, motor, and
SHH and RC conceptualized the study. All authors participated in the hormonal placebo/nocebo responses. J Neurosci. 2003;23(10):4315–23.
development and design of the study. SHH, CBJ, and RC performed the https://doi.org/10.1523/JNEUROSCI.23-10-04315.2003.
statistical analysis and interpretation of data. SHH and RC drafted the 7. Rossettini G, Carlino E, Testa M. Clinical relevance of contextual factors as
manuscript. All authors were substantially involved in the critical revision of triggers of placebo and nocebo effects in musculoskeletal pain. BMC
the manuscript. All authors read and approved the final version of the Musculoskelet Disord. 2018;19(1):27. https://doi.org/10.1186/s12891-018-1
manuscript. 943-8.
8. Carlino E, Benedetti F. Different contexts, different pains, different
Funding experiences. Neuroscience. 2016;338:19–26. https://doi.org/10.1016/j.
We would like to acknowledge the support that the Parker Institute, neuroscience.2016.01.053.
Bispebjerg and Frederiksberg Hospital receives via a core grant from the Oak 9. Evers AWM, Colloca L, Blease C, Annoni M, Atlas LY, Benedetti F, et al.
Foundation (OCAY-18-774-OFIL): the Oak Foundation commits its resources Implications of placebo and nocebo effects for clinical practice: expert
to address issues of global, social and environmental concern, particularly consensus. Psychother Psychosom. 2018;87(4):204–10. https://doi.org/10.11
those that have a major impact on the lives of the disadvantaged. The Oak 59/000490354.
Foundation had no role in the study design, data collection and analysis, or 10. Zhang W, Doherty M. Efficacy paradox and proportional contextual effect
preparation of the manuscript. (PCE). Clin Immunol. 2018;186:82–6. https://doi.org/10.1016/j.clim.2017.07.01
8.
Availability of data and materials 11. Walach H. The efficacy paradox in randomized controlled trials of CAM and
All data generated or analyzed during this study are included in this elsewhere: beware of the placebo trap. J Altern Complement Med. 2001;
published article and its supplementary information files. 7(3):213–8. https://doi.org/10.1089/107555301300328070.
12. Zou K, Wong J, Abdullah N, Chen X, Smith T, Doherty M, et al. Examination
Declarations of overall treatment effect and the proportion attributable to contextual
effect in osteoarthritis: meta-analysis of randomised controlled trials. Ann
Ethics approval and consent to participate Rheum Dis. 2016;75(11):1964–70. https://doi.org/10.1136/annrheumdis-201
Not applicable. 5-208387.
13. Liberati A, Altman DG, Tetzlaff J, Mulrow C, Gøtzsche PC, Ioannidis JPA, et al.
Consent for publication The PRISMA statement for reporting systematic reviews and meta-analyses
Not applicable. of studies that evaluate health care interventions: explanation and
elaboration. PLoS Med. 2009;6(7):e1000100. https://doi.org/10.1371/journal.
Competing interests pmed.1000100.
The authors declare that they have no competing interests. 14. Hróbjartsson A, Gøtzsche PC. Placebo interventions for all clinical conditions.
Cochrane Database Syst Rev. 2010;(1):CD003974. https://doi.org/10.1002/14
Author details 651858.CD003974.pub3.
1
Section for Biostatistics and Evidence-Based Research, the Parker Institute, 15. Ioannidis JPA. Meta-research: why research on research matters. PLoS Biol.
Bispebjerg and Frederiksberg Hospital, Nordre Fasanvej 57, DK-2000 2018;16(3):e2005468.
Copenhagen F, Denmark. 2SEARCH Research Group, Research Unit of 16. Ioannidis JP, Fanelli D, Dunne DD, Goodman SN. Meta-research: evaluation
Musculoskeletal Function and Physiotherapy, Institute of Sports Science and and improvement of research methods and practices. PLoS Biol. 2015;
Clinical Biomechanics, Faculty of Health Sciences, University of Southern 13(10):e1002264.
Denmark, Odense, Denmark. 3Department of Physiotherapy and 17. Hróbjartsson A, Gøtzsche PC. Is the placebo powerless? N Engl J Med. 2001;
Occupational Therapy, University Hospital of Copenhagen, Herlev, Gentofte, 344(21):1594–602. https://doi.org/10.1056/NEJM200105243442106.
Denmark. 4Research Unit of Rheumatology, Department of Clinical Research, 18. Higgins JPT, Altman DG, Gøtzsche PC, Jüni P, Moher D, Oxman AD, et al.
University of Southern Denmark, Odense University Hospital, Odense, The Cochrane Collaboration’s tool for assessing risk of bias in randomised
Denmark. 5The Parker Institute, Copenhagen University Hospital Bispebjerg trials. BMJ. 2011;343(oct18 2):d5928. https://doi.org/10.1136/bmj.d5928.Hafliðadóttir et al. Trials (2021) 22:493 Page 13 of 15
19. Whiteside N, Sarmanova A, Chen X, Zou K, Abdullah N, Doherty M, et al. 38. May O, Hansen NC. Comparison of terbutaline, isotonic saline, ambient air
Proportion of contextual effects in the treatment of fibromyalgia-a meta- and non-treatment in patients with reversible chronic airway obstruction.
analysis of randomised controlled trials. Clin Rheumatol. 2018;37(5):1375–82. Eur Respir J. 1988;1(6):527–30.
https://doi.org/10.1007/s10067-017-3948-3. 39. Thomas KS, Muir KR, Doherty M, Jones AC, O'Reilly SC, Bassey EJ. Home
20. Chinn S. A simple method for converting an odds ratio to effect size for use based exercise programme for knee pain and knee osteoarthritis:
in meta-analysis. Stat Med. 2000;19(22):3127–31. https://doi.org/10.1002/1 randomised controlled trial. BMJ. 2002a;325(7367):752. https://doi.org/10.113
097-0258(20001130)19:223.0.CO;2-M. 6/bmj.325.7367.752.
21. Higgins JP, Thompson SG, Deeks JJ, Altman DG. Measuring inconsistency in 40. Thomas KS, Muir KR, Doherty M, Jones AC, O’Reilly SC, Bassey EJ. Home
meta-analyses. BMJ. 2003;327(7414):557–60. https://doi.org/10.1136/bmj.327. based exercise programme for knee pain and knee osteoarthritis:
7414.557. randomised controlled trial. BMJ. 2002b;325(7367):752–5.
22. Egger M, Davey Smith G, Schneider M, Minder C. Bias in meta-analysis 41. Blades KJ, Patel S, Aidoo KE. Oral antioxidant therapy for marginal dry eye.
detected by a simple, graphical test. BMJ. 1997;315(7109):629–34. https:// Eur J Clin Nutr. 2001;55(7):589–97. https://doi.org/10.1038/sj.ejcn.1601186.
doi.org/10.1136/bmj.315.7109.629. 42. Godfrey S, Silverman M. Demonstration by placebo response in asthma by
23. Dechartres A, Trinquart L, Boutron I, Ravaud P. Influence of trial sample size means of exercise testing. J Psychosom Res. 1973;17(4):293–7. https://doi.
on treatment effect estimates: meta-epidemiological study. Bmj. 2013; org/10.1016/0022-3999(73)90106-2.
346(apr24 14):f2304. https://doi.org/10.1136/bmj.f2304. 43. Morton AR, Fazio SM, Miller D. Efficacy of laser-acupuncture in the
24. Dechartres A, Boutron I, Trinquart L, Charles P, Ravaud P. Single-center trials prevention of exercise-induced asthma. Ann Allergy. 1993;70(4):295–8.
show larger treatment effects than multicenter trials: evidence from a meta- 44. Pelham WE, Murphy DA, Vannatta K, Milich R, Licht BG, Gnagy EM, et al.
epidemiologic study. Ann Intern Med. 2011;155(1):39–51. https://doi.org/10. Methylphenidate and attributions in boys with attention-deficit
7326/0003-4819-155-1-201107050-00006. hyperactivity disorder. J Consult Clin Psychol. 1992;60(2):282–92. https://doi.
25. Najnigier B, Patkowski W, Zieniewicz K, Nyckowski P, et al. Zofran org/10.1037/0022-006X.60.2.282.
(ondansectron) in preventing postoperative nausea and vomiting after 45. Roscoe JA, Morrow GR, Bushunow P, Tian L, Matteson S. Acustimulation
laparoscopic cholecystectomy [Zofran w zapobieganiu nudnosciom i wristbands for the relief of chemotherapy-induced nausea. Altern Ther
wymiotom po cholecystektomii laparoskopipwej]. Acta Endoscopica Polona. Health Med. 2002;8(4):56–7 59-63.
1997;7(3):125–8. 46. Rossi A, Ziacchi V, Lomanto B. The hypotensive effect of a single daily dose
26. Watzl H, Olbrich R, Rist F, Cohen R. Placebo injections and alcohol of labetalol: a preliminary study. Int J Clin Pharmacol Ther Toxicol. 1982;
surveillance in inpatient treatment of alcoholic women: An experimental 20(9):438–45.
study of two treatment characteristics [Placebo-injektionen und 47. Rowbotham MC, Davies PS, Verkempinck C, Galer BS. Lidocaine patch:
Alkoholkontrollen in der stationären Behandlung alkoholkranker Frauen - double-blind controlled study of a new treatment method for post-herpetic
eine experimentalle Untersuchung zweier Behandlungsmerkmale]. Z Klin neuralgia. Pain. 1996;65(1):39–44. https://doi.org/10.1016/0304-3959(95)0014
Psychol. 1986;15(4):333–45. 6-8.
27. Chenard JR, Marchand S, Charest J, Jinxue L, et al. Evaluation of a behavioral 48. Sumaya IC, Rienzi BM, Deegan JF 2nd, Moss DE. Bright light treatment
intervention for chronic low-back pain: 'The interactional back school' decreases depression in institutionalized older adults: a placebo-controlled
[Évaluation d'un traitementcomportmental de la lombalgie chronique: 'I´ crossover study. J Gerontol A Biol Sci Med Sci. 2001;56(6):M356–60. https://
école interactionelle du dos']. Science et Comportement. 1991;21(4):225–39. doi.org/10.1093/gerona/56.6.M356.
28. Kokol R, Berger C, Haas J, Kopera D. Venous leg ulcers: no improvement of 49. Wilcock A, Walton A, Manderson C, Feathers L, El Khoury B, Lewis M, et al.
wound healing with 685-nm low level laser therapy. Randomised, placebo- Randomised, placebo controlled trial of nebulised furosemide for
controlled, double-blind study. Hautarzt. 2005;56(6):570–5. https://doi.org/1 breathlessness in patients with cancer. Thorax. 2008;63(10):872–5. https://
0.1007/s00105-004-0864-7. doi.org/10.1136/thx.2007.091538.
29. Tremeau ML, Fontanie-Ravier P, Teurnier F, Demouzon J. Protocol of cervical 50. Double DB, Warren GC, Evans M, Rowlands RP. Efficacy of maintenance use
maturation by acupuncture [Protocole de maturation cervicale par of anticholinergic agents. Acta Psychiatr Scand. 1993;88(5):381–4. https://doi.
acupuncture]. J Gynecol Obstet Biol Reprod. 1992;21:375–80. org/10.1111/j.1600-0447.1993.tb03477.x.
30. Rabkin JG, McGrath PJ, Quitkin FM, Tricamo E, Stewart JW, Klein DF. Effects 51. Classen W, Feingold E, Netter P. Influence of sensory suggestibility on
of pill-giving on maintenance of placebo response in patients with chronic treatment outcome in headache patients. Neuropsychobiology. 1983;10(1):
mild depression. Am J Psychiatry. 1990;147(12):1622–6. https://doi.org/10.11 44–7. https://doi.org/10.1159/000117982.
76/ajp.147.12.1622. 52. Steinsbekk A, Bentzen N, Fonnebo V, Lewith G. Self treatment with one of
31. Thomas KB. General practice consultations: is there any point in being three self selected, ultramolecular homeopathic medicines for the
positive? Br Med J (Clin Res Ed). 1987;294(6581):1200–2. https://doi.org/1 prevention of upper respiratory tract infections in children. A double-blind
0.1136/bmj.294.6581.1200. randomized placebo controlled trial. Br J Clin Pharmacol. 2005;59(4):447–55.
32. Tyler DB. The influence of a placebo, body position and medication on https://doi.org/10.1111/j.1365-2125.2005.02336.x.
motion sickness. Am J Physiol. 1946;146(3):458–66. https://doi.org/10.1152/a 53. Hashish I, Hai HK, Harvey W, Feinmann C, Harris M. Reduction of
jplegacy.1946.146.3.458. postoperative pain and swelling by ultrasound treatment: a placebo effect.
33. Antivalle M, Lattuada S, Salvaggio A, Paravicini M, Rindi M, Libretti A. Pain. 1988;33(3):303–11. https://doi.org/10.1016/0304-3959(88)90289-8.
Placebo effect and adaptation to noninvasive monitoring of BP. J Hum 54. Benedetti F, Amanzio M, Maggi G. Potentiation of placebo analgesia by
Hypertens. 1990;4(6):633–7. proglumide. Lancet. 1995;346(8984):1231. https://doi.org/10.1016/S0140-673
34. Asmar R, Boutelant S, Chaignon M, Guedon J, Topouchian J, Mallion JM, 6(95)92938-X.
et al. Repeated measurement of non-invasive ambulatory blood pressure: 55. Biro P, Meier T, Cummins AS. Comparison of topical anaesthesia methods
distinction between reproducibility and the proper effect of placebo. Blood for venous cannulation in adults. Eur J Pain. 1997;1(1):37–42. https://doi.
Press Monit. 1996;1(3):283–8. org/10.1016/S1090-3801(97)90051-3.
35. Hossmann V, FitzGerald GA, Dollery CT. Influence of hospitalization and 56. Fisher P, McCarney R, Hasford C, Vickers A. Evaluation of specific and
placebo therapy on blood pressure and sympathetic function in essential non-specific effects in homeopathy: feasibility study for a randomised
hypertension. Hypertension. 1981;3(1):113–8. https://doi.org/10.1161/01. trial. Homeopathy. 2006;95(4):215–22. https://doi.org/10.1016/j.homp.2
HYP.3.1.113. 006.07.006.
36. Lee PCL, Jawad MSM, Hull JD, West WHL, Shaw K, Eccles R. The antitussive 57. Frank E, Kupfer DJ, Perel JM, Cornes C, Jarrett DB, Mallinger AG, et al. Three-
effect of placebo treatment on cough associated with acute upper year outcomes for maintenance therapies in recurrent depression. Arch Gen
respiratory infection. Psychosom Med. 2005;67(2):314–7. https://doi.org/10.1 Psychiatry. 1990;47(12):1093–9. https://doi.org/10.1001/archpsyc.1990.0181
097/01.psy.0000155667.59662.92. 0240013002.
37. Dibble SL, Luce J, Cooper BA, Israel J, Cohen M, Nussey B, et al. Acupressure 58. Mayaux MJ, Guihard-Moscato ML, Schwartz D, Benveniste J, Coquin Y,
for chemotherapy-induced nausea and vomiting: a randomized clinical trial. Crapanne JB, et al. Controlled clinical trial of homoeopathy in postoperative
Oncol Nurs Forum. 2007;34(4):813–20. https://doi.org/10.1188/07.ONF.xxx- ileus. Lancet. 1988;1(8584):528–9. https://doi.org/10.1016/s0140-673
xxx. 6(88)91314-1.You can also read


