Nitrate chemistry in the northeast US - Part 2: Oxygen isotopes reveal differences in particulate and gas-phase formation
←
→
Page content transcription
If your browser does not render page correctly, please read the page content below
Research article
Atmos. Chem. Phys., 23, 4203–4219, 2023
https://doi.org/10.5194/acp-23-4203-2023
© Author(s) 2023. This work is distributed under
the Creative Commons Attribution 4.0 License.

                Nitrate chemistry in the northeast US – Part 2:
                     Oxygen isotopes reveal differences in
                      particulate and gas-phase formation
       Heejeong Kim1,2 , Wendell W. Walters2,a , Claire Bekker1,b , Lee T. Murray3 , and Meredith G. Hastings1,2
       1 Department of Earth, Environmental, and Planetary Sciences, Brown University, Providence, RI 02912, USA
             2 Institute
                       at Brown for Environment and Society, Brown University, Providence, RI 02912, USA
          3 Department of Earth and Environmental Sciences, University of Rochester, Rochester, NY 14627, USA
      a now at: Department of Chemistry and Biochemistry, University of South Carolina, Columbia, SC 29208, USA
      b now at: Environmental Health Sciences, University of California Los Angeles, Los Angeles, CA 90095, USA

                 Correspondence: Heejeong Kim (heejeong_kim@brown.edu) and Wendell W. Walters
                                                  (wendell_walters@brown.edu)
                                 Received: 2 September 2022 – Discussion started: 8 November 2022
                           Revised: 8 February 2023 – Accepted: 17 February 2023 – Published: 6 April 2023

      Abstract. The northeastern US represents a mostly urban corridor impacted by high population and fossil fuel
      combustion emission density. This has led to historically degraded air quality and acid rain that has been a focus
      of regulatory-driven emissions reductions. Detailing the chemistry of atmospheric nitrate formation is critical for
      improving the model representation of atmospheric chemistry and air quality. The oxygen isotopic compositions
      of atmospheric nitrate are useful indicators in tracking nitrate formation pathways. Here, we measured oxygen
      isotope deltas (1(17 O) and δ(18 O)) for nitric acid (HNO3 ) and particulate nitrate (pNO3 ) from three US EPA
      Clean Air Status and Trends Network (CASTNET) sites in the northeastern US from December 2016 to 2018.
      The 1(17 O, HNO3 ) and δ(18 O, HNO3 ) values ranged from 12.9 ‰ to 30.9 ‰ and from 46.9 ‰ to 82.1 ‰, and the
      1(17 O, pNO3 ) and δ(18 O, pNO3 ) ranged from 16.6 ‰ to 33.7 ‰ and from 43.6 ‰ to 85.3 ‰, respectively. There
      was distinct seasonality of δ(18 O) and 1(17 O), with higher values observed during winter compared to during
      summer, suggesting a shift in O3 to HOx radical chemistry, as expected. Unexpectedly, there was a statistical
      difference in 1(17 O) between HNO3 and pNO3 , with higher values observed for pNO3 (27.1 ± 3.8) ‰ relative to
      HNO3 (22.7 ± 3.6) ‰, and significant differences in the relationship between δ(18 O) and 1(17 O). This difference
      suggests atmospheric nitrate phase-dependent oxidation chemistry that is not predicted in models. Based on the
      output from GEOS-Chem and both the δ(18 O) and 1(17 O) observations, we quantify the production pathways of
      atmospheric nitrate. The model significantly overestimated the heterogeneous N2 O5 hydrolysis production for
      both HNO3 and pNO3 , a finding consistent with observed seasonal changes in δ(18 O) and 1(17 O) of HNO3 and
      pNO3 , though large uncertainties remain in the quantitative transfer of δ(18 O) from major atmospheric oxidants.
      This comparison provides important insight into the role of oxidation chemistry in reconciling a commonly
      observed positive bias for modeled atmospheric nitrate concentrations in the northeastern US.

Published by Copernicus Publications on behalf of the European Geosciences Union.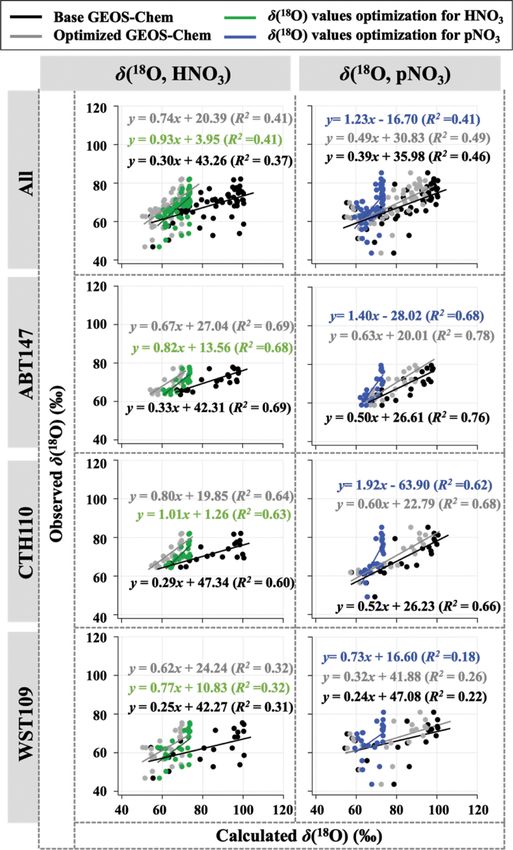
4204                                                                 H. Kim et al.: Nitrate chemistry in the northeast US – Part 2

1   Introduction                                                      ski et al., 2003; Alexander et al., 2009). The isotopic com-
                                                                      position is expressed as δ, which is a standardized notation
Nitrogen oxides (NOx = NO + NO2 ) in the atmosphere have              and is quantified as δ = (Rsample /Rreference − 1). R is the ra-
an important impact on air quality and human and ecosystem            tio of the heavy isotope to the light isotope (e.g., 18 O/16 O;
health (Galloway et al., 2004). NOx plays an important role           17 O/16 O) in the sample and in internationally recognized iso-

in influencing the oxidizing efficiency of the atmosphere, in-        topic reference material (Vienna Standard Mean Ocean Wa-
cluding the production of ozone (O3 ), and leads to the for-          ter), respectively. Several studies have suggested that the dis-
mation of atmospheric nitrate (gas-phase nitric acid (HNO3 )          tinctive (1(17 O) = δ(17 O) − 0.52 × δ(18 O)) and δ(18 O) sig-
and nitrate in particulate form (pNO3 ; Crutzen, 1979). HNO3          natures of atmospheric oxidants such as O3 , O2 /RO2 /HO2 ,
and pNO3 are, in turn, important contributors to dry and wet          H2 O, and OH are incorporated into nitrate, tracking the ox-
N deposition. Nitrate is a key component of particulate mat-          idation chemistry of NOx (Hastings et al., 2003; Michal-
ter (PM2.5 ), which has direct adverse effects on human respi-        ski et al., 2003; Savarino et al., 2007). Traditionally, the
ration and climate change, and the deposition of N to ecosys-         influence of O3 incorporation in nitrate has been quanti-
tems can contribute to soil acidification and eutrophication          tatively tracked using only 1(17 O) because of the unique
(Camargo and Alonso, 2006; Schlesinger, 2007; Tai et al.,             mass-independent fractionation that results in O3 carrying
2010). Thus, changes in the chemistry and chemical feed-              excess δ(17 O), yielding a transferrable 1(17 O) = (39 ± 2) ‰
backs associated with NOx have important implications for             (Thiemens, 2006; Vicars and Savarino, 2014). However,
predicting air quality improvements and climatic responses.           all other atmospheric oxidants contain expected mass-
   The US Environmental Protection Agency (EPA) reported              dependent signatures, such that all have a 1(17 O) value
that NOx emissions decreased by 36 % in the United States             of approximately 0 ‰. The δ(18 O) of atmospheric oxidants
from 2007 to 2015 due to effective regulations in response            could provide further insights into nitrate production mech-
to the Clean Air Act and its amendments (US EPA, 2017;                anisms, especially in cases where oxidants other than O3
CASTNET, 2019; NEI, 2017; Shah et al., 2018). How-                    are important, since it is distinctive for each oxidant (e.g.,
ever, atmospheric pNO3 concentrations have responded sub-             δ(18 O, O3 ) = (126.3 ± 12) ‰; δ(18 O, O2 ) = 23 ‰; δ(18 O,
linearly to the dramatic NOx emission reductions, with only           OH) = −43 ‰; Michalski et al., 2012; Vicars and Savarino,
a 7.8 % pNO3 decrease over the same period in the north-              2014).
eastern US. Uncertainties in our understanding of NOx re-                The northeastern US remains an important region to moni-
ductions and the production of atmospheric nitrate challenge          tor due to air quality historically degraded by NOx emissions
our ability to make effective reductions in reactive nitrogen         and negative atmospheric nitrate deposition impacts on sen-
concentrations. Major factors influencing atmospheric nitrate         sitive ecosystems. Changes in oxidation chemistry and chem-
production include oxidant availability, heterogeneous chem-          ical feedbacks associated with nitrate production and depo-
istry, gas-to-particle partitioning, and potential aerosol nitrate    sition have important implications for predicting air quality
photolysis (Jaeglé et al., 2018; Shah et al., 2018; Kasibhatla        improvements and for informing policy recommendations.
et al., 2018).                                                        In this study, using the Clean Air Status and Trends Net-
   Atmospheric nitrate concentrations have been simulated             work (CASTNET) samples, we explored spatiotemporal dif-
using various chemistry models to detail spatiotemporal vari-         ferences in HNO3 and pNO3 concentrations and production
abilities between precursor NOx emissions and nitrate in the          mechanisms in the northeastern US over 2 years. Based on
US, with somewhat limited success (Walker et al., 2012;               these observations, we aimed to better constrain the mis-
Zhang et al., 2012). In particular, the concentrations of nitrate     match in modeled predictions of atmospheric nitrate chem-
observed in the northeastern US tend to be overestimated in           istry in the northeastern US. This is the first study to quanti-
models (e.g., Heald et al., 2012; Zhang et al., 2012). The            tatively evaluate the triple-oxygen-isotope composition from
northeastern US is an important region to monitor due to its          observations and model simulations in the northeastern US.
high population density, transport patterns, and the tendency         The comparisons with the combination of 1(17 O) and δ(18 O)
for poor air quality (Sickles and Shadwick, 2015). Modeling           values and with both gaseous and particle phases of nitrate
studies suggest that biases revealed by comparison with ob-           provide a significant advance in our ability to probe the rep-
servations could be due to uncertainties in NOx and gaseous           resentation of oxidation chemistry in atmospheric chemistry
ammonia (NH3 ) emission estimates, dry deposition removal             models.
rates, heterogeneous chemical production rates, and chang-
ing chemistry due to reductions in NOx and sulfur dioxide
                                                                      2     Methods
emissions (Heald et al., 2012; Holt et al., 2015; Shah et al.,
2018).                                                                2.1    CASTNET samples
   The nitrate oxygen isotope deltas (1(17 O) and δ(18 O))
have been proven to provide observational constraints on              Atmospheric nitrate samples were collected by the US EPA
the oxidation pathways that are responsible for the forma-            at several locations of CASTNET sites in the northeast-
tion of atmospheric nitrate (Hastings et al., 2003; Michal-           ern US (Fig. 1). Three CASTNET sites were selected:

Atmos. Chem. Phys., 23, 4203–4219, 2023                                                https://doi.org/10.5194/acp-23-4203-2023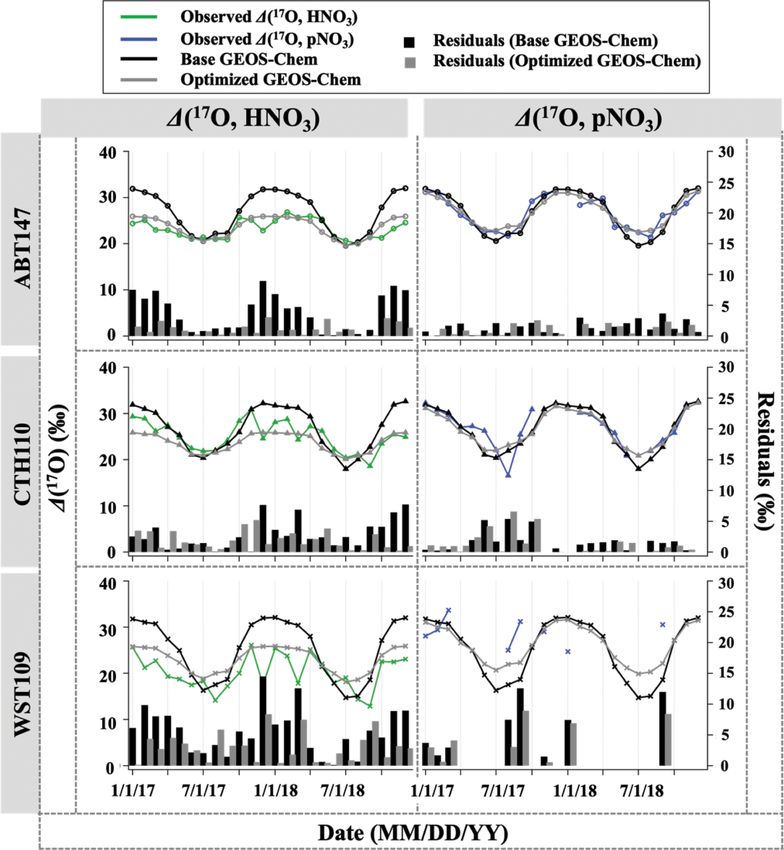
H. Kim et al.: Nitrate chemistry in the northeast US – Part 2                                                                4205

Abington, CT (ABT147; 41.84◦ N, −72.01◦ W); Connecti-               ratios of the evolved O2 . The 33/32 and 34/32 mass ratios
cut Hill, NY (CTH110; 42.40◦ N, −76.65◦ W); Woodstock,              were corrected using isotopic reference materials, USGS34
NH (WST109; 43.94◦ N, −71.70◦ W). The samples were                  (−0.29 ‰) and USGS35 (21.6 ‰), and then 1(17 O) was
collected weekly from 23 December 2016 to 28 Decem-                 determined from 1(17 O) = δ(17 O) − 0.52 × δ(18 O). Due to
ber 2018 using a three-stage filter pack system. Based on           sample mass limitations, some samples were only ana-
EPA protocols, pNO3 was collected using a Teflon filter in          lyzed for δ(18 O). The number of samples that were not
the first stage of the filter pack, and gaseous HNO3 was col-       measured for 1(17 O) was 1 HNO3 sample from CTH110,
lected using a Nylon filter in the second stage of the filter       2 HNO3 samples from ABT147, 5 pNO3 samples from
pack. We note that, due to the semi-volatile characteristic of      CTH110, and 16 pNO3 samples from WST109. The over-
ammonium nitrate, some pNO3 might volatilize as HNO3                all pooled standard deviations of isotopic reference ma-
and collect downstream of the filter pack, leading to nega-         terials and sample numbers were as followed: USGS34
tive biases for pNO3 and positive biases for HNO3 collection        (σ (δ(18 O)) = 0.5 ‰ (n = 21); σ (1(17 O)) = 1 ‰ (n = 26));
(Hering and Cass, 1999; Ashbaugh and Eldred, 2004).                 USGS35 (σ (δ(18 O)) = 0.4 ‰ (n = 27); σ (1(17 O)) = 2 ‰
                                                                    (n = 26)), and IAEA-NO-3 (σ (δ(18 O)) = 0.3 ‰ (n = 23)).
2.2   Concentration and isotope analyses
                                                                    2.3   GEOS-Chem modeling
Filters were extracted and measured for nitrate concentration
using ion chromatography and then stored in the CASTNET             The GEOS-Chem global model of atmospheric chemistry
laboratory at room temperature for up to 2 years. Extracted         (Bey et al., 2001; Walker et al., 2012, 2019) was uti-
samples were shipped to Brown University in the summer of           lized to track the production of NO2 and HNO3 at the
2020. Nitrate concentrations were measured at Brown Uni-            CASTNET sites and, further, to model the oxygen isotope
versity to check for stability of nitrate using standard col-       deltas (e.g., δ(18 O) and 1(17 O)) following a previous frame-
orimetric methods (i.e., US EPA Method 353.2) on an auto-           work (Alexander et al., 2020). Following this framework,
mated discrete UV-Vis Analyzer (SmartChem Westco Scien-             oxidation chemistry is tagged only for HNO3 production
tific Instruments, Inc.). The limit of detection was 0.1 and        and is assumed to be the same for pNO3 . We use ver-
0.3 µM for nitrite and nitrate, respectively, and the pooled        sion 13.2.1 (http://wiki.seas.harvard.edu/geos-chem/index.
standard deviation of replicate quality control standards was       php/GEOS-Chem_13.2.1, last access: 2 September 2022) of
better than 3 %. Overall, strong positive correlations were         the model driven by GEOS5-FP assimilated meteorology
found between measured concentrations at Brown and re-              from the NASA Global Modeling and Assimilation Office
ported CASTNET data for both HNO3 (y = 0.99x − 0.08                 (GMAO). A nested-grid (0.25◦ latitude × 0.3125◦ longitude
(R 2 = 0.99); p < 0.05) and pNO3 (y = 1.04x + 0.09 (R 2 =           horizontal resolution; ∼ 25 km) simulation was conducted
0.99); p < 0.05) (Fig. 2); we, therefore, consider the samples      over the northeastern United States (97–60◦ W, 35–60◦ N) in
to be representative of their original concentrations.              2017 and 2018. Boundary conditions were from global simu-
    The samples were collected once a week, and equal vol-          lations performed at 4◦ latitude × 5◦ longitude horizontal res-
umes of filter extract were combined for isotope analysis to        olution for the same years after a 1-year initialization. Gas-
produce monthly aggregates for HNO3 and pNO3 , respec-              and aerosol-phase chemistry was simulated using the default
tively. Oxygen (δ(18 O) and 1(17 O)) stable isotopic compo-         “fullchem” mechanism (Bates and Jacob, 2019; Wang et al.,
sitions in HNO3 and pNO3 were analyzed utilizing the bac-           2021). Inorganic gas and aerosol partitioning were conducted
terial denitrifier method at Brown University (Sigman et al.,       using version 2.2 of the ISORROPIA II thermodynamic equi-
2001; Casciotti et al., 2002; Kaiser et al., 2007). Briefly, sam-   librium model (Fountoukis and Nenes, 2007).
ples were injected into a buffer solution containing Pseu-             All default anthropogenic emissions were applied, which
domonas aureofaciens, which lack the nitrous oxide (N2 O)           is primarily version 2.0 of the Community Emissions Data
reductase enzyme, and sample nitrate was quantitatively re-         System (Hoesly et al., 2018) as implemented by McDuffie et
duced to N2 O. For δ(18 O) analysis, the generated N2 O is          al. (2020). Natural emissions respond to local meteorology
injected into a Thermo-Finnigan Delta V Plus isotope ra-            and include biogenic VOCs (volatile organic compounds)
tio mass spectrometry (IRMS) with a modified GasBench               from terrestrial plants and the ocean (Millet et al., 2010;
system after flowing through an automated extraction and            Guenther et al., 2012; Hu et al., 2015; Breider et al., 2017),
purification system. Determination of δ(18 O) in N2 O was           NOx from lightning and soil microbial activity (Murray et
conducted at an m/z of 44, 45, and 46 and corrected using           al., 2012; Hudman et al., 2012), mineral dust (Ridley et al.,
internationally recognized isotopic reference materials that        2012), and sea salt (Jaeglé et al., 2011; Huang and Jaeglé,
included IAEA-NO-3 (25.6 ‰), USGS34 (−27.9 ‰), and                  2017). Biomass burning emissions were monthly means
USGS35 (57.5 ‰). The 1(17 O) was determined in a sepa-              from version 4.1s of the Global Fire Emissions Database
rate analysis. The bacteria-generated N2 O was decomposed           (GFED4.1s; van der Werf et al., 2017). Wet deposition for
to N2 and O2 in a gold furnace heated to 770 ◦ C and analyzed       water-soluble aerosols is described by Liu et al. (2001) and
at m/z 32, 33, and 34 to determine 17 O/16 O and 18 O/16 O          by Amos et al. (2012) for gases. Dry deposition is based on

https://doi.org/10.5194/acp-23-4203-2023                                           Atmos. Chem. Phys., 23, 4203–4219, 2023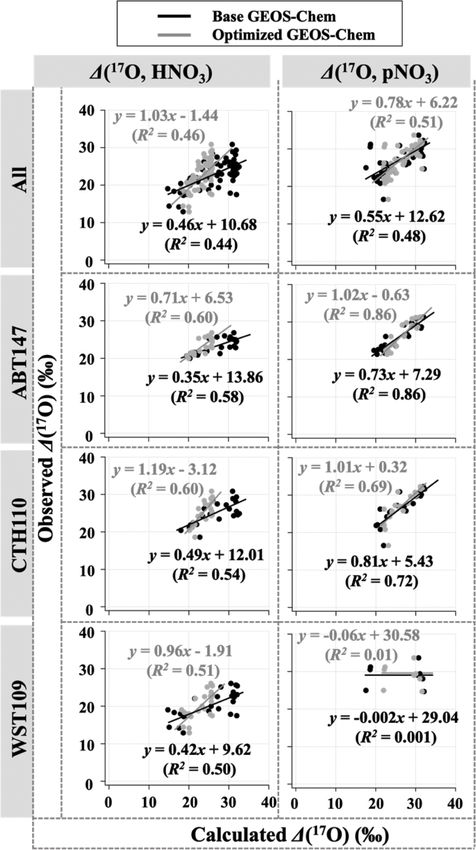
4206                                                                H. Kim et al.: Nitrate chemistry in the northeast US – Part 2

Figure 1. Map of the United States (a) and selected CASTNET sites (b) for this study in the northeastern US. Major cities (urban areas),
transportation routes, and CASTNET sites are also indicated in (b). The image was created using Google Earth (© 2023 Google).

                                                                      oxygen mass balance (Alexander et al., 2009, 2020; Michal-
                                                                      ski et al., 2003; Morin et al., 2011; Carter et al., 2021).
                                                                      Briefly, the δ(18 O) and 1(17 O) of nitrate are determined by
                                                                      both NOx photochemical cycling and nitrate formation reac-
                                                                      tions (Alexander et al., 2009; Walters et al., 2018). During
                                                                      NOx photochemical cycling, the oxygen isotopic composi-
                                                                      tions of NOx are determined by the relative production rates
                                                                      of NO2 via reaction of NO with O3 , peroxy and hydroper-
                                                                      oxyl radicals, and halogen oxides (XO; BrO, ClO). The pro-
                                                                      portional contribution of O3 during NO oxidation is denoted
                                                                      as A and is calculated using
Figure 2. Relationship of HNO3 (a) and pNO3 (b) filter extract
concentrations reported by CASTNET and re-measured at Brown           A = (k(O3 + NO)[O3 ]
University.                                                              + k(XO + NO)[XO])/(k(O3 + NO)[O3 ]
                                                                         + k(XO + NO)[XO] + k(HO2 + NO)[HO2 ]
the resistance-in-series scheme of Wesely and Lesht (1989).              + k(RO2 + NO)[RO2 ]),                                      (2)
Diagnostics were implemented to archive the total produc-
tion and loss pathways of NOy , NOx , NO2 , RONO2 , HNO3 ,            where k is the respective rate constant for NO oxidation via
and pNO3 , including the net flux of mass between HNO3 and            O3 , XO, HO2 , and RO2 . The 1(17 O) value of the terminal
pNO3 in ISORROPIA II. We evaluated model performance                  oxygen atom in O3 (O∗3 ) is assumed to be (39 ± 2) ‰ based
for simulating concentrations and isotope deltas (δ(18 O) and         on observations, while all other oxidants are assumed to be
1(17 O)) using the normalized mean bias (B) metric (Eq. 1):           0 ‰ (Vicars et al., 2012; Vicars and Savarino, 2014; Alexan-
                                                                      der et al., 2020); δ(18 O) and 1(17 O) values of nitrate from
                                                                      each production pathway were then determined using O mass
      X               X
B=          Q̄m − Q̄o /     Q̄o ,                          (1)
                                                                      balance based on the O transfer from varying oxidants in-
                                                                      volved in its formation (Table 1).
where Q̄m is the modeled quantities, and Q̄o is the observed             The GEOS-Chem global model has been previously used
quantities.                                                           to quantify nitrate production pathways based on 1(17 O)
                                                                      (Alexander et al., 2009, 2020), but this has not been done
2.4 δ (18 O) and ∆(17 O) calculations based on model                  for δ(18 O). Using a similar framework as that for 1(17 O), we
    outputs                                                           expect that δ(18 O) of NO2 reflects isotopic signatures of both
                                                                      O3 and O2 , as it has been assumed that the O isotopic compo-
The oxygen isotope deltas (δ(18 O) and 1(17 O)) of nitrate
                                                                      sition of RO2 and HO2 is equal to O2 (Michalski et al., 2012;
were calculated based on oxygen isotope mass balance us-
                                                                      Walters et al., 2018). Accordingly, the values of δ(18 O, NO2 )
ing production rate outputs from the GEOS-Chem global 3-D
                                                                      can be predicted by the proportional contribution of O3 and
model and compared with our observations. Expected δ(18 O)
                                                                      both HO2 and RO2 during NOx cycling with their distinct
and 1(17 O) ranges resulting from nitrate production path-
                                                                      δ(18 O) values of O3 and O2 (Eq. 3; Table 1).
ways have been previously described and calculated using

Atmos. Chem. Phys., 23, 4203–4219, 2023                                                 https://doi.org/10.5194/acp-23-4203-2023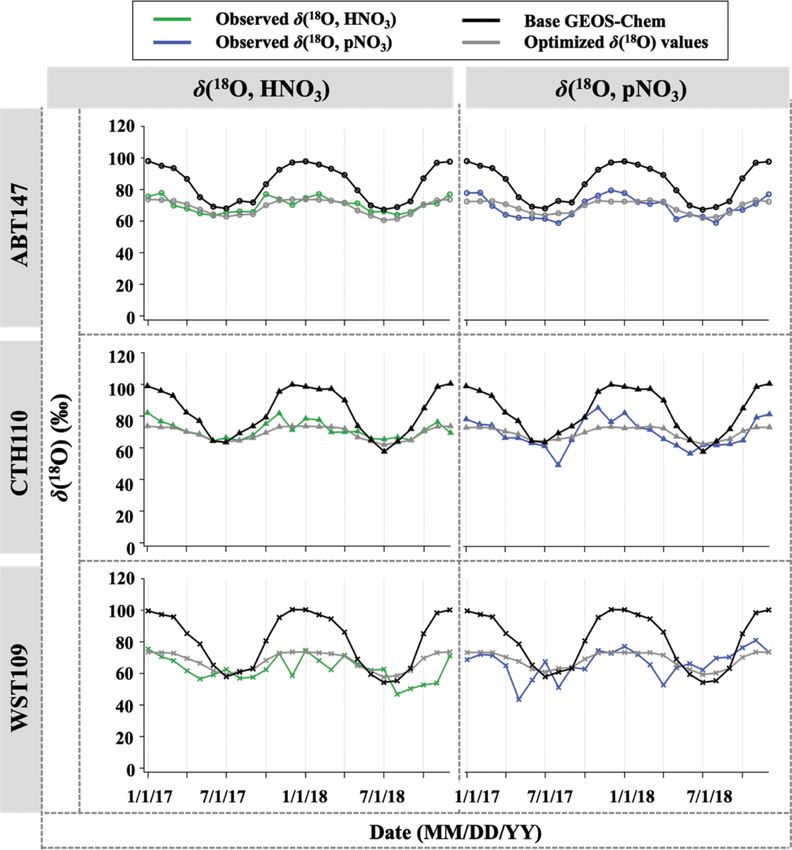
H. Kim et al.: Nitrate chemistry in the northeast US – Part 2                                                                      4207

Table 1. Equations for δ(18 O) and 1(17 O) calculations by different nitrate formation pathways.

             Gas-phase reactions                    1(17 O, tNO3 )              δ(18 O, tNO3 )

             NO2 + OH                               2 A1(17 O, O∗ )             2 δ(18 O,NO ) + 1 δ(18 O, OH)
                                                    3           3               3          2    3

             NO3 + hydrocarbons                         2 A + 1 1(17 O, O∗ )    2 δ(18 O, NO ) + 1 δ(18 O, O∗ )
                                                        3     3          3      3           2    3          3

             Heterogeneous reactions

             N2 O5 hydrolysis (water + Cl− )            2 A + 1 1(17 O, O∗ )    2 δ(18 O, NO ) + 1 δ(18 O, O∗ ) + 1 δ(18 O, H O)
                                                        3     6          3      3           2    6          3     6          2

             NO3 hydrolysis                             2 A + 1 1(17 O, O∗ )    2 δ(18 O, NO ) + 1 δ(18 O, O∗ )
                                                        3     3          3      3           2    3          3

             NO2 hydrolysis                           2 A + 1 1(17 O, O∗ )      2 δ(18 O,NO ) + 1 δ(18 O,H O)
                                                      3     3          3        3           2    3          2

             RONO2 hydrolysis                       1 A1(17 O, O∗ )             2 δ(18 O, RO ) + 1 δ(18 O, NO )
                                                    3           3               3           2    3            2

             XNO3 hydrolysis (X = Br + Cl + I)          2 A + 1 1(17 O, O∗ )    2 δ(18 O, NO ) + 1 δ(18 O, O∗ )
                                                        3     3          3      3           2    3          3

                                                                         3     Results and discussion

δ(18 O, NO2 ) = A(δ(18 O, O∗3 )) + (1 − A)(δ(18 O, O2 ))           (3)   3.1    Spatiotemporal variations of atmospheric nitrate
                                                                                concentration
The δ(18 O) values of O3 and O2 are adopted from previ-
ous studies that determined δ(18 O, O∗3 ) and δ(18 O, O2 ) to            Figure 3 shows the monthly averaged spatiotemporal vari-
be 126.3 ‰ and 23 ‰ (Vicars and Savarino, 2014; Kroop-                   ations of HNO3 and pNO3 mass concentration (denoted
nick and Craig, 1972, respectively). For the calculation of              as γ ). The observed (o) HNO3 concentrations (γo (HNO3 ))
δ(18 O) of nitrate, the value of δ(18 O) of H2 O(l) is assumed           ranged from 0.11 to 0.88 µg m−3 , with a mean value of
to be −6 ‰, which is a typical mid-latitude value and repre-             0.46 µg m−3 across the three CASTNET sites. The ob-
sents water in the liquid phase incorporated into nitrate for-           served pNO3 concentrations (γo (pNO3 )) ranged from 0.04 to
mation associated with heterogeneous reactions by N2 O5 or               2.01 µg m−3 , with a mean value of 0.50 µg m−3 , and showed
NO2 hydrolysis (Michalski et al., 2012). The δ(18 O) value               clear seasonality at all three sites, with averaged higher
of OH can be dependent on both O3 and H2 O(g), as well as                values of (0.75 ± 0.52) µg m−3 in the cold season (Octo-
environmental conditions, since oxygen in OH can exchange                ber to March) and lower values of (0.25 ± 0.17) µg m−3 in
with H2 O(g) (Dubey et al. 1997). Fractionation factors asso-            the warm season (April to September), which were signif-
ciated with the O transfer into NOy products are unknown                 icantly different (p < 0.01). On the other hand, γo (HNO3 )
and therefore were not considered. The δ(18 O) of H2 O(g)                was seasonally invariable with (0.42 ± 0.17) µg m−3 for the
was estimated based on the equilibrium between H2 O(l) and               cold season and (0.50 ± 0.24) µg m−3 for the warm sea-
H2 O(g) with a temperature-dependent fractionation factor                son, which were not statistically different (p > 0.05). Av-
(1.0094 at 298 K); it is assumed that OH and H2 O(g) exist               eraged γo (HNO3 ) was generally lower than pNO3 across
in isotopic equilibrium, which has a theoretically determined            the sites, but the difference was statistically insignifi-
fractionation factor (1.0371 at 298 K) and leads to an esti-             cant (p > 0.05). Both γo (HNO3 ) and γo (pNO3 ) indicated
mate of δ (18 O, OH) of −43 ‰ (Michalski et al., 2012; Wal-              spatial variability, with higher values at ABT147 and
ters and Michalski, 2016). We note that the typical annual               CTH110 than at the WST109 site. The mean annual
temperature for the northeast US is approximately 287 K,                 γo (HNO3 ) and γo (pNO3 ) were (0.61 ± 0.15) µg m−3 and
yielding a δ(18 O, OH) of −45 ‰; for comparison purposes                 (0.66 ± 0.34) µg m−3 at ABT147, (0.55 ± 0.13) µg m−3 and
with prior publications, we utilize −43 ‰, which makes lit-              (0.68 ± 0.58) µg m−3 at CTH110, and (0.22 ± 0.06) µg m−3
tle difference in the quantitative results below. In the final           and (0.17 ± 0.13) µg m−3 at WST109, respectively.
step, δ(18 O) or 1(17 O) of total atmospheric nitrate were cal-             The modeled (m) HNO3 concentrations (γm (HNO3 ))
culated based on the monthly averaged production rates from              ranged from 0.20 to 2.36 µg m−3 , with a mean value of
GEOS-Chem and the seven major reactions that produce ni-                 0.82 µg m−3 , and modeled pNO3 concentrations (γm (pNO3 ))
trate in the model (Table 1) to compare with observations.               ranged from 0.20 to 5.27 µg m−3 , with a mean value of
                                                                         1.89 µg m−3 . Contrary to our observed data, no consis-
                                                                         tent spatial variability was observed for γm (HNO3 ) and
                                                                         γm (pNO3 ). The mean γm (HNO3 ) and γm (pNO3 ) were
                                                                         (1.09 ± 0.62) µg m−3 and (1.73 ± 1.13) µg m−3 at ABT147,

https://doi.org/10.5194/acp-23-4203-2023                                                  Atmos. Chem. Phys., 23, 4203–4219, 2023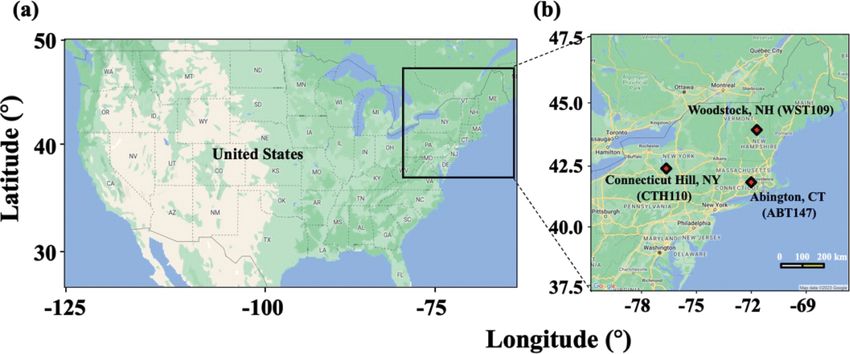
4208                                                               H. Kim et al.: Nitrate chemistry in the northeast US – Part 2

Figure 3. Time series of monthly mean total nitrate, HNO3 , and pNO3 concentrations (γ ) observed and simulated at ABT147, CTH110,
and WST109 CASTNET sites. B refers to the normalized mean bias for comparison of the model to observations (see Sect. 2.3 in Methods).

(0.74 ± 0.46) µg m−3 and (2.42 ± 1.71) µg m−3 at CTH110,             hydrolysis rate, emission estimates, or dry and wet deposi-
and (0.64 ± 0.22) µg m−3 and (1.52 ± 1.24) µg m−3 at                 tion removal rates have been suggested as possible causes
WST109, respectively. However, there are significant sea-            for predicted nitrate biases. For instance, Luo et al. (2019,
sonal model biases for the HNO3 and pNO3 . The model                 2020) reported dramatic improvement of nitric acid and ni-
significantly overestimates pNO3 during the winter (3–9              trate biases by updating wet scavenging parameterization in
times) and overestimates HNO3 during the summer (2–3                 the GEOS-Chem model; however, this update leads to biases
times).                                                              in oxidized-nitrogen wet deposition between model predic-
   As stated above, there can be negative biases for pNO3            tions and observations.
and positive biases for HNO3 collection, but these should
be reduced by comparing the model to total atmospheric ni-
trate (tNO3 = HNO3 + pNO3 ). Still, the simulated tNO3 con-          3.2   Oxygen isotopic compositions – oxidation chemistry
centration (γm (tNO3 )) with GEOS-Chem is notably over-                    and phase difference
estimated relative to observations (γo (tNO3 ); B = 182 %;
                                                                     The oxygen isotopic compositions in atmospheric nitrate
Fig. 3). While the simulated pNO3 reproduced well the ob-
                                                                     are used to evaluate NOx oxidation chemistry and to as-
served seasonality (high concentrations in the cold season
                                                                     sess seasonal changes in nitrate formation mechanisms.
and vice versa), it highly overestimated the concentrations
                                                                     For the CASTNET sites, the 1(17 O, HNO3 ) and 1(17 O,
for most of the year (B = 276 %; Fig. 3). The simulated
                                                                     pNO3 ) values ranged from 12.9 ‰ to 30.9 ‰ and from
HNO3 did not capture the observed relative lack of season-
                                                                     16.6 ‰ to 33.7 ‰, with a mean value of (22.7 ± 3.6) ‰ and
ality, instead showing clear seasonality, with generally high
                                                                     (27.1 ± 3.8) ‰, respectively (Fig. 4). The δ(18 O, HNO3 ) and
concentrations in the warm season and low concentrations
                                                                     δ(18 O, pNO3 ) values ranged from 46.9 ‰ to 82.1 ‰ and
in the cold season. The lack of agreement between GEOS-
                                                                     from 43.6 ‰ to 85.3 ‰, with a mean value of (68.1 ± 7.1) ‰
Chem and nitrate observations is consistent with previously
                                                                     and (68.2 ± 8.3) ‰, respectively (Fig. 5). These observations
reported results in other studies (Heald et al., 2012; Zhang
                                                                     are in the range of previously reported values in polluted mid-
et al., 2012; Walker et al., 2012). Uncertainties in N2 O5
                                                                     latitudes: δ(18 O, HNO3 ) and δ(18 O, pNO3 ) in CASTNET

Atmos. Chem. Phys., 23, 4203–4219, 2023                                                https://doi.org/10.5194/acp-23-4203-2023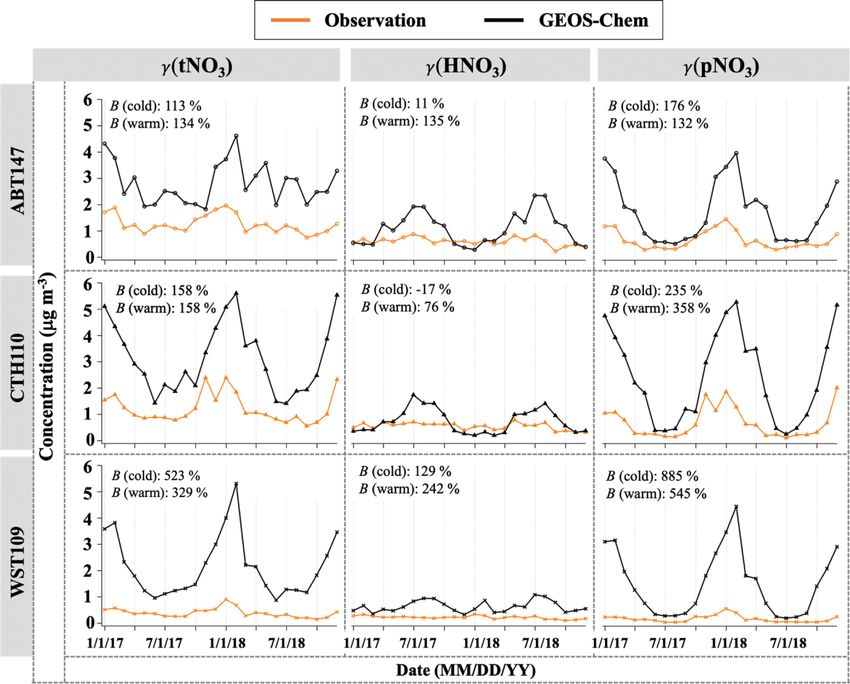
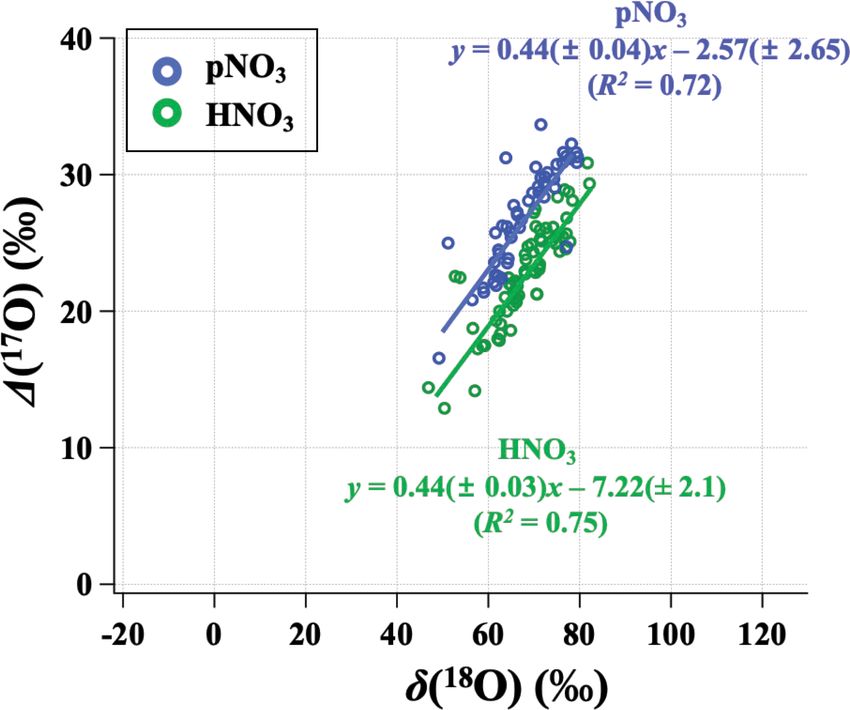
H. Kim et al.: Nitrate chemistry in the northeast US – Part 2                                                            4209

sites in Ohio, Pennsylvania, and New York from April 2004       caused by volatilization, which leads to mass-dependent
to March 2005 ranged from 51.6 ‰ to 94.0 ‰ and from             fractionation. This difference might be related to the dif-
45.2 ‰ to 92.7 ‰ (Elliott et al., 2009), respectively. They     ferences in particulate nitrate size-dependent production
are also consistent with observations of polluted air masses    pathways. Previous studies of size-segregated 1(17 O, pNO3 )
in Canada from September 2010 to January 2014, which            indicated higher values for coarse pNO3 (aerodynamic diam-
were from 62.4 ‰ to 81.7 ‰ for δ(18 O, HNO3 ), from 19.3 ‰      eter (Da ) > 0.95 µm) relative to fine pNO3 (Da < 0.95 µm);
to 29.0 ‰ for 1(17 O, HNO3 ), from 48.4 ‰ to 83.2 ‰ for         this was concluded to reflect the increased importance of
δ(18 O, pNO3 ), and from 13.8 ‰ to 30.5 ‰ for 1(17 O, pNO3 )    heterogeneous N2 O5 hydrolysis on coarse particles relative
(Savard et al., 2018).                                          to fine particles (Vicars et al., 2013). The CASTNET pNO3
   Previous studies and modeling results have indicated that    samples reflect total suspended particles (TSP) such that
the seasonality of oxygen isotopic compositions in HNO3         increased importance of N2 O5 heterogeneous chemistry for
and pNO3 is driven by a shift in oxidation chemistry (e.g.,     coarse particulate nitrate formation could explain the higher
Hastings et al., 2003; Michalski et al., 2012; Alexander et     1(17 O, pNO3 ) values we observe relative to 1(17 O, HNO3 ).
al., 2009, 2020). Globally, the seasonality reflects a shift       Positive linear relationships between δ(18 O) and 1(17 O)
in O3 to HOx radical chemistry during winter to summer,         were observed for HNO3 and pNO3 across the CASTNET
respectively. Wintertime has higher NO + O3 branching ra-       sites, with similar slopes but different oxygen isotopic signa-
tios than summer, which has increased NO + RO2 /HO2 .           tures indicated by different intercepts (Fig. 6). For the rela-
The high values of δ(18 O) and 1(17 O) in HNO3 and pNO3         tionship of δ(18 O) and 1(17 O), the high-end member should
during the cold season are caused by the increased in-          result from O3, and the lower-end member depends on the
corporation of O3 into the nitrate product through N2 O5        isotopic signature of the atmospheric oxidants involved. The
heterogeneous hydrolysis on aerosols (Figs. 4 and 5). In        transferable δ(18 O) signatures of atmospheric oxidants are
contrast, the dominance of gas-phase production by the          not fully understood yet, reflecting a complex combination
NO2 + OH reaction dilutes the isotopic influence of O3 dur-     of atmospheric oxidant source signatures and isotope frac-
ing warm seasons, leading to the low values of δ(18 O) and      tionation during reaction and incorporation into the nitrate
1(17 O) in HNO3 and pNO3 . Spatial variability is observed      end product. While ozone has a notably high 1(17 O) value
in δ(18 O) and 1(17 O) of HNO3 , with the highest values        ((39 ± 2) ‰; Vicars and Savarino, 2014), 1(17 O) values of
at CTH110 (δ(18 O): (71.5 ± 5.6) ‰ (n = 24) and 1(17 O):        other atmospheric oxidants such as O2 /RO2 /HO2 , H2 O, and
(25.0 ± 3.1) ‰ (n = 23)) followed by ABT147 (δ(18 O):           OH are equal to or close to 0 ‰ (Michalski et al., 2012; Wal-
(70.1 ± 4.8) ‰ (n = 24) and 1(17 O): (23.1 ± 2.2) ‰ (n =        ters et al., 2019). Overall, our results suggest that more O3
24)) and then by WST109 (δ(18 O): (62.8 ± 7.7) ‰ (n =           is incorporated during the formation of pNO3 than HNO3 .
24) and 1(17 O): (20.2 ± 3.7) ‰ (n = 24)). However, δ(18 O)     We further analyze the oxidation chemistry involved in at-
and 1(17 O) of pNO3 were not significantly different across     mospheric nitrate formation based on output from the GEOS-
the stations: for ABT147 (δ(18 O): (68.6 ± 7.1) ‰ (n = 24)      Chem chemical transport model.
and 1(17 O): (26.4 ± 3.6) ‰ (n = 22)); CTH110 (δ(18 O):
(69.1 ± 8.9) ‰ (n = 24) and 1(17 O): (26.8 ± 4.1) ‰ (n =        3.3   Quantifying atmospheric nitrate oxidation chemistry
19)); and WST109 (δ(18 O): (66.8 ± 8.7) ‰ (n = 24) and                using ∆(17 O)
1(17 O): (29.4 ± 2.9) ‰ (n = 10)).
   Our observations indicate a significant phase-dependent      Observations of the oxygen isotopic composition were uti-
difference in oxidation chemistry between HNO3 and              lized to quantify the relative importance of different nitrate
pNO3 that is unexpected (Fig. 6). Many modeled                  formation pathways and to assess model representation of
mechanisms of gas- and aqueous-phase chemistry pro-             the chemistry of nitrate formation. Using atmospheric ni-
duce HNO3 , then HNO3 is partitioned into the aerosol           trate production rates from the GEOS-Chem model (“base
phase based on thermodynamic equilibrium (i.e.,                 case”), 1(17 O) was calculated within a grid cell correspond-
NH4 NO3 (s) HNO3 (g) + NH3 (g)) or coarse uptake.               ing to our CASTNET sites and compared with observed
Conventional understanding would expect 1(17 O) of HNO3         1(17 O, HNO3 , pNO3 ) at each site (Fig. 4). We note that
and pNO3 to be the same (e.g., Alexander et al., 2020).         the previous 1(17 O) GEOS-Chem framework tags NO2 and
However, observed 1(17 O, pNO3 ) tends to be significantly      HNO3 production and assumes that pNO3 production is sim-
higher than 1(17 O, HNO3 ) (p < 0.01 at ABT and CTH;            ilar to HNO3 production due to thermodynamic equilib-
p = 0.088 at WST). The difference between 1(17 O, pNO3 )        rium. Thus, we compared the simulated 1(17 O, HNO3 ) from
and 1(17 O, HNO3 ) was larger in the cold season than in the    GEOS-Chem to our 1(17 O, HNO3 ) and 1(17 O, pNO3 ) ob-
warm season. For example, on average, 1(17 O, pNO3 ) was        servations. The averaged residuals over the collection pe-
(5.1 ± 2.6) ‰ higher than 1(17 O, HNO3 ) during the cold        riod for each site were 3.9 ‰, 2.8 ‰, and 5.6 ‰ for 1(17 O,
months, while 1(17 O, pNO3 ) was (2.7 ± 4.7) ‰ higher than      HNO3 ) and 1.5 ‰, 1.7 ‰, and 6.1 ‰ for 1(17 O, pNO3 ) at
1(17 O, HNO3 ) during warm months. This phase difference        ABT147, CTH110, and WST109, respectively (Fig. 4). Cal-
in 1(17 O) cannot be explained by potential sample biases       culated 1(17 O) based on GEOS-Chem output reproduced

https://doi.org/10.5194/acp-23-4203-2023                                       Atmos. Chem. Phys., 23, 4203–4219, 2023

4210                                                               H. Kim et al.: Nitrate chemistry in the northeast US – Part 2

Figure 4. Time series of the monthly mean for observed and calculated 1(17 O) for HNO3 and pNO3 over ABT147, CTH110, and WST109
CASTNET sites. Calculated 1(17 O) using base (black) and optimized (gray) GEOS-Chem are shown in the plot together. Bars indicate the
residuals between calculation and observation.

the observed temporal variations well (Fig. 4), although the         rithm constrains the relative rates of nitrate formation path-
model better captured the lower observed 1(17 O) during              ways simulated by GEOS-Chem. Additionally, the optimiza-
warmer months versus the higher values observed in the               tion was conducted for HNO3 and pNO3 separately. Calcu-
cooler months (Table 2). The GEOS-Chem model also does               lated 1(17 O) from the base GEOS-Chem model was gener-
not capture observed spatial 1(17 O) variabilities. For in-          ally 1.15 times higher than observed 1(17 O, HNO3 ) and 0.98
stance, higher 1(17 O) values (especially for HNO3 ) were ob-        times lower than 1(17 O, pNO3 ) across all CASTNET sites.
served at CTH110 compared to at WST109, while no signif-             After optimization, the residuals between observed and cal-
icant spatial 1(17 O) differences were predicted from GEOS-          culated 1(17 O) dramatically decreased (Fig. 4), especially in
Chem. The model prediction was sensitive to the type of ni-          the cold season (Table 2). Moreover, the linear relationships
trate; the calculated 1(17 O) showed a better agreement with         had slopes much closer to the 1 : 1 line (i.e., from 0.46 to 1.03
observed 1(17 O) of pNO3 (y = 0.55x + 12.62 (R 2 = 0.48))            for HNO3 and from 0.55 to 0.78 for pNO3 ; Fig. 7) than the
than 1(17 O) of HNO3 (y = 0.46x + 10.68 (R 2 = 0.44)) at all         base GEOS-Chem model across the three CASTNET sites
CASTNET sites (B = −2 % and 15 %, respectively; Fig. 7).             (the relationships for each site before and after optimization
   Several studies have used 1(17 O) to quantify and/or con-         are shown in Fig. 7). On a subannual basis, the 1(17 O) com-
strain modeled chemical mechanisms. Here, GEOS-Chem                  parison for the cold season showed better improvement than
nitrate production rates and thus calculated 1(17 O) were op-        the warm season, especially for 1(17 O, HNO3 ).
timized to find the lowest residual sum of squares between              The dominant annual pathway for nitrate formation in
the calculated and observed 1(17 O). This optimization algo-         the GEOS-Chem model (“base case”) was N2 O5 hydrolysis,

Atmos. Chem. Phys., 23, 4203–4219, 2023                                                https://doi.org/10.5194/acp-23-4203-2023
H. Kim et al.: Nitrate chemistry in the northeast US – Part 2                                                                  4211

Figure 5. Time series of the monthly mean for observed and calculated δ(18 O) for HNO3 and pNO3 over ABT147, CTH110, and WST109
CASTNET sites. Calculated δ(18 O) using base (black) and optimized (gray) GEOS-Chem are shown in the plot together. Bars indicate the
residuals between calculation and observation.

Table 2. Summary of the residuals between observed and calculated oxygen isotope deltas by season using the base and optimized GEOS-
Chem, respectively.

                           Residuals               1(17 O, HNO3 )    1(17 O, pNO3 )    δ(18 O, HNO3 )   δ(18 O, pNO3 )
               Base GEOS-Chem            Annual             4.1 ‰             2.3 ‰           15.5 ‰          15.9 ‰
                                         Cold               6.2 ‰             1.7 ‰           23.1 ‰          20.4 ‰
                                         Warm               2.0 ‰             2.8 ‰            7.9 ‰          11.4 ‰
               Optimized GEOS-Chem       Annual             2.0 ‰             1.7 ‰            6.2 ‰          10.4 ‰
                                         Cold               2.3 ‰             1.4 ‰            5.7 ‰          13.2 ‰
                                         Warm               1.8 ‰             2.0 ‰            6.7 ‰           7.7 ‰

which accounts for 50 % (Fig. 8), followed by NO2 + OH                 After optimization, the dominant pathway for nitrate for-
(31 %) and RONO2 hydrolysis (13 %) across all CASTNET                mation in GEOS-Chem changed compared to the base case.
sites. Nitrate production via the reaction of XNO3 hydrolysis        For 1(17 O, pNO3 ), NO2 + OH (60 %) was the dominant
and NO3 + HC was small (< 1 %) at all sites. Strong season-          pathway for nitrate formation in the optimized GEOS-Chem
ality in nitrate production was observed, as expected, with          calculation, followed by N2 O5 hydrolysis (31 %) and NO3
high portions of N2 O5 hydrolysis in winter and NO2 + OH             hydrolysis (4 %; Fig. 8). At the same time, 1(17 O, HNO3 )
in summer (Fig. 8).                                                  was almost entirely driven by NO2 + OH reaction (98 %)

https://doi.org/10.5194/acp-23-4203-2023                                              Atmos. Chem. Phys., 23, 4203–4219, 2023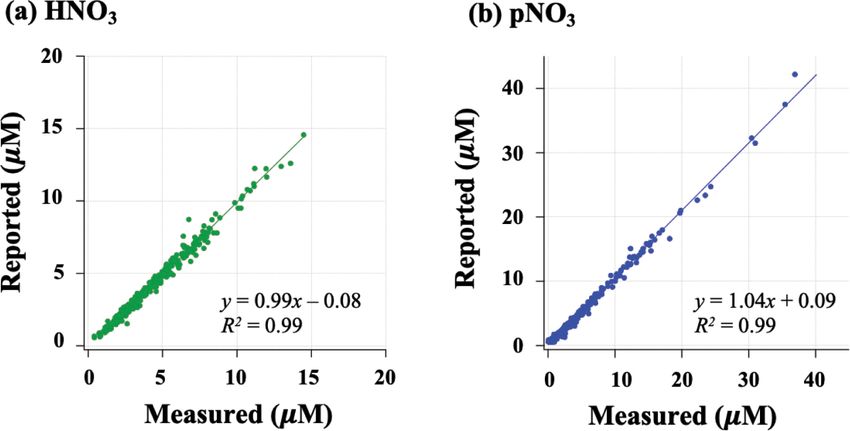
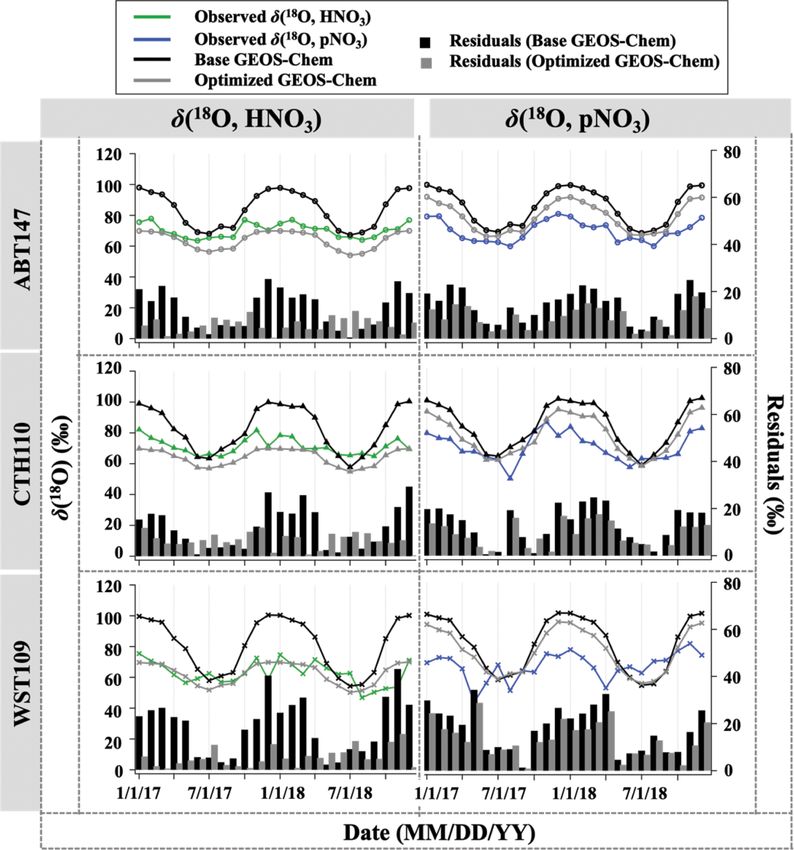
4212                                                             H. Kim et al.: Nitrate chemistry in the northeast US – Part 2

Figure 6. Relationship between the monthly mean (δ(18 O) and
1(17 O)) for observed HNO3 (green) and pNO3 (blue) across all
CASTNET sites, with correlation coefficient (R 2 ) and slope.

in the optimized GEOS-Chem case (Fig. 8). The optimized
GEOS-Chem calculations suggest that the fraction of ni-
trate produced by N2 O5 hydrolysis was significantly over-
estimated in the GEOS-Chem base case. In the base case,
N2 O5 hydrolysis dominated nitrate production, especially in
the cold season, with a fraction of over 68 % at all CAST-
NET sites (Fig. 8). This may also partly explain major nitrate
concentration overestimates, particularly in the cold season.

3.4    Modeling δ (18 O) of atmospheric nitrate

The GEOS-Chem model δ(18 O) was also calculated in the
same manner as 1(17 O) (Fig. 5). Unlike the calculated
1(17 O), calculated δ(18 O) showed remarkably positive bi-
ases compared with measured δ(18 O) of HNO3 (B = 22 %)            Figure 7. Correlation between observed and calculated 1(17 O) for
and pNO3 (B = 21 %). The averaged residuals for δ(18 O,           HNO3 and pNO3 using base GEOS-Chem (black) and optimized
HNO3 ) at each site were 13.9 ‰, 12.9 ‰, and 19.6 ‰, and          GEOS-Chem (gray) for each site.
for δ(18 O, pNO3 ) they were 15.4 ‰, 14.2 ‰, and 18.2 ‰ at
ABT147, CTH110, and WST109, respectively (Fig. 5, Ta-
ble 2). Modeling the δ(18 O) values of nitrate is more chal-      ous results. As with 1(17 O), a slope of the regression line
lenging than for 1(17 O) because not all oxidant δ(18 O) val-     between (optimized) calculated and observed δ(18 O) became
ues have been directly observed, and fractionation factors as-    closer to 1 (i.e., from 0.30 to 0.74 for HNO3 and from 0.39
sociated with the O transfer into NOy products are unknown.       to 0.49 for pNO3 ; Fig. 9), and residuals improved at each site
Uncertainty in δ(18 O) values could be a major factor causing     after the optimization (Fig. 5). Overall, the optimized GEOS-
disagreement between observed and calculated δ(18 O). Ad-         Chem δ(18 O) calculation showed better agreement than the
ditionally, uncertainties in the gas-phase and aerosol scheme     base GEOS-Chem model (B = −6 % for δ(18 O, HNO3 ), and
related to tNO3 production in GEOS-Chem could account             B = 13 % for δ(18 O, pNO3 )). The most significant improve-
for the discrepancy. Still, as with 1(17 O), the calculated       ment, as shown by the residuals, is during the cold season.
δ(18 O) showed far more disagreement with observations dur-
ing cooler months than during warmer months (Table 2).
   Newly optimized nitrate production in GEOS-Chem was
also applied to δ(18 O) calculation and compared with previ-

Atmos. Chem. Phys., 23, 4203–4219, 2023                                             https://doi.org/10.5194/acp-23-4203-2023
H. Kim et al.: Nitrate chemistry in the northeast US – Part 2                                                                   4213

Figure 8. Relative proportions for major nitrate production pathways by season from base GEOS-Chem output (HNO3 + pNO3 ), optimized
GEOS-Chem for HNO3 production only, and optimized GEOS-Chem for pNO3 production only based on comparison with observations
across the three CASTNET sites. Annual refers to the full 2-year record (December 2016–December 2018). The cold and warm seasons refer
to October–March and April–September, respectively.

3.5 δ (18 O) optimization of atmospheric oxidants                    values when assuming a value of 11.1 ‰ (vs. the well-known
                                                                     23 ‰). Since atmospheric O2 is incorporated into nitrate via
After optimization of relative nitrate production rates in           NO oxidation by HO2 and RO2 radicals, it was assumed that
GEOS-Chem based on 1(17 O), we applied the optimized                 the δ(18 O) value of RO2 and HO2 is equal to O2 , such that
chemical production to calculate δ(18 O) but still observed          this does not consider any potential isotope effects associated
discrepancy between observed and predicted δ(18 O). The              with HO2 and RO2 formation and reaction with NO. The
discrepancy could be related to variable and somewhat un-            optimized value of 11 ‰ reflects the O atom derived from
constrained δ(18 O) values of atmospheric oxidants important         RO2 /HO2 reactions incorporated into NO2 . Thus, our opti-
for nitrate formation. To test this, the assumed (literature)        mized value might suggest that RO2 /HO2 singly substituted
δ(18 O) values of oxidants were optimized by selecting the           with 18 O (e.g., R18 O16 O, H18 O16 O) reacts slower than the
best linear fit between the observations and calculated δ(18 O,      16 O isotopologues (e.g., R16 O or H16 O ).
                                                                                                     2          2
HNO3 , pNO3 ) (Fig. 10). After optimization for δ(18 O) of              The observed δ(18 O) of O3 and OH for the CASTNET
oxidants, the discrepancy between observation and calcula-           samples were the best fit with calculated δ(18 O) when assum-
tion was dramatically reduced (Fig. 9), with a decrease in B         ing values of 89.9 ‰ for δ(18 O, O3 ) and 42.2 ‰ for δ(18 O,
from 21 % to 1 %. The optimization predicted δ(18 O) of H2 O         OH), respectively. In the previous section, we noted that
values similar to what was expected (−6.5 ‰ vs. −6.0 ‰);             NO2 + OH and N2 O5 hydrolysis reactions were the domi-
however, different values were predicted for δ(18 O) of O2 ,         nant pathways for nitrate formation, indicating that OH and
OH, and O3 (Table 3). A typical mid-latitude value (−6 ‰)            O3 play an important role in determining the δ(18 O) value
of δ(18 O, H2 O) was selected in this study. We note that the        in nitrate. Indeed, optimizing δ(18 O) values to find the best
δ(18 O, H2 O) will vary seasonally; however, the calculated          agreement between observation and calculation is largely de-
δ(18 O) value of nitrate was insensitive to this value because       pendent on δ(18 O) values of O3 and OH (see also Table 3).
of the relatively minor contribution of H2 O to O atoms of           The optimized δ(18 O, O∗3 ) value (89.9 ‰) was lower than
atmospheric nitrate. For δ(18 O) of O2 , OH, and O3, it is pos-      the average reported δ(18 O, O∗3 ) ((∼ 126 ± 12) ‰; Vicars and
sible that this reflects isotope effects associated with the in-     Savarino, 2014), though the δ(18 O, O3 ) is known to vary
corporation of these oxidants during nitrate production rather       with temperature and pressure and could also potentially be
than further issues with model chemistry, since the relative         fractionated during reactions (Brenninkmeijer et al., 2003).
production rates here are constrained based on 1(17 O). The          For example, Walters and Michalski (2016) calculated an
δ(18 O, O2 ) was the best fit with calculated δ(18 O) of nitrate

https://doi.org/10.5194/acp-23-4203-2023                                             Atmos. Chem. Phys., 23, 4203–4219, 2023
4214 H. Kim et al.: Nitrate chemistry in the northeast US – Part 2
Table 3. δ(18 O) values for each oxidant before and after optimization based on different scenarios.
Optimized δ(18 O) (‰)
Atmospheric oxidants Assumed δ(18 O) (‰)
Non-fixed Fixed O∗3 Fixed O∗3 and H2 O Fixed O∗3 , H2 O, and O2
O∗3 126.3 89.9 – – –
H2 O −6.0 −6.5 −180.7 – –
O2 /RO2 /HO2 23.0 11.1 40.9 44.4 –
OH −43.0 42.2 −31.3 −39.4 −36
isotopic enrichment factor near −20 ‰ associated with O3
transfer in its reaction with NO, which would lower the trans-
ferable δ(18 O) of O3 , consistent with our predictions. The
isotope effect for NO + O3 reaction is the only one currently
known; in other words, no other δ(18 O) isotope effects as-
sociated with O3 reaction with NOy (e.g., NO2 + O3 ) have
been calculated. Further, there is potential for equilibrium
isotope effects between N2 O5 , NO2 , and NO3 that could also
impart a mass-dependent δ(18 O) fractionation. While diffi-
cult to pinpoint the exact isotope effects occurring, our opti-
mized value predicts an elevated δ(18 O) value derived from
O3 compared to the other oxidants, consistent with our ex-
pectation.
For δ(18 O, OH), the optimized value dramatically in-
creased compared to the initial assumed value (−43.0 ‰).
The initial δ(18 O, OH) value is based on several assump-
tions that may not be correct regarding isotope exchange
with H2 O(g). Additionally, Fang et al. (2021) suggested that
δ(15 N) of nitrate is largely controlled by an isotope effect
in the NO2 + OH pathway, and it could be conceivable that
δ(18 O) may be affected by a similar isotope effect as well.
Overall, the optimization of δ(18 O, OH) is highly dependent
on the δ(18 O, O∗3 ) (see Table 3), which makes sense given
the proportional control of the NO2 + OH and N2 O5 hydrol-
ysis reactions. Despite the uncertainty in the transferrable
δ(18 O) from major oxidants, the comparisons between pre-
dicted and observed δ(18 O) and 1(17 O) both suggest a larger
relative importance of NO2 + OH chemistry than reflected
in the model simulations. We note here that this finding is
consistent with our companion study (Bekker et al., 2023) of
δ(15 N, HNO3 ) and δ(15 N, pNO3 ) as well.
Overall, the observed differences in the oxygen isotopic
composition of HNO3 and pNO3 , the observed relation-
ships of δ(18 O) and 1(17 O) in the different nitrate phases,
and the significant mismatch with the global model base
case challenge our current representation of nitrate chem-
istry in atmospheric chemistry models. Generally, the GEOS-
Figure 9. Correlation between observed and calculated δ(18 O) for Chem 1(17 O) simulations were biased high relative to ob-
HNO3 and pNO3 by each site. Calculated δ(18 O) values using base servations, indicating the over-incorporation of O3 during
GEOS-Chem, optimized GEOS-Chem, and optimized δ(18 O) val-
nitrate formation. The largest discrepancies in the model-
ues indicated as black, gray, and green (for HNO3 ) or blue (for
pNO3 ), respectively.
observation comparisons, particularly for pNO3 , occur in
winter. Our optimized chemistry, constrained by the ob-
served δ(18 O) and 1(17 O), suggested that the heterogenous
Atmos. Chem. Phys., 23, 4203–4219, 2023 https://doi.org/10.5194/acp-23-4203-2023H. Kim et al.: Nitrate chemistry in the northeast US – Part 2 4215
Figure 10. Time series of observed and calculated δ(18 O) for HNO3 and pNO3 for ABT147, CTH110, and WST109 sites. Calculated δ
(18 O) using base GEOS-Chem (black) and using optimized δ(18 O) values (gray) are shown in the plot together.
production of nitrate via N2 O5 chemistry is currently signif- for atmospheric nitrate in the northeastern US. We also ob-
icantly overestimated. While our focus is on the northeast- served nitrate-phase differences in 1(17 O) and δ(18 O), which
ern US, an area of important environmental change due to are not captured in current models. Further investigation of
regulated emission reductions, this finding has implications size-segregated nitrate chemistry is recommended to improve
for the global modeling of atmospheric nitrate and oxidation model prediction of nitrate formation.
chemistry. Additionally, this finding has important implications for
predicting oxidation chemistry in the atmosphere. For in-
stance, the production of nitrate via heterogeneous hydrol-
4 Conclusions
ysis of N2 O5 represents a radical termination process, such
that a much-reduced importance of this reaction could yield
Using a combination of concentration and isotopic analy-
more radical chemistry with an impact on oxidant concentra-
ses, we evaluated atmospheric nitrate formation pathways in
tions. Indeed, an important mechanism for converting NOx to
the northeastern US in 2017–2018. The GEOS-Chem model
atmospheric nitrate could affect control of the oxidizing effi-
showed large positive biases for HNO3 and pNO3 concen-
ciency, which directly influences the atmospheric oxidation
trations, an important issue that is common in atmospheric
budget and many atmospheric pollutants’ (notably green-
chemistry models. The observed oxygen isotopic composi-
house gases’) lifetimes in the atmosphere. Thus, better con-
tions (1(17 O) and δ(18 O)) revealed a more important rela-
straining their chemistries and feedbacks is crucial to under-
tive role of NO2 +OH chemistry and indicated that the model
chemistry overpredicted heterogeneous hydrolysis of N2 O5
https://doi.org/10.5194/acp-23-4203-2023 Atmos. Chem. Phys., 23, 4203–4219, 20234216 H. Kim et al.: Nitrate chemistry in the northeast US – Part 2
standing atmospheric nitrate production pathways and their References
connection to atmospheric oxidation chemistry.
Traditionally, 1(17 O) has been used to quantitatively as-
sess nitrate production pathways. The use of δ(18 O) as well
Alexander, B., Hastings, M. G., Allman, D. J., Dachs, J., Thorn-
can enhance our understanding of the oxidants contributing
ton, J. A., and Kunasek, S. A.: Quantifying atmospheric nitrate
to nitrate formation, particularly for distinguishing oxidants formation pathways based on a global model of the oxygen iso-
that have similar 1(17 O) values (i.e., all are near 0 ‰ ex- topic composition (117 O) of atmospheric nitrate, Atmos. Chem.
cept ozone). However, our study also observed a discrepancy Phys., 9, 5043–5056, https://doi.org/10.5194/acp-9-5043-2009,
between observed and calculated δ(18 O) values, even after 2009.
accounting for an optimized chemical production based on Alexander, B., Sherwen, T., Holmes, C. D., Fisher, J. A., Chen,
1(17 O). The best match of the observations suggests that Q., Evans, M. J., and Kasibhatla, P.: Global inorganic nitrate
the transferrable δ(18 O) values of oxidants may vary more production mechanisms: comparison of a global model with ni-
than is currently suggested in the literature. Improved con- trate isotope observations, Atmos. Chem. Phys., 20, 3859–3877,
straints, particularly on the isotopic composition of OH and https://doi.org/10.5194/acp-20-3859-2020, 2020.
variability in δ(18 O, O3 ), would add critical value to mod- Amos, H. M., Jacob, D. J., Holmes, C. D., Fisher, J. A., Wang,
Q., Yantosca, R. M., Corbitt, E. S., Galarneau, E., Rutter, A. P.,
eling and interpretation of major oxidation chemistry in the
Gustin, M. S., Steffen, A., Schauer, J. J., Graydon, J. A., Louis,
atmosphere. V. L. St., Talbot, R. W., Edgerton, E. S., Zhang, Y., and Sunder-
land, E. M.: Gas-particle partitioning of atmospheric Hg(II) and
its effect on global mercury deposition, Atmos. Chem. Phys., 12,
Data availability. Data presented in this article are available on the 591–603, https://doi.org/10.5194/acp-12-591-2012, 2012.
Harvard Dataverse at https://doi.org/10.7910/DVN/X6BB1I (Wal- Ashbaugh, L. L. and Eldred, R. A.: Loss of Particle Ni-
ters, 2022) and the US EPA CASTNET database (http://www.epa. trate from Teflon Sampling Filters: Effects on Mea-
gov/castnet, U.S. Environmental Protection Agency Clean Air Mar- sured Gravimetric Mass in California and in the IM-
kets Division Clean Air Status and Trends Network, 2022). PROVE Network, J. Air Waste Manage., 54, 93–104,
https://doi.org/10.1080/10473289.2004.10470878, 2004.
Bates, K. H. and Jacob, D. J.: A new model mechanism for atmo-
Author contributions. HK, WWW, and MGH designed the vary- spheric oxidation of isoprene: global effects on oxidants, nitro-
ing aspects of the study. CB and WWW carried out the laboratory gen oxides, organic products, and secondary organic aerosol, At-
measurements. HK interpreted data, conducted statistical analysis, mos. Chem. Phys., 19, 9613–9640, https://doi.org/10.5194/acp-
and analyzed model results. LTM contributed GEOS-Chem simula- 19-9613-2019, 2019.
tions. HK and WWW prepared the article with contributions from Bekker, C., Walters, W. W., Murray, L. T., and Hastings, M.
all co-authors. G.: Nitrate chemistry in the northeast US – Part 1: Nitro-
gen isotope seasonality tracks nitrate formation chemistry, At-
mos. Chem. Phys., 23, 4185–4201, https://doi.org/10.5194/acp-
Competing interests. The contact author has declared that none 23-4185-2023, 2023.
of the authors has any competing interests. Bey, I., Jacob, D. J., Yantosca, R. M., Logan, J. A., Field,
B. D., Fiore, A. M., Li, Q., Liu, H. Y., Mickley, L.
J., and Schultz, M. G.: Global modeling of tropospheric
Disclaimer. Publisher’s note: Copernicus Publications remains chemistry with assimilated meteorology: Model description
neutral with regard to jurisdictional claims in published maps and and evaluation, J. Geophys. Res.-Atmos., 106, 23073–23095,
institutional affiliations. https://doi.org/10.1029/2001JD000807, 2001.
Breider, T. J., Mickley, L. J., Jacob, D. J., Ge, C., Wang, J., Payer
Sulprizio, M., Croft, B., Ridley, D. A., McConnell, J. R., and
Sharma, S.: Multidecadal trends in aerosol radiative forcing over
Acknowledgements. We thank Ruby Ho for sampling and lab-
the Arctic: Contribution of changes in anthropogenic aerosol to
oratory assistance. We are grateful to the US EPA CASTNET pro-
Arctic warming since 1980, J. Geophys. Res.-Atmos., 22, 3573–
gram and staff for their cooperation in this study and their assistance
3594, https://doi.org/10.1002/2016JD025321, 2017.
with receiving archived samples for isotopic analysis.
Brenninkmeijer, C. A., Janssen, C., Kaiser, J., Röckmann, T., Rhee,
T. S., and Assonov, S. S.: Isotope effects in the chemistry of
atmospheric trace compounds, Chem. Rev., 103, 5125–5162,
Financial support. This research has been supported by the Na- https://doi.org/10.1021/cr020644k, 2003.
tional Science Foundation (AGS-2002750), Institute at Brown for Camargo, J. A. and Alonso, Á.: Ecological and toxicologi-
Environment and Society Seed Grant, and Voss Environmental Fel- cal effects of inorganic nitrogen pollution in aquatic ecosys-
lowship from the Institute at Brown for Environment and Society. tems: a global assessment, Environ. Int., 32, 831–849,
https://doi.org/10.1016/j.envint.2006.05.002, 2006.
Carter, T. (Tess) S., Joyce, E. E., and Hastings, M. G.:
Review statement. This paper was edited by Jan Kaiser and re- Quantifying Nitrate Formation Pathways in the Equato-
viewed by Pete D. Akers and one anonymous referee. rial Pacific Atmosphere from the GEOTRACES Peru-
Atmos. Chem. Phys., 23, 4203–4219, 2023 https://doi.org/10.5194/acp-23-4203-2023You can also read