Long-term multi-source data analysis about the characteristics of aerosol optical properties and types over Australia
←
→
Page content transcription
If your browser does not render page correctly, please read the page content below
Atmos. Chem. Phys., 21, 3803–3825, 2021
https://doi.org/10.5194/acp-21-3803-2021
© Author(s) 2021. This work is distributed under
the Creative Commons Attribution 4.0 License.

Long-term multi-source data analysis about the characteristics of
aerosol optical properties and types over Australia
Xingchuan Yang, Chuanfeng Zhao, Yikun Yang, and Hao Fan
State Key Laboratory of Earth Surface Processes and Resource Ecology, and College of Global Change and Earth System
Science, Beijing Normal University, Beijing, China

Correspondence: Chuanfeng Zhao (czhao@bnu.edu.cn)

Received: 2 September 2020 – Discussion started: 6 October 2020
Revised: 13 January 2021 – Accepted: 29 January 2021 – Published: 15 March 2021

Abstract. The spatiotemporal distributions of aerosol opti-       aerosols. The nine ground-based AERONET sites over Aus-
cal properties and major aerosol types, along with the ver-       tralia showed that the mixed type of aerosols (biomass burn-
tical distribution of major aerosol types over Australia, are     ing and dust) is dominant in all seasons. Moreover, Cloud-
investigated based on multi-year Aerosol Robotic Network          Aerosol Lidar and Infrared Pathfinder Satellite Observa-
(AERONET) observations at nine sites, the Moderate Res-           tions (CALIPSO) showed that polluted dust is the dominant
olution Imaging Spectroradiometer (MODIS), Modern-Era             aerosol type detected at heights 0.5–5 km over the Australian
Retrospective analysis for Research and Applications, Ver-        continent during all seasons. The results suggested that Aus-
sion 2 (MERRA-2), Cloud-Aerosol Lidar with Orthogonal             tralian aerosol has similar source characteristics due to the re-
Polarization (CALIOP), and back-trajectory analysis from          gional transport over Australia, especially for biomass burn-
the Hybrid Single-Particle Lagrangian Integrated Trajectory       ing and dust aerosols. However, the dust-prone characteristic
(HYSPLIT). During the observation period from 2001–2020,          of aerosol is more prominent over central Australia, while
the annual aerosol optical depth (AOD) at most sites showed       the biomass-burning-prone characteristic of aerosol is more
increasing trends (0.002–0.029 yr−1 ), except for that at three   prominent in northern Australia.
sites, Canberra, Jabiru, and Lake Argyle, which showed de-
creasing trends (−0.004 to −0.014 yr−1 ). In contrast, the
annual Ångström exponent (AE) showed decreasing ten-
dencies at most sites (−0.045 to −0.005 yr−1 ). The results       1   Introduction
showed strong seasonal variations in AOD, with high val-
ues in the austral spring and summer and relatively low val-      Aerosols play a crucial role in the Earth’s radiation budget
ues in the austral fall and winter, and weak seasonal vari-       and climate change, both through direct interaction with the
ations in AE, with the highest mean values in the austral         solar radiation and through indirectly modifying the opti-
spring at most sites. Monthly average AOD increases from          cal properties and lifespan of clouds (Albrecht, 1989; Charl-
August to December or the following January and decreases         son et al., 1992; Garrett and Zhao, 2006; Ramanathan et al.,
during March–July. Spatially, the MODIS AOD showed ob-            2001; Twomey, 1977; Zhao and Garrett, 2015; Zhao et al.,
vious spatial heterogeneity, with high values appearing over      2018). In addition, elevated aerosols degrade air quality and
the Australian tropical savanna regions, Lake Eyre Basin,         visibility, causing an adverse impact on human health and
and southeastern regions of Australia, while low values ap-       the environment (Luhar et al., 2008; Pope et al., 2009; Zhao
peared over the arid regions in western Australia. MERRA-2        et al., 2019; Yang et al., 2018). Therefore, the influential ef-
showed that carbonaceous aerosol over northern Australia,         fects of aerosols at both regional and global scales cannot be
dust over central Australia, sulfate over densely populated       ignored.
northwestern and southeastern Australia, and sea salt over           Australia is situated between the Pacific Ocean and In-
Australian coastal regions are the major types of atmospheric     dian Ocean in the Southern Hemisphere, with 70 % of its
                                                                  land surface occupied by arid and semi-arid regions. North-

Published by Copernicus Publications on behalf of the European Geosciences Union.
3804                                         X. Yang et al.: Long-term spatiotemporal variation of aerosol over Australia

ern Australia is characterized by tropical savanna ecosys-       rine and Biogenic Air (MUMBA) campaign (Paton-Walsh
tems, with dense grasslands and scattered shrubs or trees.       et al., 2017). In previous studies, the fire season has often
Frequent fires that occur during the dry season (typically       been the focus study period due to the significant impacts of
April–November) each year in this region have released large     biomass burning aerosol. Meanwhile, most previous studies
quantities of biomass burning aerosols into the atmosphere       have focused on aerosol properties at a specific site/region
(Radhi et al., 2012; Paton-Walsh et al., 2004). Schultz et       or short-term variations of aerosols due to the difficulty of
al. (2008) reported that Australian fires contribute almost      obtaining ground-based aerosol data (Mitchell et al., 2010;
8.25 % of global carbon emissions. Mitchell et al. (2013)        Bouya and Box, 2011). However, it is essential to charac-
demonstrated that Australia is a globally significant source     terize the national-scale and long-term aerosol optical prop-
of biomass burning aerosol from savanna burning. To the          erties, which could provide a better understanding of the
south of the savanna are huge desert regions (including Great    aerosol characteristics and their impacts on climate over Aus-
Victoria, Simpson, Gibson, and Sturt deserts) and agricul-       tralia.
tural lands that have been under the control of prolonged           Ground-based observations can provide more accurate
drought, which makes Australia a dominant dust source in         data to estimate aerosol properties, while the remote-sensing
the Southern Hemisphere (Mitchell et al., 2010). Tanaka and      technique provides a better understanding of aerosol prop-
Chiba (2006) found that the Australian annual dust emission      erties at a large scale. In this study, multi-year aerosol op-
is about 106 Tg in contrast to 1087 Tg from North Africa and     tical properties obtained from nine ground-based sun pho-
575 Tg from Asia. Luhar et al. (2008) demonstrated that the      tometers, along with the MODIS AOD product over Aus-
mean top of atmosphere (TOA) direct radiative forcing sig-       tralia, are analyzed to investigate the long-term spatiotem-
nificantly increased during the 2004 burning season. Small       poral variations of aerosol optical properties over the Aus-
et al. (2011) found that cloud fraction initially increased by   tralian continent. In addition, the MERRA-2 AOD product
25 % with increasing aerosol optical depth, followed by a        and CALIPSO aerosol profile data are used to characterize
slow systematic decrease (∼ 18 %) with higher aerosol opti-      the spatiotemporal and vertical variations of aerosol proper-
cal depth. Hence, Australian aerosol constitutes a significant   ties in the atmosphere over Australia, respectively.
component of the global aerosol budget, with great impacts          The paper is organized as follows. Section 2 describes
on regional and global climate and the radiation budget.         the AERONET (Aerosol Robotic Network) sites, data, and
   There are numerous studies that have focused on aerosol       methods. Section 3 illustrates the spatiotemporal variations
optical properties in Australia. Northern Australia is highly    in aerosol properties and the classification of aerosol types
influenced by biomass burning aerosol from wild fires dur-       and their seasonal distributions and discusses the seasonal
ing the dry season (typically April–November), while cen-        variations of aerosol vertical distributions in Australia. Sec-
tral Australia is mostly affected by dust aerosol (Yoon et       tion 4 summarizes the findings of the study.
al., 2016; Qin and Mitchell, 2009). Australian aerosol opti-
cal depth (AOD) generally increases from the austral winter
to spring then decreases from summer to fall (Mitchell et al.,   2     Sites, data, and methodology
2017). Moreover, Mitchell et al. (2017) reported a long-range
coherence in the aerosol cycle over the Australian continent     2.1    Sites
due to the similar source characteristics and intercontinental
transport. Many studies found significant decreasing trends      Australia is located in Oceania between the Indian Ocean
in AOD using ground-based or satellite remote-sensing data       and South Pacific. Australia’s topography is not too varied,
(e.g., Cloud-Aerosol Lidar and Infrared Pathfinder Satellite     most of it being desert plateau (Fig. 1a). Western Australia
Observations (CALIPSO), the Moderate Resolution Imaging          is covered by great deserts and large plains, with scattered
Spectroradiometer (MODIS), and Multiangle Imaging Spec-          shrubs and grasses. Central Australia is covered by the Cen-
troRadiometer (MISR)) over Australia (Mehta et al., 2016,        tral Lowlands, including the Great Artesian Basin (GAB).
2018; Yoon et al., 2016). There are also a lot of studies fo-    Eastern Australia is mainly composed of fertile plains along
cusing on short-term aerosol properties during environmen-       the eastern coast and the eastern highlands with dense trees
tal events, such as dust storms (Shao et al., 2007) or wild-     and grasses (Fig. 1b). Northern Australia is covered by
fires (Radhi et al., 2012; Mitchell et al., 2006), and most      tropical savanna, with dense grasses, scattered trees, and
of these studies are based on a specific site/region. In ad-     grassy woodlands (Mitchell et al., 2013). In this study, nine
dition, aerosol properties in Australia have been studied in     AERONET sites in Australia were used for analysis. Table 1
a number of field campaigns such as the Mildura Aerosol          shows the site locations and the available observation data
Tropospheric Experiment (MATE 98) (Rosen et al., 2000),          period at each site. Lake Argyle and Jabiru are located in
the Biomass Burning and Lightning Experiment Phase B             northern Australia, where biomass burning is a significant
(BIBLE-B) campaign (Takegawa et al., 2003), the Savan-           source of aerosols during the dry season. The Learmonth site
nah Fires in the Early Dry Season (SAFIRED) campaign             is located on the west coast of Australia and is situated on the
(Mallet et al., 2017), and the Measurements of Urban, Ma-        northwestern dust pathway from the Australian interior. Lake

Atmos. Chem. Phys., 21, 3803–3825, 2021                                            https://doi.org/10.5194/acp-21-3803-2021

X. Yang et al.: Long-term spatiotemporal variation of aerosol over Australia                                               3805

Table 1. Site location and data time period at each site.           retrievals falling within the expected error envelopes and
                                                                    with a small root mean squared error (RMSE; 0.07) over
 Site                 Long.        Lat.                 Time span   Oceania. As the MODIS Terra and Aqua sensors are near
 Adelaide_Site_7     138.66     −34.73     2006–2007; 2017–2020     to each other, and the same retrieval algorithms are used to
 Birdsville          139.35     −25.90                2005–2020     generate AODs, the DB algorithm shows very similar per-
 Canberra            149.11     −35.27                2003–2017     formance for the two sensors (Sayer et al.,2013). Therefore,
 Fowlers_Gap         141.70     −31.09                2013–2020     in this study, the data record named “Deep_Blue_Aerosol_
 Jabiru              132.89     −12.66     2001–2007; 2009–2020     Optical_Depth_550_Land_Best_Estimate” from the Aqua
 Lake_Argyle         128.75     −16.11                2001–2020     MODIS Collection 6.1 daily AOD product (MYD04_L2)
 Lake_Lefroy         121.71     −31.26                2012–2020     with 10 km spatial resolution from July 2002–May 2020 is
 Learmonth           114.10     −22.24                2017–2020
                                                                    used to examine the spatiotemporal variations of aerosol
 Lucinda             146.39     −18.52     2009–2010; 2013–2020
                                                                    optical properties in Australia.

                                                                    2.2.3   MERRA-2 data
Lefory is located in the southwest of Australia and next to the
Great Victoria Desert. Birdsville and Fowlers Gap are located       MERRA-2 is the NASA’s newest global atmospheric reanal-
in central Australia, exactly where the dust transport path is.     ysis product. It is produced by the Global Modeling and
Lucinda and Adelaide Site 7 are located on the eastern and          Assimilation Office (GMAO), using the Goddard Earth Ob-
southern coast of Australia, respectively. The Canberra site        serving System (GEOS-5) atmospheric data assimilation sys-
is located at the top of a hill in southeastern Australia. Note     tem. The global natural and anthropogenic aerosols are sim-
that the time periods for which data are available are different    ulated in MERRA-2 with the Goddard Chemistry, Aerosol,
among these sites.                                                  Radiation and Transport (GOCART) model (Randles et al.,
                                                                    2017). MERRA-2 assimilates aerosol optical depth (AOD)
2.2     Data
                                                                    from various ground and remote-sensed platforms, which
                                                                    include direct AOD measurements from AERONET, bias-
2.2.1    AERONET data
                                                                    corrected AOD retrievals from the Advanced Very High
The AERONET is a ground-based remote-sensing aerosol                Resolution Radiometer (AVHRR) instruments, and AOD re-
network which measures direct solar and diffuse sky radi-           trievals from the MISR and the MODIS over bright sur-
ance in the spectral range of 0.34–1.02 mm (Holben et al.,          faces (Buchard et al., 2017). Buchard et al. (2017) demon-
1998). AERONET provides high-quality measurements of                strated that MERRA-2 has high reliability in simulating
aerosol optical, microphysical, and radiative properties ev-        aerosol properties. The monthly MERRA-2 and AERONET
ery 15 min. The uncertainty of the AOD from AERONET                 AOD showed good agreement, with correlation coefficients
is approximately 0.01–0.02 (Eck et al., 1999). In this study,       (R) between 0.59 and 0.94 at nine sites over Australia
level 2.0 quality-controlled and cloud-screened data of AOD,        (Fig. S1). Moreover, the RMSEs were smaller than 0.05,
Ångström exponent (AE), and single scattering albedo (SSA)          which indicated that the monthly MERRA-2 AOD prod-
are adopted. Because the AERONET quality assurance level            ucts showed good performance over Australia. Therefore,
of 2.0 is not available during 2019–2020 at a few sites, level      in this study, monthly AODs at 550 nm from MERRA-2
1.5 data are used from 2019–2020 for those sites instead.           (MERRA2_400.tavgM_2d_aer_Nx) for total aerosols and
A sensitivity analysis showed that the use of level 1.5 data        different aerosol species during the period from July 2002–
should not affect the trend analysis since they show similar        May 2020 are used to analyze their spatiotemporal variations.
trends for the period of 2001–2018 when both datasets are
available.                                                          2.2.4   CALIPSO data

2.2.2    MODIS data                                                 The CALIPSO satellite was launched on 28 April 2006.
                                                                    It is a dual-wavelength (532 and 1064 nm) polarization
The Moderate Resolution Imaging Spectroradiometer                   lidar designed to measure the global vertical profile of
(MODIS) instrument is a multispectral sensor with 36 bands          aerosols and clouds (Winker et al., 2003). CALIPSO pro-
between 400 and 1440 nm on board the Aqua and Terra                 vides vertical profiles data of the attenuated backscatter
platforms (Remer et al., 2005). MODIS provides two kinds            at 532 and 1064 nm and the perpendicular polarization
of long-term aerosol products, the Level-2 daily products           component at 532 nm during both day and night. Omar
at 10 and 3 km resolutions and Level-3 daily, 8 d, and              et al. (2013) investigated the performance of CALIPSO
monthly products with a 1◦ × 1◦ horizontal resolution. Sayer        AOD data and found that when cloud-cleared and extinc-
et al. (2014) showed that the MODIS Deep Blue (DB)                  tion quality-controlled CALIPSO data were compared
algorithm can retrieve ∼ 1.6 times more AODs than the               with AERONET data with AOD less than 1.0, the mean
Dark Target (DT) algorithm, with more than 82 % of AOD              relative difference between the two measurements was

https://doi.org/10.5194/acp-21-3803-2021                                            Atmos. Chem. Phys., 21, 3803–3825, 2021
3806                                             X. Yang et al.: Long-term spatiotemporal variation of aerosol over Australia

Figure 1. Terrain elevation of Australia and the nine AERONET sites used are indicated by a black star (a). Land cover type in 2015 of Aus-
tralia using the Dynamic Land Cover Dataset (DLCD) Version 2.1 dataset (b). Note that the Australian DEM data are provided by the Aus-
tralian public data website (https://data.gov.au/data/, last access: 31 January 2021). The Dynamic Land Cover Dataset (DLCD) is provided by
Geoscience Australia (http://www.ga.gov.au/scientific-topics/earth-obs/accessing-satellite-imagery/landcover, last access: 31 January 2021).

25 % of AERONET AOD. In addition, they found that                       vertical variations of different aerosol species over Australia.
the CALIPSO AOD has good correlation (r = 0.65) with                    Table 2 provides detailed information about the data used in
AERONET AOD at Lake Argyle in northern Australia. In                    this study. Different aerosol types have diverse optical, phys-
this study, a globally gridded monthly product derived from             ical, and chemical properties, with different impacts on the
the CALIPSO Version 4.2 Level 3 aerosol profile product                 atmosphere (Charlson et al., 1992). Furthermore, the clas-
(CAL_LID_L3_Tropospheric_APro_CloudFree-Standard-                       sification of aerosol can provide a key clue to the leading
V4-20) is used to investigate the vertical distributions                source of regional aerosols. Two methods from Kaskaoutis et
of different aerosol species in Australia. The data have                al. (2007) and Giles et al. (2012) are adopted to distinguish
208 layers with 60 m vertical resolution for heights up to              aerosol types using the AOD at 500 nm, AE at 440–870 nm,
12.1 km above mean sea level.                                           and SSA at 440 nm, which are derived from AERONET,
                                                                        as illustrated in Fig. 2. As a result, five prominent types of
2.2.5    ERA-5 data                                                     aerosols such as biomass burning, clean marine aerosol, ur-
                                                                        ban/industrial aerosol, dust, and mixed-type aerosol can be
ERA-5 is the latest atmospheric reanalysis data developed by            obtained. Back trajectory analysis is conducted to identify
the European Centre for Medium-Range Weather Forecasts                  the main transport pathways of air masses. The 72 h back
(ECWMF). ERA-5 has a great improvement in horizontal                    trajectories at an altitude of 500 m above ground level (a.g.l.)
and vertical resolutions in comparison to ERA-Interim and               are simulated using the Hybrid Single-Particle Lagrangian
covers the period from 1979 onward (Albergel et al., 2018).             Integrated Trajectory (HYSPLIT) model (Draxler and Hess,
In this study, monthly ERA-5 data, including the u wind, v              1998). Moreover, the back trajectories are calculated every
wind, and precipitation, were obtained from the Copernicus              6 h a day at nine AERONET sites during the period 2005–
Climate Change Service (C3S).                                           2020. Note that we have employed the TrajStat module from
                                                                        Meteoinfo version 2.4.1 to cluster the back trajectories using
2.3     Methodology                                                     the Euclidean distance method (http://meteothink.org/docs/
                                                                        trajstat/index.html, last access: 31 January 2021).
The AERONET observations, including the total, fine-mode,
and coarse-mode AOD at 500 nm, AE at 500 and at 440–
870 nm, and SSA at 440 mm, and the MODIS AOD prod-
ucts are utilized to examine the spatiotemporal variations of
aerosol properties over Australia. MERRA-2 and CALIPSO
AOD products are analyzed to present the spatiotemporal and

Atmos. Chem. Phys., 21, 3803–3825, 2021                                                    https://doi.org/10.5194/acp-21-3803-2021
X. Yang et al.: Long-term spatiotemporal variation of aerosol over Australia                                                     3807

Table 2. Summary of datasets used in this study.

    Instrument/product   Dataset name                                                     Resolution                         Period
    AERONET              AOD; AE; SSA                                                     15 min, site              2001.10–2020.5
    MODIS                Deep_Blue_Aerosol_Optical_Depth_550_Land_ Best_ Estimate         Daily, 0.1◦ × 0.1◦         2002.7–2020.5
    MERRA-2              MERRA2_400.tavgM_2d_aer_Nx                                       Monthly, 0.625◦ × 0.5◦     2002.7–2020.5
    CALIPSO              CAL_LID_L3_Tropospheric_APro_CloudFree-Standard-V4-20            Monthly, 5◦ × 2◦           2006.6–2020.5
    ERA-5                10 m v component of wind; 10 m u component of wind               Monthly, 0.25◦ × 0.25◦     2002.7–2020.5
    GDAS                 Global Data Assimilation System 1◦ × 1◦                          Daily, 1◦ × 1◦             2005.1–2020.5

                                                                      dust activities (Mitchell et al., 2010). In particular, the high-
                                                                      est AOD (0.20) at Canberra was observed in 2003 followed
                                                                      by a decrease to 0.06 in 2004. This was mostly related to the
                                                                      wildfires of southeastern Australia in January 2003, which
                                                                      generated large amounts of smoke aerosols, leading to a max-
                                                                      imum in AOD during that observation period (Mitchell et al.,
                                                                      2006). Among the six sites with the increasing trend of AOD,
                                                                      Fowlers Gap had a more evident AOD increasing trend of
                                                                      0.029 ± 0.060 yr−1 during the period 2013–2020. It is worth
                                                                      mentioning that significant increases of AOD are observed
Figure 2. Schematic diagrams of the aerosol classifications defined   during the period 2019–2020 at most sites, such as Adelaide
in Kaskaoutis et al. (2007) (a) and Giles et al. (2012) (b).          Site 7, Birdsville, Fowlers Gap, and Lucinda. The increases
                                                                      in AOD were related to the frequent fire activities in Australia
                                                                      from September 2019–January 2020. In addition, optical and
3     Results and discussion                                          physical properties of aerosols during the Australia wildfires
                                                                      in 2019 will be investigated in detail in our future study. The
3.1     Spatiotemporal variation of aerosol optical                   annual means of AE were 0.80–1.30 over Australia. The an-
        properties                                                    nual AE showed decreasing trends at most sites during the
                                                                      observation period from 2001–2020 except for Lake Lefory,
3.1.1    Long-term variations and trends of aerosol                   at which it showed an increasing trend of 0.003 ± 0.217 yr−1 .
         optical properties                                           This result indicated that the size of aerosol particles in-
                                                                      creased at Lake Lefory, while the size of the aerosol de-
The annual variations and linear trends of AOD and AE at              creased at other sites. However, the temporal trends for an-
the nine sites over Australia are shown in Fig. 3. The an-            nual AE did not pass the significance tests at all sites during
nual means of AOD were 0.05–0.15 over Australia, which                the observation period from 2001–2020. The annual AODs at
indicates the generally excellent air quality over Australia.         Jabiru (0.15) and Lake Argyle (0.13) were higher than those
It showed an increasing tendency in the annual mean AOD               at other sites (0.05–0.10) in Australia. Moreover, the AE val-
at most sites in Australia during the observation period              ues at Jabiru (1.23) and Lake Argyle (1.29) were higher than
from 2001–2020, except for the sites of Canberra, Jabiru,             those at other sites (0.80–1.20) except for Canberra (1.30).
and Lake Argyle, at which the annual mean AOD showed                  This can be explained by the extensive and frequent wild-
a decreasing trend of −0.004 ± 0.033, −0.002 ± 0.035,                 fires over the tropical north of Australia. Moreover, the an-
−0.004 ± 0.057 yr−1 , respectively. There were no statisti-           nual AOD and AE at Jabiru and Lake Argyle presented sig-
cally significant trends at all sites during the observation pe-      nificant interannual variations in amplitude. Similar results
riod from 2001–2020 except for the sites of Birdsville and            have also been reported by Radhi et al. (2012) and Mitchell et
Fowlers Gap. The general AOD decrease at sites over north-            al. (2013). This is likely a consequence of the relatively high
ern Australia and the general increase at sites over central          rainfall during the wet season and large smoke emissions dur-
Australia are consistent with the findings obtained by Mehta          ing the subsequent burning season. The rainfall likely sup-
et al. (2016) using the MODIS and MISR AOD dataset dur-               pressed the smoke emissions due to the high level of moisture
ing the period 2001–2014 and Mitchell et al. (2010) using             in the air, but it also promoted the growth of vegetation, lead-
site observations over the decade 1997–2007. The decreas-             ing to an increase in smoke emissions during the subsequent
ing annual trends over northern Australia could be associated         dry seasons (Mitchell et al., 2013).
with the decreases in black carbon and organic carbon AODs               The spatial distribution of annual averaged (Fig. 4a–s) and
(Yoon et al., 2016). However, increasing AOD trends over              multi-year averaged (Fig. 4t) MODIS AODs for the years of
central Australia could be mainly attributed to the increase of

https://doi.org/10.5194/acp-21-3803-2021                                               Atmos. Chem. Phys., 21, 3803–3825, 2021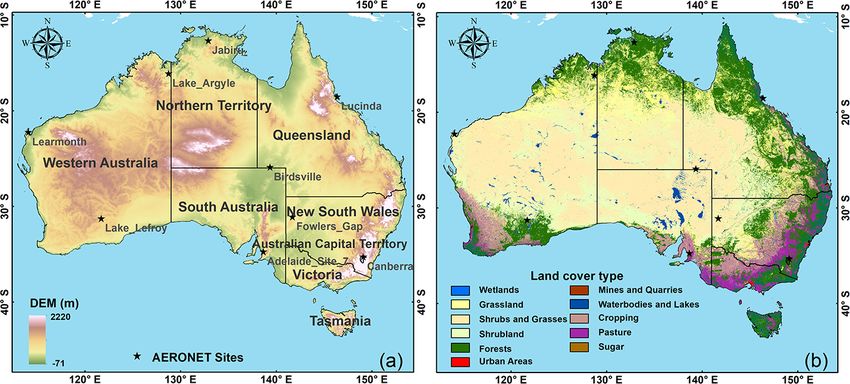
3808                                            X. Yang et al.: Long-term spatiotemporal variation of aerosol over Australia

Figure 3. Temporal variations of annual mean AOD and AE at nine AERONET sites in Australia. Note that “∗ ” means the confidence test is
passed at α = 0.05. “P ” is the p value.

2002–2020 indicates that, overall, the patterns of AOD spa-           annual variations. Mehta et al. (2016) also reported a de-
tial distributions were similar from 2002–2020. However, the          creasing trend in AOD over Australia from 2006–2016 using
magnitude of the spatial AOD distributions varied to some             CALIPSO data. Although the data for the years 2002 and
extent. It is worth mentioning that the years of 2002 and             2020 were incomplete and cannot represent the statistical
2020 only covered July to December and January to May                 characteristics of AOD throughout the year, the significant
due to observation data availability, respectively. Figure 4          impact of environmental events (e.g., wildfire, dust storm) on
shows that the average annual AOD values in central and               Australian aerosol can be found from 2002–2020. In south-
eastern Australia were higher than that in western Australia.         eastern Australia, the Australian Capital Territory and Vic-
This similar spatial variability of aerosols was also captured        toria had similar annual variation characteristics in AOD,
in previous studies (Mehta et al., 2016, 2018; Yang et al.,           while New South Wales, Queensland, and South Australia
2020). AODs with values smaller than 0.04 were found in               had similar annual variation patterns of AOD. The Northern
the arid zone of western Australia, which is a sparsely pop-          Territory showed an apparent interannual variability of AOD
ulated area with low aerosol emissions. The highest AOD               compared to other states. The AODs in Tasmania and western
values were found in tropical and subtropical zones with              Australia showed no obvious long-term tendencies and inter-
dense grasses or forests, where the average AOD value was             annual variations with low values (∼ 0.03; ∼ 0.05) in com-
greater than 0.1. Furthermore, the AOD was high over the              parison with those in other states. The highest mean AOD
Central Lowlands, with the 19-year averaged AOD ranging               (∼ 0.055) over Australia was observed in the year 2002. This
from ∼ 0.02 to ∼ 0.14, which was mostly affected by the               was largely attributed to the dust storms in southern and
dust storms. It was clear that the temporal trends in AOD esti-       eastern Australia (Mitchell et al., 2010; Chan et al., 2005)
mated by AERONET and MODIS were generally consistent.                 and the biomass burning in southeastern Australia (Paton-
Furthermore, the time series of annually averaged MODIS               Walsh et al., 2004), which increased the aerosol loadings over
AOD over the Australian continent and eight main admin-               Australia. The interannual variation was small, with a mean
istrative regions during the period 2002–2020 are shown in            AOD of about 0.04 during the period 2003–2008. In partic-
Fig. 5. The time series of the yearly averaged AOD over               ular, high AOD values were observed in the Australian Cap-
Australia showed quite a small decreasing trend (−0.0003)             ital Territory (0.152) and Victoria (0.115) in 2003. This was
during the period 2002–2020, but there were still short-term          mostly caused by 2003 wildfires in southeastern Australia,

Atmos. Chem. Phys., 21, 3803–3825, 2021                                                 https://doi.org/10.5194/acp-21-3803-2021

X. Yang et al.: Long-term spatiotemporal variation of aerosol over Australia                                              3809

which generated large amounts of smoke aerosols (Mitchell        Mitchell et al. (2013) during the period 1998–2012 in north-
et al., 2006). In 2009, there were extreme dust storms in cen-   ern Australia. Further, the seasonal mean AE values were
tral Australia (Mukkavilli et al., 2019), which led to a large   greater than 1.0 over all seasons at Canberra, Jabiru, Lake Ar-
increase in AOD from 0.038 in 2008 to 0.045 in 2009. The         gyle, Fowlers Gap, and Birdsville, while the mean AE values
AOD decreased after 2009 with a mean value of about 0.036        were less than 1 over all seasons at Adelaide Site 7 and Lu-
during the period 2010–2016, and then increased from 2017–       cinda. In addition, at Learmonth and Lake Lefroy, high AE
2020. The increasing trend in AOD during the period 2017–        values (0.98–1.07) were observed in spring and fall, and low
2020 may be related to the more frequent wildfire activities     values (0.56-0.99) were observed in summer and winter.
during this period in Australia.
                                                                 3.1.3   Monthly variations of aerosol optical properties
3.1.2   Seasonal variations of aerosol optical properties
                                                                 Figure 8 depicts the monthly variations of total, fine-mode
Seasonal variations of AOD and AE at nine sites in Aus-          and coarse-mode AODs at 500 nm at nine AERONET sites in
tralia are presented in Fig. 6. It was clear that there was      Australia. Furthermore, the spatial distributions of monthly
a seasonal cycle in AOD at nine sites, with high values in       averaged MODIS AODs are shown in Fig. 9. The mean
spring and summer and low values in fall and winter. Sim-        MODIS AOD varied monthly, with high values appear-
ilarly, seasonal distributions of MODIS AOD indicated that       ing during October–January and low values appeared dur-
high AODs were observed in spring (∼ 0.048) and summer           ing June–July. Moreover, significant differences in monthly
(∼ 0.058), while low AODs were observed in fall (∼ 0.031)        AOD variations were found among regions of Australia.
and winter (∼ 0.029) (Fig. 7). The main contributors to the      Therefore, we classified the nine AERONET sites as four
high AODs in spring and summer were smoke emissions              categories based on their locations, which are (1) Jabiru and
from biomass burning, dust storms, marine emissions from         Lake Argyle in northern Australia, (2) Learmonth and Lake
the sea spray produced in breaking waves, and the natural        Lefory in western Australia, (3) Birdsville, Fowlers Gap, and
sulfate particles released from phytoplankton (Rotstayn et       Adelaide Site 7, in central Australia, and (4) Lucinda and
al., 2010). The occurrence frequency and intensity of dust       Canberra in eastern Australia. In order to avoid bisecting the
storm activities and wildfires decreased in fall and winter,     aerosol peak, the timeline was adopted from July to June
resulting in low AOD values in those two seasons over Aus-       rather than from January to December (Mitchell et al., 2017).
tralia. Furthermore, the highest seasonal average AOD values     In northern Australia, the monthly mean AODs at Jabiru
were observed in spring at Birdsville (0.09), Jabiru (0.22),     and Lake Argyle varied considerably, with the highest val-
Lake Argyle (0.23), and Lucinda (0.13), while they were ob-      ues in October (0.24; 0.26) and the lowest values in April at
served in summer at the other five sites (0.08–0.11). The        Jabiru (0.07) and June at Lake Argyle (0.05). Further, fine-
seasonal variations in AOD observed by AERONET and               mode AODs showed high values during May–December at
MODIS were in good agreement at nine sites apart from            Jabiru and during April–December at Lake Argyle. The fine-
small differences in magnitude. Mitchell et al. (2013) also      mode AODs peaked in October at Jabiru (0.17) and Lake Ar-
found that the AOD values at Wagga and Canberra peaked           gyle (0.20). These results suggested that fine-mode aerosols
in summer, while AOD values peaked in spring at sites that       dominated in the dry season at the two sites, which was
are located in the arid zone. This is due to the increasingly    mostly caused by the biomass burning in northern Australia.
forested and bushfire-prone characteristics at the more east-    In addition, Jabiru showed higher mean monthly AOD values
erly sites (Mitchell et al., 2013). Moreover, less precipita-    than Lake Argyle and a later increasing trend in fine-mode
tion and higher wind speeds during spring were observed          AOD, owing to its location closer to the coast and hence
in northern Australia (north of 18◦ S), which may lead to        to sea salt advection (Radhi et al., 2012). In western Aus-
the increase in AOD from biomass burning and long-range          tralia, the highest monthly AOD values occurred in Decem-
transport of marine emissions (Fig. S2). During summer,          ber at Learmonth (0.11) and January at Lake Lefroy (0.09),
the decrease in AOD was significant over northwestern re-        while the lowest monthly AOD values occurred in August at
gions, consistent with the large increase in precipitation and   Learmonth (0.03) and June at Lake Lefroy (0.04). Fine-mode
decrease in wind speeds. However, the increase in AOD in         aerosols dominated in all months at Lake Lefroy, which was
eastern and southeastern regions during summer could be as-      mostly related to the biomass burning and anthropogenic
sociated with the increase of biomass burning and sea salt       aerosols in this region. Coarse-mode aerosols dominated in
aerosols that were transported from the Pacific Ocean.           all months except for September and October at Learmonth,
   The seasonal variation in AE was different from that in       which was likely related to the dust aerosols transported from
AOD. There were no obvious seasonal variations in AE at the      central Australia such as the Gibson Desert and Great Victo-
nine sites. The maximum seasonal mean AE values (0.92–           ria Desert (Karlson et al., 2014). The increase in fine-mode
1.43) were observed in spring at all sites except for Canberra   AOD during September–October may be a result of rela-
(1.35 in summer), which was mostly related to the fine parti-    tively low wind speeds in fall at Learmonth (Fig. S2), which
cles from biomass burning. Similar results were reported by      could reduce the amount of dust that was transported from

https://doi.org/10.5194/acp-21-3803-2021                                          Atmos. Chem. Phys., 21, 3803–3825, 2021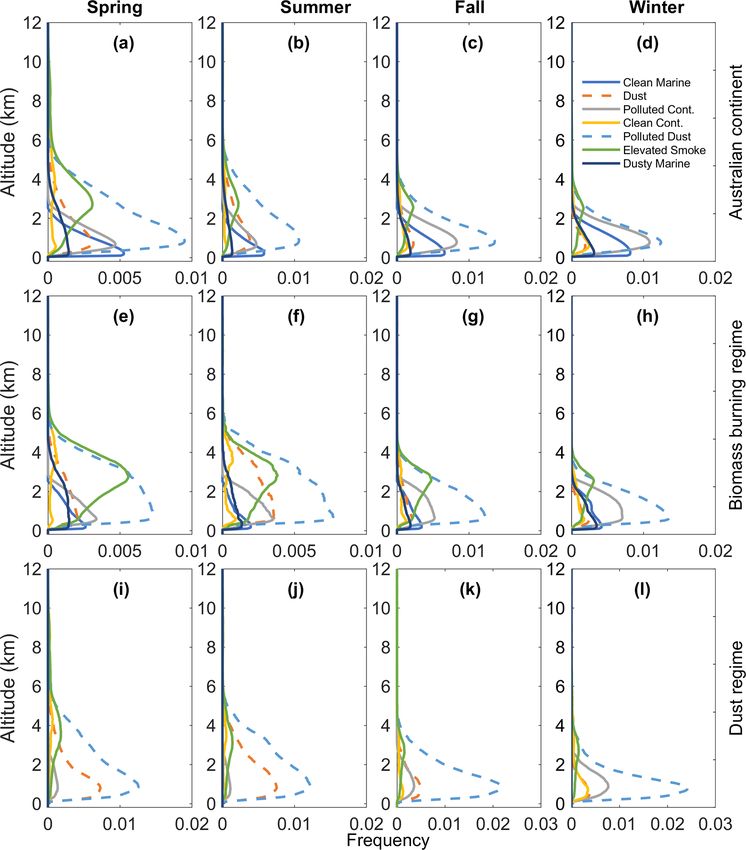
3810                                          X. Yang et al.: Long-term spatiotemporal variation of aerosol over Australia

Figure 4. Spatial distributions of annual averaged Aqua MODIS DB AODs at 550 nm in Australia from 2002–2020 (a–s), along with that
for multi-year averaged Aqua MODIS DB AODs at 550 nm in Australia from 2002–2020 (t). Note that the year of 2002 only covers July–
December and the year of 2020 only covers January–May.

inland deserts. In the central plains, the monthly mean AODs       February. At Birdsville, coarse-mode aerosols dominated
at Birdsville, Fowlers Gap, and Adelaide Site 7 displayed          during summer and fall, while fine-mode aerosols dominated
two peaks. One peak was observed in September at Ade-              during spring and winter. Coarse-mode aerosols were more
laide Site 7 and Fowlers Gap and in October at Birdsville,         abundant during later summer and fall at Fowlers Gap and
with magnitude values of 0.08, 0.07, and 0.10, respectively.       during late spring and fall at Adelaide Site 7. However, fine-
The other one was observed in January, with magnitude              mode aerosols at Fowlers Gap and Adelaide Site 7 were
values of 0.10, 0.09, and 0.09 at Adelaide Site 7, Fowlers         more abundant than that at Birdsville due to the influence of
Gap, and Birdsville, respectively. The findings were consis-       biomass burning aerosols transported from the eastern and
tent with the result of MODIS AOD, which also showed               southern forest areas (discussed in Sect. 3.2.2). In eastern
higher values during September and February than during            Australia, the highest monthly AOD was observed in Octo-
other months in the central plains. It is worth mentioning         ber (0.13) at Lucinda and January at Canberra (0.13). Fine-
that the bimodal trend weakened at Fowlers Gap and Ade-            mode aerosols dominated in all months at Canberra, indicat-
laide Site 7 compared to Birdsville, especially the first peak     ing that Canberra suffered from fine-particle aerosols, such
during September. This was likely due to their location far-       as smoke and anthropogenic aerosols. By contrast, coarse-
ther away from the Simpson Desert, which was the most ac-          mode aerosols dominated in all months at Lucinda, which
tive dust source with high aerosol loading during September–

Atmos. Chem. Phys., 21, 3803–3825, 2021                                              https://doi.org/10.5194/acp-21-3803-2021

X. Yang et al.: Long-term spatiotemporal variation of aerosol over Australia                                                   3811

                                                                     towards large AE values at all sites except for Lake Lefroy,
                                                                     Learmonth, and Lucinda, where AE followed the normal
                                                                     probability distributions. High frequencies of AE (54.44 %–
                                                                     67.09 %) with values less than 1.0 were found at Adelaide
                                                                     Site 7, Learmonth, and Lucinda, suggesting the dominance
                                                                     of coarse-mode aerosol particles. However, relatively high
                                                                     frequencies of AE (52.94 %–79.78 %) were observed in the
                                                                     range of 1.0–2.0 at the other sites, indicating a mixture of
                                                                     fine-mode and coarse-mode aerosols at these sites.

                                                                     3.2.2   Aerosol classification and potential source
                                                                             analysis

                                                                     Variances in the relationship between AOD and AE provide
                                                                     a potential method to classify the aerosol types in differ-
                                                                     ent seasons (Kaskaoutis et al., 2007). Figure 12 depicts the
                                                                     scatter plots of AOD against AE in the four seasons at nine
                                                                     AERONET sites in Australia. However, it is difficult to dis-
                                                                     criminate biomass burning from urban/industrial aerosol us-
                                                                     ing the relationship between AOD and AE alone (Mishra
                                                                     and Shibata, 2012). Further, a better analysis can be made
Figure 5. Time series of the yearly averaged Aqua MODIS DB           through correlations between SSA and AE from AERONET.
AODs over Australia and its eight main administrative regions from   Figure 13 represents the relative percentages of different
2002–2020.                                                           aerosol components in each season at nine sites based on
                                                                     the aerosol classification method of Giles et al. (2012). It
                                                                     should be noted that regional transport is also an important
may be related to the dust and sea salt aerosols transported         factor that can affect aerosols’ type. Therefore, the annual
from the central plains and the Pacific Ocean, respectively.         and seasonal averaged back trajectories at nine AERONET
                                                                     sites are simulated to analyze the potential sources of aerosol
3.2     Classification of aerosol types and their seasonal           at these sites (Figs. 14, S3–S6). It was clear that the aerosol
        contributions                                                concentration was high in spring and summer and low in fall
                                                                     and winter. There were a wide range of AOD values ranging
3.2.1    Frequency distributions of aerosol optical                  from 0.1–0.8 and AE values ranging from ∼ 0.5 to ∼ 1.5 in
         properties                                                  all seasons at nine sites. The mixed type of aerosol (mainly
                                                                     a mixture of biomass burning and dust aerosols) dominated
The frequency distributions of AOD and AE at nine                    in all seasons at nine sites. Mitchell et al. (2017) also found
AERONET sites in Australia are shown in Figs. 10 and                 that the aerosol sources over Australia were driven by mecha-
11, respectively. In general, the frequency distributions of         nisms that do not vary greatly either at regional or continental
AOD roughly showed single-mode distributions, with the               scales by analyzing the monthly mean data at 22 sites, which
maximum occurrence frequency at relatively low values                was associated with a similar source of aerosol.
(AOD 1.5)
in the range of 0.02–0.14. Further, the frequencies of AOD           during the four seasons, which suggested the existence of
with values larger than 0.14 were generally small (4.39 %–           biomass burning and urban/industrial aerosols (Fig. 12a, b).
18.52 %) and showed a decreasing trend with AOD at all               Moreover, dust (AOD >0.15, AE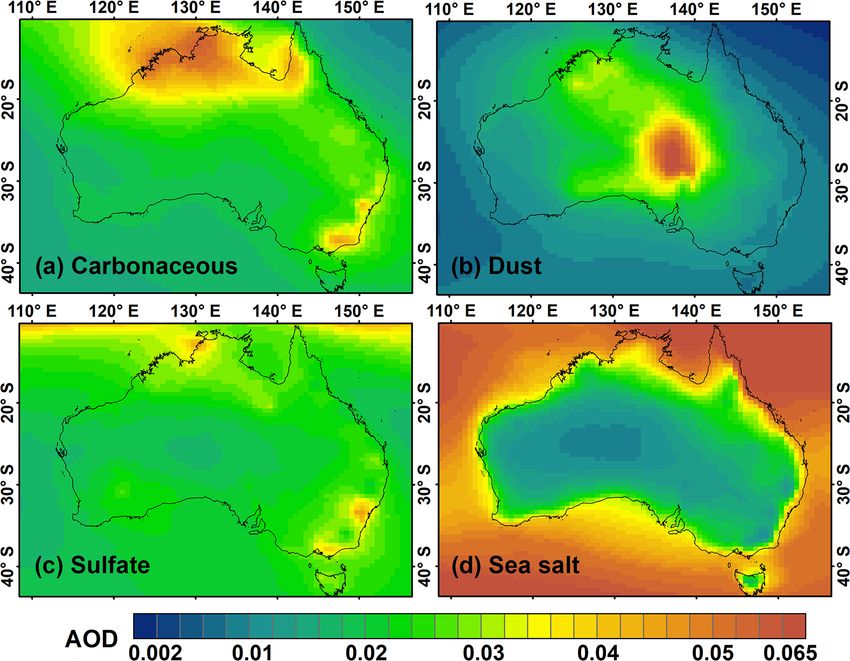
3812                                              X. Yang et al.: Long-term spatiotemporal variation of aerosol over Australia

Figure 6. Box plots of the seasonal average AOD and AE at the nine AERONET sites in Australia. In each box, the dots in the center are the
mean, and the lower and upper limits are the first and the third quartiles, respectively. The lines extending vertically from the box indicate
the spread of the distribution, with the length being 1.5 times the difference between the first and the third quartiles.

Figure 7. Spatial distributions of seasonally averaged Aqua MODIS DB AODs at 550 nm during the period 2002–2020 in Australia, in
(a) spring, (b) summer, (c) fall, and (d) winter.

Atmos. Chem. Phys., 21, 3803–3825, 2021                                                     https://doi.org/10.5194/acp-21-3803-2021
X. Yang et al.: Long-term spatiotemporal variation of aerosol over Australia                                                      3813

Figure 8. Monthly variations of multi-year averaged total, fine-mode, and coarse-mode AODs at 500 nm at nine AERONET sites in Australia.

Figure 9. Spatial distributions of monthly averaged Aqua MODIS DB AODs at 550 nm during the period 2002–2020 in Australia.

https://doi.org/10.5194/acp-21-3803-2021                                                Atmos. Chem. Phys., 21, 3803–3825, 2021
3814                                           X. Yang et al.: Long-term spatiotemporal variation of aerosol over Australia

Figure 10. Occurrence frequencies of AODs at nine AERONET sites in Australia.

Figure 11. Occurrence frequencies of AE at nine AERONET sites in Australia.

Atmos. Chem. Phys., 21, 3803–3825, 2021                                           https://doi.org/10.5194/acp-21-3803-2021
X. Yang et al.: Long-term spatiotemporal variation of aerosol over Australia                                                    3815

Figure 12. Scattered plot for AOD at 500 nm vs. AE at 500 nm in spring (blue), summer (green), fall (purple), and winter (red) at nine
AERONET sites in Australia.

burning aerosols accounted for a relatively large proportion         ries ending at Learmonth showed 22.76 % of airflow from
at Jabiru and Lake Argyle in spring, fall, and winter (Fig. 13a,     the eastern deserts and 32.47 % of airflow from southern in-
b), which was related to the biomass combustion during the           land (Fig. 14c), which indicated that dust in eastern deserts
dry season (Radhi et al., 2012). Dust aerosols were also ob-         (e.g., Gibson Desert, Great Victoria Desert, and Lake Eyre
served during summer, fall, and winter. Karlson et al. (2014)        Basin) and biomass burning and urban/industrial aerosols
analyzed the element and particle size of dust deposited in          from southern regions (e.g., Perth) could be transported to
northwestern Australia from 2008–2009 and found that sam-            the Learmonth site. Karlson et al. (2014) also found the
ples of Halls Creek (located in the southwest of lake Ar-            dust at Learmonth may have had a central Australian source.
gyle) were derived from central Australia (e.g., the Lake Eyre       Although 44.77 % of airflow was from the Indian Ocean,
Basin). Fire events were a main provider of dust aerosols in         clean marine aerosol was seldom found at Learmonth due
the atmosphere because the pyro-convection could accelerate          to the fact that it is situated on the northwestern dust path-
the dust entrainment during the fire events. Furthermore, the        way (Strong et al., 2011). It was evident that mixed aerosols,
seasonal trajectories evidenced the dust aerosols’ transport         biomass burning, and urban/industrial aerosols were domi-
from the southeastern deserts (Fig. S3). The results were sim-       nant during all seasons at Lake Lefory (Figs. 12d, 13d). The
ilar to the findings of McGowan and Clark (2008), who also           urban/industrial aerosols were observed during all seasons,
demonstrated that dust transport from Lake Eyre could travel         making fine-mode aerosols dominant throughout the year at
through the northwest dust transport pathway to affect north-        Lake Lefory. The annual and seasonal averaged trajectories
ern Australia, Indonesia, and the southern Philippines during        ending at Lake Lefory both showed that biomass burning and
1980–2000 using the HYSPLIT model. The trajectories also             urban/industrial aerosols could be transported by the western
indicated a possible transport of marine aerosols generated in       and southwestern airflows (Figs. 14d and S4).
the northwestern Indian Ocean, Arafura Sea, and Coral Sea.              In central Australia, mixed aerosols, biomass burning,
   In western Australia, mixed aerosols and dust aerosols            and urban/industrial aerosols were found during all sea-
were abundant during all seasons at Learmonth, while                 sons (Figs. 12e–g, 13e–g). Dust aerosols with high AOD
biomass burning and urban/industrial aerosols were also ob-          (>0.15) and low AE (
3816                                           X. Yang et al.: Long-term spatiotemporal variation of aerosol over Australia

Figure 13. Relative percentages of different aerosol components in each season at nine sites which are derived from AERONET during the
observation period, including dust, biomass burning, mixed, urban/industrial, and uncertain aerosol types.

mospheric conditions with AOD
X. Yang et al.: Long-term spatiotemporal variation of aerosol over Australia                                                   3817

Figure 14. Cluster analysis of simulated back trajectories from HYSPLIT during the period January 2005–May 2020 for air masses ending
at nine AERONET sites at 500 m above ground level in Australia.

3.2.3   Spatiotemporal characteristics of different                  spatial distributions of dust aerosols across Australia demon-
        aerosol types                                                strated concentrated values in the Lake Eyre Basin using the
                                                                     ECMWF Monitoring Atmospheric Composition and Climate
MERRA-2 data were used to determine the contribution of              (MACC) reanalysis product. Sulfate aerosols were mainly
different kinds of aerosols to the AOD over Australia. We            observed in the northwestern (such as Darwin) and southeast-
should note that the AERONET-based aerosol types show                ern (such as Melbourne, Canberra, and Sydney) Australian
similar spatial distributions to using the MERRA-2-based             coastal regions, where human activities were highly frequent.
aerosol types, while they are slightly different in aerosol          The near-coastal region generally had higher sea salt aerosol
types classified. Considering the similar emission sources           loadings than the continental interior region due to the land–
of organic carbon and black carbon aerosols, we combined             sea breeze effects. Prijith et al. (2014) found that the higher
the two as carbonaceous aerosols for analysis. Carbonaceous          wind speed would lead to more sea salt aerosol formation,
aerosols and sulfate aerosols are produced from biomass              and the corresponding shorter transport time would lead to
burning, fossil fuel combustion, and biofuel consumption,            weaker loss. Sea salt aerosols had a relatively large impact on
while dust and sea salt aerosols mainly originate from natural       the northern coastal regions of Australia, which was mostly
emissions (Randles et al., 2017). The spatial distributions of       due to the higher wind speeds on the northern coast (Fig. S2).
carbonaceous, dust, sulfate, and sea salt AOD over the Aus-          Overall, carbonaceous aerosol over northern Australia, dust
tralian continent are shown in Fig. 15. Carbonaceous aerosols        over central Australia, sulfate over densely populated north-
were mainly distributed in northern and southeastern Aus-            western and southeastern Australia, and sea salt over Aus-
tralia. Carbonaceous aerosols in these two regions could be          tralian coastal regions were the major types of atmospheric
highly related to the fires in the grasslands, forests, and crop-    aerosols in Australia.
lands during the dry seasons. Dust aerosols were mainly dis-            To determine the temporal distributions of different kinds
tributed in the central plains of Australia. The dust aerosols       of aerosols in Australia, seasonal variation analyses of
over the central plains primarily originated from the Lake           aerosols are performed. Figure 16 shows the seasonal vari-
Eyre Basin, one of the Southern Hemisphere’s most signif-            ations of carbonaceous, dust, sulfate, and sea salt aerosols
icant dust sources. Mukkavilli et al. (2019) found that the

https://doi.org/10.5194/acp-21-3803-2021                                              Atmos. Chem. Phys., 21, 3803–3825, 2021
3818 X. Yang et al.: Long-term spatiotemporal variation of aerosol over Australia Figure 15. Spatial distributions of carbonaceous (a), dust (b), sulfate (c), and sea salt (d) AOD derived from the MERRA-2 monthly dataset during the period 2002–2020 in Australia. in Australia. Generally, carbonaceous AODs in northern re- (i.e., pre-frontal northerly, frontal westerly and post-frontal gions were much higher than those in southern and south- southerly winds) (Baddock et al., 2015; Strong et al., 2011). western regions in all seasons. High carbonaceous AOD val- During the austral winter, high-pressure systems were situ- ues were observed in northern Australia during spring and ated in the middle of the continent and blocked the fronts southeastern Australia during summer. This was consistent from reaching the continent, which helped the formation of with our findings in seasonal distributions of MODIS AOD stable weather conditions with little dust entrainment. Dur- in Australia. Further, both the northern and eastern Aus- ing late spring and early summer, the high-pressure sys- tralian atmosphere were influenced by carbonaceous aerosols tems shifted southwards with frontogenesis arising, which in spring. During spring and summer, northern and south- increased the chances of occurrence of dust storms (Strong ern Australia experienced warm, dry, and high wind speed et al., 2011; Ekström et al., 2004). High sulfate AODs were weather conditions, which increased the occurrence fre- observed in densely populated coastal urban regions in south- quency and development of extreme wildfires. The carbona- east and northwest Australia during spring and summer, ceous AODs declined in fall and winter in Australia due while low sulfate AODs were observed during fall and win- to the decreasing occurrence frequency of biomass burning. ter. The high sulfate AODs during spring and summer could Central Australia was always the relatively high dust AOD be a result of the high local emissions from industrial ac- center in the four seasons. Further, higher dust AOD values tivities and biomass burning, along with the adverse meteo- were observed in spring, and summer and lower dust AOD rological conditions such as low wind speeds and weak pre- values were observed in fall and winter. This seasonality of cipitation. Sea salt AODs showed a decreasing trend from the dust aerosols was consistent with the results of Mukkavilli et coast to the further inland regions in all seasons. High sea salt al. (2019) and Ridley et al. (2016). The near-coastal regions AOD values were observed in northeast coastal regions. Fur- of Australia generally had higher wind speeds and precipi- ther, high sea salt AOD values appeared in summer and fall, tation than the continental interior regions (Fig. S2). There- while low sea salt AOD values appeared in spring and win- fore, these regions had lower dust storm activities than the ter. Actually, many studies have identified the large increase continental interior regions. In contrast, the west, central, of coarse-mode sea salt aerosols at coastal regions of north- and parts of the south Australian continents had dry spring ern Australia during the wet season (i.e., November–April) and summer, which enhanced the dust storm occurrence fre- (Bouya et al., 2010; Radhi et al., 2012). quency. The frequencies of dust storms in central Australia showed strong seasonal dependency on the frontal activity Atmos. Chem. Phys., 21, 3803–3825, 2021 https://doi.org/10.5194/acp-21-3803-2021
X. Yang et al.: Long-term spatiotemporal variation of aerosol over Australia                                                   3819

Figure 16. Spatial distributions of carbonaceous, dust, sulfate, and sea salt AOD derived from MERRA-2 monthly dataset in each season
during the period 2002–2020 in Australia.

3.3   Vertical distribution of aerosol optical properties            fined as a mixed aerosol type to represent mixtures of dust
                                                                     and biomass burning smoke. Further, the aerosol types clas-
The CALIPSO aerosol product can provide the profiles of              sified by AERONET over Australia also indicated that the
aerosol optical properties. Thus, three domains are chosen           mixed type of aerosols (mostly biomass burning and dust) is
to explore the vertical distribution of various aerosol types        the dominant type during all seasons. The result suggested
in Australia, as shown in Fig. S7. The first domain covers           the significant impacts of both biomass burning and desert
most of the Australian continent (blue shaded region), where         emissions in Australia. Polluted continental aerosol was the
carbonaceous aerosol over northern Australia and dust over           secondary dominant aerosol type detected approximately at
central Australia are the major types of atmospheric aerosols.       heights from 1–2 km, with higher occurrence frequency dur-
The second domain includes parts of the Northern Territory,          ing fall and winter than that during spring and fall. The oc-
western Australia, and Queensland (deep purple shaded re-            currence frequency of clean marine aerosol was the largest at
gion), where biomass burning aerosol dominates. The third            the surface and decreased with altitude. The occurrence fre-
domain includes parts of the Northern Territory, Southern            quency of elevated smoke increased with height at 0–3 km
Australia, New South Wales, and Queensland (gray shaded              and then decreased with height at 3–12 km. Elevated smoke
region), where dust aerosol is abundant.                             was the secondary dominant aerosol type detected approxi-
   Figure 17a–d show the averaged occurrence frequency               mately at heights from 2–5 km during all seasons, the domi-
profile of each aerosol type in each season from 15-year             nant aerosol type at 6–12 km during spring and summer, and
CALIPSO observations in the whole of Australia (blue shade           the dominant aerosol type at 6–8 km during fall and win-
region in Fig. S7). In general, polluted dust was the dominant       ter. Dust with an occurrence frequency larger than 0.1 % can
aerosol type detected roughly from 0.5–6 km during spring            reach as high as 12 km. Dust was detected more frequently
and summer and roughly from 0.5–4 km during fall and win-            at height approximately from 0–6 km in all seasons. Further,
ter. The altitude with the peak occurrence frequency (>9 %)          the occurrence frequency of the dust was significantly higher
of the polluted dust was ∼ 1 km throughout the year. Burton          in summer than in other three seasons, which was consistent
et al. (2013) have pointed out that the polluted dust was de-        with the observations of MERRA-2.

https://doi.org/10.5194/acp-21-3803-2021                                              Atmos. Chem. Phys., 21, 3803–3825, 2021
3820 X. Yang et al.: Long-term spatiotemporal variation of aerosol over Australia Figure 17. Occurrence frequency profile of each aerosol type in the four seasons from the 15-year CALIPSO L3 aerosol profile data product in Australian continent (a–d), the biomass burning regime (e–h), and the desert regime (i–l). The vertical profile of occurrence frequency for each type and transported from southern inland deserts. The altitude of aerosol in each season over the biomass burning regime in with peak occurrence frequency (∼ 5 %) for elevated smoke Australia (deep purple shade region in Fig. S7) is presented was ∼ 3 km throughout the year. An even higher occurrence in Fig. 17e–h. Polluted dust was the dominant aerosol type frequency of elevated smoke was observed at heights from at heights approximately from 0.5–3 km during all seasons 2–4 km in spring, consistent with the result of prevalence of except for summer when polluted dust dominated at heights biomass burning aerosol in spring at Lake Argyle, which is roughly from 0.5–6 km. The largest occurrence frequency of located in the biomass burning regime. Polluted continental polluted dust was observed at heights from 0–2 km during aerosol was the secondary dominant aerosol type at heights fall. The wind fields in fall (Fig. S2c) and the back trajec- from 0.5–2 km, with a higher occurrence frequency during tory at Jabiru and Lake Argyle (Fig. 14a, b) revealed that fall and winter than during spring and summer. In addition, the airflows passed over the Lake Eyre Basin before reaching the dust occurrence frequency increased with height from 0– the biomass burning regime areas. Those airflows brought a 4 km during summer. The finding was consistent with the re- large amount of dust from the Lake Eyre Basin, which then sults shown in Fig. 16, which showed high dust aerosol load- got mixed with the biomass burning aerosols, resulting in the ings in the biomass burning regime areas during summer. increasing occurrence frequency of polluted dust during fall. Figure 17i–l show the occurrence frequency of aerosol The results confirmed the existence of dust aerosols in north- type in the four seasons over the desert regime in Australia ern Australia, which were mostly generated along with fires (gray shaded region in Fig. S7). Similar to the biomass burn- Atmos. Chem. Phys., 21, 3803–3825, 2021 https://doi.org/10.5194/acp-21-3803-2021
X. Yang et al.: Long-term spatiotemporal variation of aerosol over Australia                                              3821

ing regime areas, polluted dust was the dominant aerosol type      CALIPSO data. The main conclusions of the study are as
at heights from 0–5 km, with higher occurrence frequency           follows.
(>10 %) during fall and winter. Similar results were reported
by Huang et al. (2013), who found that the aerosol character-       1. The annual averaged AOD at most Australia sites
istics in western Australia were closer to that in the biomass         showed increasing trends (0.002 to 0.029 yr−1 ) during
burning regime rather than that in other desert regimes such           the observation period except for Canberra, Jabiru, and
as North Africa and west China. There were two likely main             Lake Argyle, at which the AOD showed decreasing
reasons. First, the continent had relatively low topographi-           trends (−0.005 to −0.002 yr−1 ). By contrast, the annual
cal relief, and the arid regions were old and highly weath-            averaged AE presented decreasing trends at most sites
ered. Thus, fine particles were blown away a long time ago             (−0.045 to −0.005 yr−1 ). There was a clear seasonal
(Prospero et al., 2002). Second, the atmosphere of central             variation in AOD, with high values in austral spring and
Australia was affected by the biomass burning aerosols trans-          summer and low values in austral fall and winter. How-
ported from eastern and southeastern Australia as discussed            ever, the seasonal variations of AE were weaker, with
earlier. In addition, the elevated smoke was the dominant              the highest mean values in spring at most sites. Further-
type at heights above 5 km in all seasons except winter when           more, the monthly variation of AOD tends to have a
the elevated smoke was dominant at heights above 3 km. The             unimodal distribution with peak values in September–
smoke in the desert regime was mostly transported from east-           January at most sites, which were located in warm and
ern and southeastern Australia (Fig. 14). However, there were          rainy regions. In contrast, the monthly variation of AOD
significant differences in aerosol types between biomass               at those sites in arid regions tends more to have a bi-
burning and dust regime areas. Dust was the secondary dom-             modal distribution, showing dual peaks in austral spring
inant aerosol type at heights from 0–3 km in spring, from 0–           and summer.
4 km in summer, and from 0–2 km in fall. The altitude with          2. During the period July 2002–May 2020, the annual av-
the peak occurrence frequency of dust was ∼ 1 km through-              erage MODIS AOD showed a weak decreasing trend
out the year. Furthermore, there were no clean marine and              (−0.0003 yr−1 ) in Australia. The spatial distribution of
dusty marine aerosols in the desert regime areas due to its lo-        annual mean MODIS AOD showed obvious spatial het-
cation far away from the ocean. Although polluted dust was             erogeneity, with higher values in east than in west Aus-
the dominant aerosol type at heights from 0–5 km over the              tralia. High aerosol loadings were observed in the Aus-
desert regime, the occurrence frequency of dust significantly          tralian tropical savanna regions, Lake Eyre Basin, and
increased at heights from 0–3 km. Furthermore, higher oc-              southeastern regions of Australia, while low aerosol
currence frequencies of the polluted dust were found during            loadings were observed over the arid region in western
all seasons over the desert regime than those over the biomass         Australia. High AOD values were observed in spring
burning regime.                                                        and summer, while low AOD values were observed in
   In general, results from CALIPSO indicated that the domi-           fall and winter. The AOD increased from August until
nant aerosol type at heights from ∼ 0.5 to ∼ 3 km in Australia         January of the following year in northern, central, and
was polluted dust, which was consistent with the aerosol               eastern Australia, which was most likely related to the
classification results at the nine AERONET sites. This re-             biomass burning and dust storms.
sulted from the regional transport of aerosols over Australia,
especially for biomass burning and dust aerosols. However,          3. The mixed type of aerosols (biomass burning and dust
the dust-prone characteristic of aerosol was more prominent            aerosols) was dominant in all seasons identified at nine
in central Australia, while the biomass-burning-prone char-            sites. The biomass burning aerosol was the second dom-
acteristic of aerosol was more prominent in northern Aus-              inant contributor to the aerosol composition at Jabiru
tralia.                                                                and Lake Argyle, while the dust aerosol was the second
                                                                       dominant aerosol type at Birdsville, Fowlers Gap, Ade-
                                                                       laide Site 7, Lucinda, and Learmonth. Clean marine and
                                                                       urban/industrial aerosols were observed at most sites
4   Conclusions                                                        such as Lake Lefory and Canberra. Spatially, aerosols
                                                                       in Australia were mainly carbonaceous over the north-
In this study, long-term spatiotemporal variations of aerosol          ern regions, dust over the central regions, sulfate over
optical properties in Australia were analyzed using a combi-           densely populated northwestern and southeastern re-
nation of ground-based and satellite aerosol products. Two             gions, and sea salt over coastal regions. Seasonal varia-
different methods based on the different combinations of               tions of carbonaceous, dust, sulfate, and sea salt AODs
aerosol optical properties from AERONET products were                  in Australia generally showed high values in spring and
used to classify the aerosol types at nine sites. Furthermore,         summer and low values in fall and winter. Furthermore,
the spatiotemporal variations and vertical distributions of dif-       the results from CALIPSO showed that clean marine
ferent aerosol species were analyzed using MERRA-2 and                 aerosol and polluted dust were the dominant aerosol

https://doi.org/10.5194/acp-21-3803-2021                                          Atmos. Chem. Phys., 21, 3803–3825, 2021
You can also read