Physical Activity, Sedentary Behavior, and Sleep on Twitter: Multicountry and Fully Labeled Public Data Set for Digital Public Health Surveillance ...
←
→
Page content transcription
If your browser does not render page correctly, please read the page content below
JMIR PUBLIC HEALTH AND SURVEILLANCE                                                                                   Shakeri Hossein Abad et al

     Open Source/Open Data

     Physical Activity, Sedentary Behavior, and Sleep on Twitter:
     Multicountry and Fully Labeled Public Data Set for Digital Public
     Health Surveillance Research

     Zahra Shakeri Hossein Abad1,2, PhD; Gregory P Butler3, MSc; Wendy Thompson3, MSc; Joon Lee2,4,5, PhD
     1
      Department of Biomedical Informatics, Harvard Medical School, Harvard University, Boston, MA, United States
     2
      Data Intelligence for Health Lab, Cumming School of Medicine, University of Calgary, Calgary, AB, Canada
     3
      Centre for Surveillance and Applied Research, Public Health Agency of Canada, Ottawa, ON, Canada
     4
      Department of Community Health Sciences, Cumming School of Medicine, University of Calgary, Calgary, AB, Canada
     5
      Department of Cardiac Sciences, Cumming School of Medicine, University of Calgary, Calgary, AB, Canada

     Corresponding Author:
     Joon Lee, PhD
     Data Intelligence for Health Lab
     Cumming School of Medicine
     University of Calgary
     3280 Hospital Dr NW
     Calgary, AB, T2N 4Z6
     Canada
     Phone: 1 403 220 2968
     Email: joonwu.lee@ucalgary.ca

     Abstract
     Background: Advances in automated data processing and machine learning (ML) models, together with the unprecedented
     growth in the number of social media users who publicly share and discuss health-related information, have made public health
     surveillance (PHS) one of the long-lasting social media applications. However, the existing PHS systems feeding on social media
     data have not been widely deployed in national surveillance systems, which appears to stem from the lack of practitioners and
     the public’s trust in social media data. More robust and reliable data sets over which supervised ML models can be trained and
     tested reliably is a significant step toward overcoming this hurdle. The health implications of daily behaviors (physical activity,
     sedentary behavior, and sleep [PASS]), as an evergreen topic in PHS, are widely studied through traditional data sources such as
     surveillance surveys and administrative databases, which are often several months out-of-date by the time they are used, costly
     to collect, and thus limited in quantity and coverage.
     Objective: The main objective of this study is to present a large-scale, multicountry, longitudinal, and fully labeled data set to
     enable and support digital PASS surveillance research in PHS. To support high-quality surveillance research using our data set,
     we have conducted further analysis on the data set to supplement it with additional PHS-related metadata.
     Methods: We collected the data of this study from Twitter using the Twitter livestream application programming interface
     between November 28, 2018, and June 19, 2020. To obtain PASS-related tweets for manual annotation, we iteratively used regular
     expressions, unsupervised natural language processing, domain-specific ontologies, and linguistic analysis. We used Amazon
     Mechanical Turk to label the collected data to self-reported PASS categories and implemented a quality control pipeline to monitor
     and manage the validity of crowd-generated labels. Moreover, we used ML, latent semantic analysis, linguistic analysis, and label
     inference analysis to validate the different components of the data set.
     Results: LPHEADA (Labelled Digital Public Health Dataset) contains 366,405 crowd-generated labels (3 labels per tweet) for
     122,135 PASS-related tweets that originated in Australia, Canada, the United Kingdom, or the United States, labeled by 708
     unique annotators on Amazon Mechanical Turk. In addition to crowd-generated labels, LPHEADA provides details about the
     three critical components of any PHS system: place, time, and demographics (ie, gender and age range) associated with each
     tweet.
     Conclusions: Publicly available data sets for digital PASS surveillance are usually isolated and only provide labels for small
     subsets of the data. We believe that the novelty and comprehensiveness of the data set provided in this study will help develop,

     https://publichealth.jmir.org/2022/2/e32355                                                  JMIR Public Health Surveill 2022 | vol. 8 | iss. 2 | e32355 | p. 1
                                                                                                                       (page number not for citation purposes)
XSL• FO
RenderX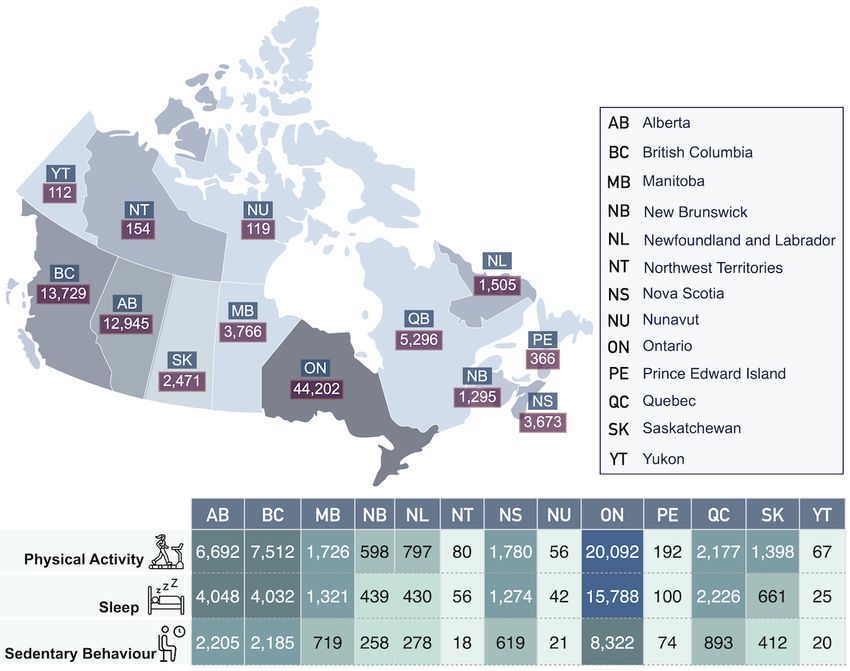
JMIR PUBLIC HEALTH AND SURVEILLANCE                                                                              Shakeri Hossein Abad et al

     evaluate, and deploy digital PASS surveillance systems. LPHEADA will be an invaluable resource for both public health researchers
     and practitioners.

     (JMIR Public Health Surveill 2022;8(2):e32355) doi: 10.2196/32355

     KEYWORDS
     digital public health surveillance; social media analysis; physical activity; sedentary behavior; sleep; machine learning; online
     health information; infodemiology; public health database

                                                                          consider whether their findings are associated with the user’s
     Introduction                                                         personal experience (self-reported or not), leading to content
     Digital Public Health Surveillance                                   bias, incorrect results, and potentially flawed interpretations
                                                                          [7].
     Almost two-thirds of the world’s population now uses the
     internet, taking the global total to 4.57 billion (59%) by July      Considering the location-dependent nature of health policies,
     2020 [1]. Overall, 87% of internet users and 65% (3.96 billion)      along with the essential role of place data in assessing the
     of the world’s total eligible population (ie, aged >13 years) now    representativeness of a PHS system, the impact of a PHS system
     use social media. The combined time that these users spend on        can vary considerably with geographical location [10-13].
     social media adds up to more than 1 million years every day          However, the number of DPHS studies that have stratified their
     [1], contributing to a large amount of user-generated data on        results by a more granular geographic region is small [7].
     different social media platforms. In 2020, Twitter alone reported    Because of a lack of annotated data sets for the development of
     500 million tweets generated per day from 145 million daily          automatic models, more than two-thirds (69%) of DPHS studies
     active users. The low-cost data stream available on social media     published before 2020 are limited by labor-intensive, manual,
     and other internet-based sources serves to makes research            and abstract analysis methods (eg, manual coding, qualitative
     advances on digital public health surveillance (DPHS) more           analysis, and rule-based natural language processing [NLP]),
     accessible for public health officials, clinicians, patients, and    which makes these studies limited in terms of sample size,
     the public. This helps disseminate insights into different aspects   scope, and generalizability [7].
     of public health and promote healthy lifestyles and health           Given that all of these challenges are data-oriented, an increase
     policies [2,3]. The open access to the public data about users       in both data quality and quantity enriched with concrete
     and their opinions, the ease of use, and a large user base have      demographics and location information can help deal with all
     made Twitter one of the most popular data sources for studying       these challenges. Moreover, to facilitate the development and
     different aspects of public health [4,5], with Google Scholar        evaluation of robust machine learning (ML) models to address
     indexing 1.32 million articles mentioning Twitter and public         the limited scope of manual data analysis techniques, annotated
     health. Moreover, more than 85% of Twitter users, with a wide        data sets for various PHS aspects are required. However, only
     breadth of demographic groups [4], also use Facebook,                a handful of annotated data sets are publicly available for
     Instagram, and YouTube (this number for other platforms varies       research on DPHS [14-21]. Jimeno-Yepes et al [15] provided
     between 52% and 82%) [1], indicating that Twitter users              an annotated data set of 1300 tweets related to disease symptoms
     reasonably represent active social media users in general.           and pharmacologic substances. The open data set developed by
     Since 2011, Twitter has been the most popular form of social         Aphinyanaphongs et al [16] contains 13,146 labeled tweets
     media used for public health communication [6,7]. A recent           resulting from hashtag filtering and covers a time span from
     scoping review of 755 articles on DPHS shows that Twitter is         January 2010 to January 2015. This data set is developed for
     the most studied of all platforms and most used platform to          training binary classifiers to detect tweets that indicate
     study communicable diseases, behavioral risk factors, mental         e-cigarette use for smoking cessation. Crowdbreaks [18], an
     health, drug use, and vaccine [7].                                   open health tracking platform, crowdsources the labeling of
                                                                          vaccine sentiment and COVID-19–related tweets to the public.
     Limitations of Digital Public Health Data                            Although the data set provided by this system, compared with
     However, a number of limitations that mainly stem from the           other open DPHS data sets, is in a better position in terms of
     limitations associated with the data are still the major obstacles   size, it lacks demographics and geospatial data, and each tweet
     toward the adoption of digital data for public health surveillance   is labeled by only 1 annotator (without any control over their
     (PHS) [4,7]. Given the main aims of any PHS system are to            labeling quality).
     measure, monitor, and improve the overall health status of their
     target populations, the systematic incorporation of time,
                                                                          Objective
     demographics (ie, age and gender), and place data into the           Given that in addition to physical inactivity, as the leading risk
     surveillance process is critical to the reliability and              factor for noncommunicable diseases and premature death [22],
     generalizability of this process [8,9]. However, nearly one-third    prolonged sedentary behavior and inadequate sleep are also
     (32%) of the DPHS studies published between 2005 and 2020            important risk factors for chronic diseases [23], this work
     (with the majority of them related to behavioral risk factors        presents a multicountry and fully labeled digital public health
     surveillance) did not capture age, gender, or place information      data set (LPHEADA [Labelled Public Health Dataset]) of tweets
     for their analyses [7]. Moreover, most studies on DPHS do not        related to physical activity, sedentary behavior, and sleep

     https://publichealth.jmir.org/2022/2/e32355                                             JMIR Public Health Surveill 2022 | vol. 8 | iss. 2 | e32355 | p. 2
                                                                                                                  (page number not for citation purposes)
XSL• FO
RenderX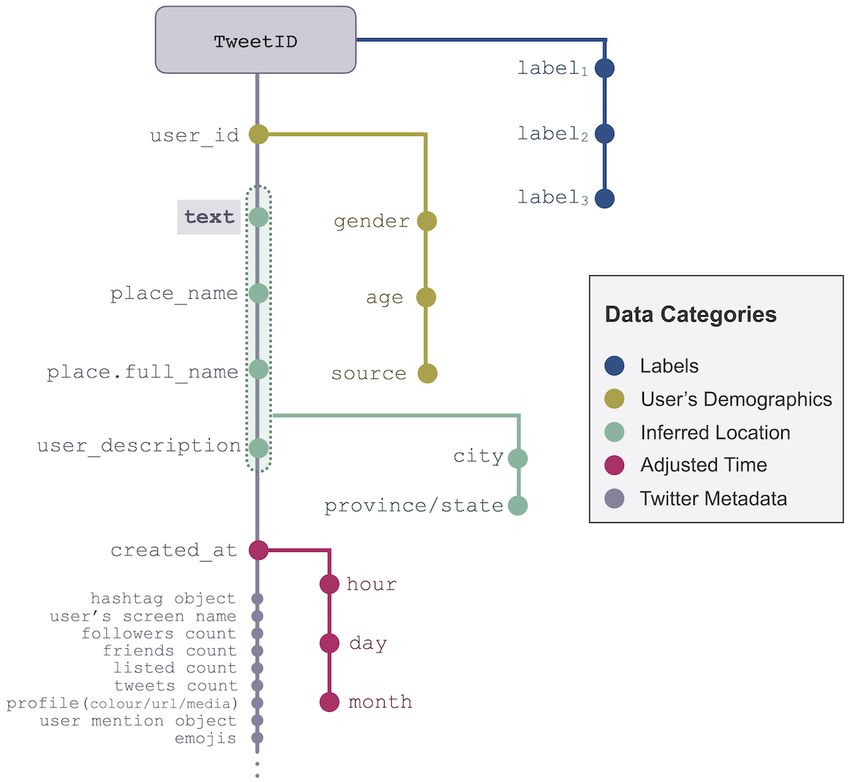
JMIR PUBLIC HEALTH AND SURVEILLANCE Shakeri Hossein Abad et al
(PASS) that originated in Australia, Canada, the United among which 30.9% (164/530) completed only 1 HIT each.
Kingdom, or the United States. We selected these countries Among all 610 workers, 1 (0.2%) worker completed 21,801
because they have some of the highest proportions of social HITs, and 3 (0.5%) workers completed between 5000 and
media users in the world (Australia, 71%; Canada, 66%; the 10,000 HITs.
United Kingdom, 66%; the United States, 69%; and world,
In addition to the Canadian tweets, we filtered a random subset
51%) [1]. LPHEADA comprises 366,405 labels, labeled by 708
of the data set for tweets that originated in the United Kingdom,
unique annotators on Amazon Mechanical Turk (AMT), for
the United States, and Australia. This data set spans the same
122,135 unique tweets generated by 72,749 unique users
data collection period as the Canadian data set and contains
between November 28, 2018, and June 19, 2020. AMT is a
70,239 labels collected for 23,413 tweets (ie, 3 labels per tweet).
software service operated by Amazon that allows users (ie,
Adding the data from these countries will provide an important
requesters) to crowdsource work, broken into microtasks called
epidemiological diversity that can be used for implementing
human intelligence tasks (HITs), to a large number of workers
comparative studies and evaluating the generalizability of the
who are compensated for each HIT completed [24]. As
PASS surveillance models trained on the Canadian data set.
LPHEADA was collected and labeled in collaboration with the
Public Health Agency of Canada to develop PASS indicators Labeling Process
for the Canadian population, 80.83% (98,722/122,136) of the We implemented a pipeline to create the crowdsourcing tasks,
tweets included in our data set were collected from Canada. referred to as HITs by AMT, post them on AMT, collect the
Tweets from the United States and the United Kingdom make labels through a quality-check process, approve or reject the
up 8.35% (10,193/122,136) and 7.49% (9154/122,136) of the HITs, and store the results. To minimize noisy and low-quality
data set, respectively, and Australian tweets make up the data, we added a qualification requirement to our tasks and
remaining 3.33% (4067/122,136) of the data set. granted the labeling access to workers who had demonstrated
Along with the labeled tweets, we provide detailed information a high degree of success in performing a wide range of HITs
on users’ gender, age range, and geospatial information, whether across MTurk (ie, master qualification). In addition, we added
the tweet was self-reported, and whether it was posted by an a simple qualification question to each HIT to detect spammers
organization. We evaluated the quality of the data set and its or irresponsible workers. Each HIT contained 4 questions,
labels using latent semantic analysis, linguistic analysis, ML including the qualification question, and was assigned to 3
models, and truth inference models. The data set we provide in workers. Through different iterations of data labeling, workers
this paper can be used to develop unsupervised or supervised were paid from US $0.03 to US $0.05 after completing each
ML models for digital PASS surveillance. HIT. We collected the labels for the 122,135 tweets used in this
study through different iterations, from April 2019 to November
Methods 2020. We regularly checked the quality of the submitted tasks
to detect low-quality workers during each iteration and revoke
Collection and Preparation of the Data Set their access to our tasks. Before the formal initiation of the
We collected the data of this study from Twitter using the process, we pilot-tested the design, response time, and
Twitter livestream application programming interface (API) complexity of the HITs in 2 iterations and revised the workflow
between November 28, 2018, and June 19, 2020. The entire accordingly. To label the data set provided in this paper, we
data set (ie, 1,902,980,841 tweets) was filtered for Canadian used AMT as a crowdsourcing service and did not collect any
tweets potentially relevant to PASS. From 22,729,110 collected personally identifiable information from the workers
Canadian tweets, 0.46% (103,911/22,729,110) were selected (participants) during the data labeling task. The experiments
using keywords and regular expressions related to PASS were carried out in accordance with relevant guidelines and the
categories. To define the search strings and regular expressions, University of Calgary Conjoint Faculties Research Ethics
we used NLP techniques (eg, topic modeling, language Board’s regulations. We implemented the entire workflow in
modeling, and linguistic analysis) to detect latent word patterns Python (Python Software Foundation) and used Boto3 Python
relevant to PASS-related contexts. Moreover, we pilot-tested Software Development Kit to connect to and work with AMT.
the labeling process first to validate the extracted keywords and Time Adjustment
iteratively updated the list of keywords for each category after
The Twitter API returns the date and time that a tweet is
manually reviewing the labels and the filtered tweets.
published in the Universal Time Coordinated. To adjust this
Multimedia Appendix 1 provides a complete list of the words
time zone based on each tweet’s location, we used the bounding
used for generating regular expressions and filtering the data
box of coordinates, which enabled spatial mapping to tweets’
set. Each of these 103,911 tweets was labeled by 3 AMT
respective city locations, and used a time zone finder in Python.
workers, from which 95.01% (98,722/103,911) of tweets
Given that daytime, month, and weekday can be influential
received 3 valid labels (ie, multiple or missing labels were
factors in twitting about each of the PASS categories, and to
invalid and rejected), with almost half of them related to physical
better use the date-time data (%a %b %d %H:%M:%S %Y),
activity. For the Canadian data set, 610 unique workers
we extracted weekday (a), month (b), and hour (H) fields and
participated in our data labeling tasks and completed 103,911
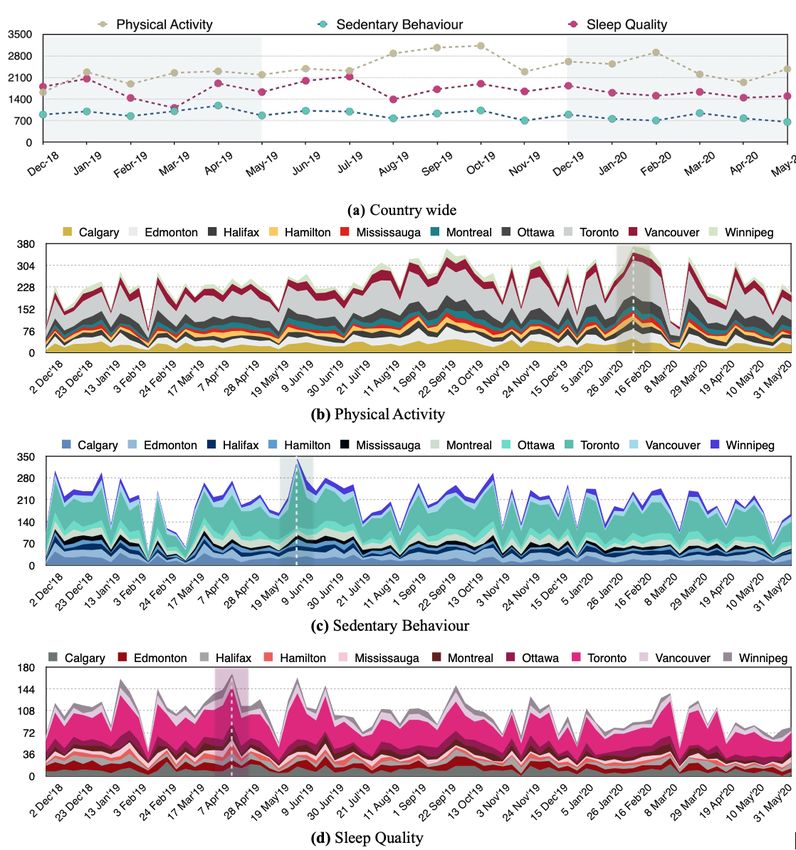
stored them as separate features. Figure 1A shows the temporal
HITs, from which 4.99% (5189/103,911) HITs were removed
distribution of tweets for each of the PASS categories in the
as they did not receive 3 valid answers. The majority of these
Canadian data set. Moreover, the stacked area charts presented
workers (530/610, 86.9%) completed less than 100 HITs each,
https://publichealth.jmir.org/2022/2/e32355 JMIR Public Health Surveill 2022 | vol. 8 | iss. 2 | e32355 | p. 3
(page number not for citation purposes)
XSL• FO
RenderX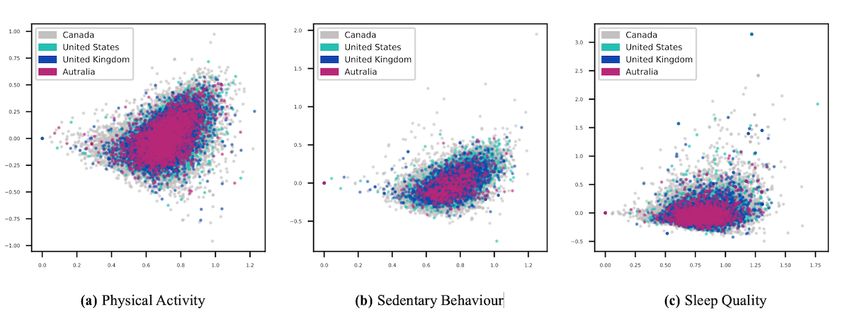
JMIR PUBLIC HEALTH AND SURVEILLANCE                                                                                    Shakeri Hossein Abad et al

     in Figures 1B-1D detail the frequency of tweets for each of               PASS categories for the top 10 Canadian cities.
     Figure 1. The temporal distribution of tweets for the Canadian data set. To make fair comparisons, we used data from December 1, 2018, to May 31,
     2020, for these visualizations and removed data collected during the last 2 days of November 2018 and the first 2 weeks of June 2020.

                                                                               and developed a 5-step process that uses tweet-neighborhood
     Location Inference                                                        location (ie, place.name and place.full_name), profile
     The geospatial metadata provided by the Twitter API are derived           information (ie, profile description and location), and tweet text
     from three main sources: (1) geotagged location, (2) profile              to map Twitter’s geospatial metadata for each tweet to physical
     location, and (3) mentioned location in the tweet text. Geotagged         locations in the form of ⟨ci,pi|si⟩, where c denotes the city of a
     location can be defined by exact location (ie, device location)           tweet and p|s represent its corresponding province or state,
     at the time of tweeting, by the assigned Twitter place (ie, at the        respectively (Figure 2). To demonstrate the proposed process,
     neighborhood level), or both. Although the exact location field           we used the Canadian geographical names data set (ie, location
     provides the highest level of precision, it is not a default setting,     dictionary) provided by the Geographical Names Board of
     and only a small portion of users share their exact latitude and          Canada. Each geographical name provided by this data set is
     longitude (eg, only 1%-2% of tweets are geotagged [25]). Thus,            mapped to a province and is classified to a geographic area such
     to infer the location of each tweet in LPHEADA, we proposed               as city, town, village, lake, administrative sector, or recreational
     https://publichealth.jmir.org/2022/2/e32355                                                   JMIR Public Health Surveill 2022 | vol. 8 | iss. 2 | e32355 | p. 4
                                                                                                                        (page number not for citation purposes)
XSL• FO
RenderX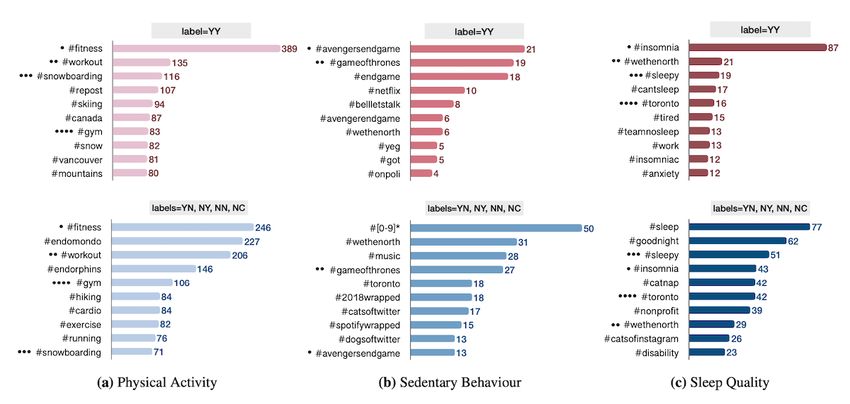
JMIR PUBLIC HEALTH AND SURVEILLANCE                                                                                          Shakeri Hossein Abad et al

     center. As illustrated in Figure 2, for each ti, we first used a              Steps 3-5 of the process deal with unstructured text objects that
     simple search function to map the place name field associated                 can come from all 3 sources of geospatial information. To
     with each tweet to its corresponding ci in the location dictionary.           extract the location information from these fields, we developed
     If found, the corresponding province field pi was defined using               a string-matching function to detect the longest common
     equation 1:                                                                   substring between the unstructured text of the data set and the
                                                                                   area field of the location dictionary (eg, first time boating in
                                                                                   Lake Louise #AB is mapped to ⟨Lake Louise,Alberta⟩ instead
                                                                                   of to ⟨Louise,Quebec⟩). To manage the complexity of
     where                denotes the second component of the field                information extraction from unstructured text, we only used a
     when the first component is ci (eg, Ontario in the illustrative               subset of areas listed in the location dictionary with high
     example of Figure 2). This will detect geographical areas with                population density (eg, city, municipality, town, village, and
     the same names but in different provinces (eg, Leduc is a town                country). Thus, we excluded areas classified as lake, mountain,
     or city in both Alberta and Quebec).                                          river, bridge, or park.

     Figure 2. Five-step location inference process. The location dictionary is an external regional geographical metadata used to extract the exact locations
     of tweets. The area field in this process refers to regions at different scales such as city, region, municipality, town, township municipality, municipal
     district, dispersed rural community, village, or country.

     Demographic Attribute Inference                                               Results
     The demographic variables of age and gender and the
                                                                                   Data Records
     information about the source of each tweet (eg, organizations
     vs real users) were not available within the data set collected               Overview
     from Twitter. We estimated these variables for each tweet using               LPHEADA is released in accordance with Twitter’s terms and
     the M3inference package in Python [26], which uses a                          conditions, and the developer’s agreement and policies [27],
     multimodal deep neural architecture for joint classification of               which prohibits the verbatim release of the collected tweets.
     age (binned into four groups: 18, 19-29, 30-39, and 40 years),                However, releasing the tweet IDs is allowed. Data access
     gender, and information source of social media data. This                     requires a data use agreement between the data user and Twitter
     approach uses 4 sources of information, namely, username,                     to govern the access and use of the licensed material returned
     screen name, biography, and profile image of public profiles,                 by the Twitter API. Once approved, using the Tweet ID field,
     to develop 2 separate pipelines for processing a profile image                Twitter metadata can be rehydrated and downloaded as a JSON
     and each of the 3 text sources of information. The models                     (JavaScript Object Notation) file to be mapped to other subsets
     provided in this package are trained on 14.53M, 2.61M, and                    of data provided in this study (eg, labels, location, time, and
     23.86M profiles for each of the gender, age, and organization                 demographics). A detailed and demonstrative tutorial on
     categories, respectively.                                                     rehydration of the data set using tweet IDs is described on the
                                                                                   GitHub page of the data set [28].

     https://publichealth.jmir.org/2022/2/e32355                                                         JMIR Public Health Surveill 2022 | vol. 8 | iss. 2 | e32355 | p. 5
                                                                                                                              (page number not for citation purposes)
XSL• FO
RenderX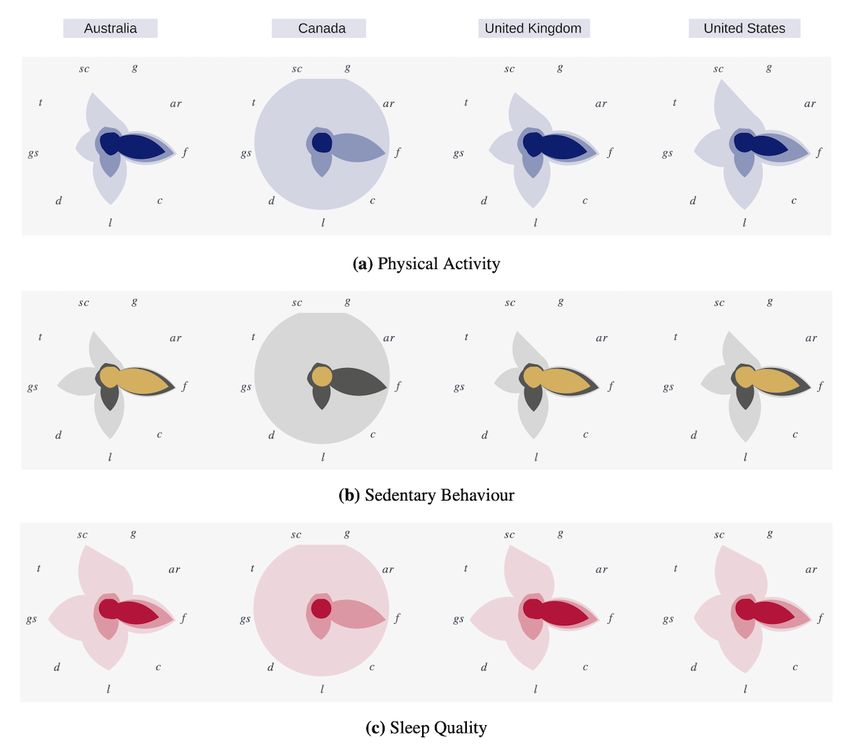
JMIR PUBLIC HEALTH AND SURVEILLANCE                                                                            Shakeri Hossein Abad et al

     LPHEADA comprises 366,405 labels for 122,135 unique tweets         assigned a unique integer, known as TweetID. Each ID is
     generated by 72,749 unique users between November 28, 2018,        mapped to the core Twitter metadata and to 3 crowd-generated
     and June 19, 2020. This data set is organized into 12 subsets (3   labels for binary and multi-class classification tasks. Figure 3
     PASS categories for each of the 4 countries). Table 1 provides     visualizes this hierarchy. As illustrated in this figure, for each
     the demographics of the data set, including the number of tweets   labeled tweet, LPHEADA provides the following data
     per PASS category for each country, labels’ characteristics, and   categories.
     demographics characteristics of the users. Each unique tweet is

     https://publichealth.jmir.org/2022/2/e32355                                           JMIR Public Health Surveill 2022 | vol. 8 | iss. 2 | e32355 | p. 6
                                                                                                                (page number not for citation purposes)
XSL• FO
RenderX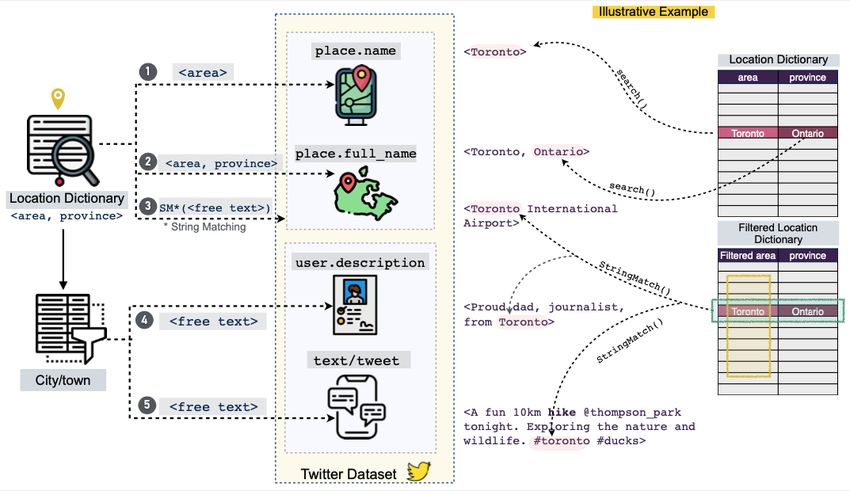
JMIR PUBLIC HEALTH AND SURVEILLANCE                                                                                               Shakeri Hossein Abad et al

     Table 1. Characteristics of the data set.a
      Variable        Canada (N=98,722)                      United States (N=10,193)      United Kingdom (N=9154)                 Australia (N=4067)

                      PAb           SQc            SBd       PA          SQ       PA       PA        SQ           SB               PA             SQ              SB
      Tweets, n       48,576        32,779         17,367    5053        3065    2074    4076        3001         2077             2216           1312            539
      (%)             (49.2)        (33.2)         (17.59)   (49.57)     (30.07) (20.35) (44.53)     (32.78)      (22.69)          (54.49)        (32.26)         (13.25)
      Labels
      Binary, n (%)
      Yes             15,337        11,814         6514      1196        1032    731     1092        766          356 (17.14) 729                 499             75
                      (31.57)       (36.04)        (37.51)   (23.67)     (33.67) (35.25) (26.79)     (25.52)                  (32.9)              (38.03)         (13.91)
      No              33,239        20,965         10,853    3857        2033    1343    2984        2235         1721             1487           813             469
                      (68.43)       (63.96)        (62.49)   (76.33)     (66.33) (64.75) (73.21)     (74.48)      (82.86)          (67.1)         (61.97)         (87.01)
      Multi-class, n (%)
      YY              17,298        12,818         7174      1431        1150    831     1227        934          468 (22.53) 846                 566             97 (18)
                      (35.61)       (39.1)         (41.31)   (28.32)     (37.52) (40.07) (30.1)      (31.12)                  (38.18)             (43.14)
      YN              6583          7720           1895      1445        1104    623     1037        1017         916 (44.1)       905            404             147
                      (13.55)       (23.55)        (10.91)   (28.6)      (36.02) (30.04) (25.44)     (33.89)                       (40.84)        (30.79)         (27.27)
      NY              4407          2242           1471      634         215      147      226       332          118 (5.68)       208            72 (5.49)       33 (6.12)
                      (9.07)        (6.84)         (8.47)    (12.55)     (7.01)   (7.09)   (5.54)    (11.06)                       (9.39)
      NN              19,622        9339           6502      1512        564      469     1559       694          572 (27.54) 233                 258             258
                      (40.39)       (28.49)        (37.44)   (29.92)     (18.4)   (22.61) (38.25)    (23.13)                  (10.51)             (19.66)         (47.87)
      NC              666           660            325       31 (0.61)   32       10       27        24 (0.8)     3 (0.14)         24 (1.08)      12 (0.91)       4 (0.74)
                      (1.37)        (2.01)         (1.87)                (1.04)   (0.48)   (0.66)
      Users, n
      Unique          22,601        16,984         11,490    4911        2994     2048     3810      2653         2002             1735           1004            517
      Valid           21,772        14,919         10,912    3660        2614     1759     2614      2157         1840             1531           858             517
      Gender, n (%)
      Female          8471          7270           4486      1448        1537     860     911        1068         625 (33.97) 520                 401             205
                      (38.91)       (48.73)        (41.11)   (39.56)     (58.8)   (48.89) (34.85)    (49.51)                  (33.96)             (46.74)         (39.65)
      Male            13,301        7649           6426      2212        1077     899     1703       1089         1215             1011           457             312
                      (61.09)       (51.27)        (58.89)   (60.44)     (41.2)   (51.11) (65.15)    (50.49)      (66.03)          (66.04)        (53.26)         (60.35)
      Age range (years), n (%)
      ≤18             1772          2372           1361      490         518     318     136         248          136 (7.39)       114            132             68
                      (8.14)        (15.9)         (12.47)   (13.39)     (19.82) (18.08) (5.2)       (11.5)                        (7.45)         (15.38)         (13.15)
      19-29           5804          5575           3358      1469        1450    841     639         784          539 (29.29) 421                 301             152
                      (26.66)       (37.37)        (30.77)   (40.14)     (55.47) (47.81) (24.45)     (36.35)                  (27.5)              (35.08)         (29.4)
      30-39           5609          3265           2605      761         363     302     705         540          486 (26.41) 421                 209             139
                      (25.76)       (21.88)        (23.87)   (20.79)     (13.89) (17.17) (26.97)     (25.03)                  (27.5)              (24.36)         (26.88)
      ≥40             8527          3707           3588      940         283     298     1137        585          659 (35.82) 575                 216             158
                      (39.16)       (24.85)        (32.88)   (25.68)     (10.83) (16.94) (43.5)      (27.12)                  (37.56)             (25.17)         (30.56)
      Top 5 cities
                      Toronto       Toronto        Toronto   Los Ange- Hous-      Los      Cardiff   Leeds        Glasgow          Sydney         Sydney          Sydney
                                                             les       ton        Ange-
                                                                                  les
                      Ottawa        Calgary        Calgary   Houston     Los      Hous-    East      Sheffield Manchester Mel-                    Mel-            Mel-
                                                                         Ange-    ton      Mid-                           bourne                  bourne          bourne
                                                                         les               lands
                      Calgary       Edmon-         Ottawa    Manhat-     San      Brook- Bristol     London       Sheffield        Brisbane       Brisbane        Brisbane
                                    ton                      tan         Anto-    lyn
                                                                         nio
                      Vancou-       Ottawa         Edmon-    Chicago     Chica- Chica- Lam-          Liver-       Leeds            Perth          Adelaide        Perth
                      ver                          ton                   go     go     beth          pool

     https://publichealth.jmir.org/2022/2/e32355                                                              JMIR Public Health Surveill 2022 | vol. 8 | iss. 2 | e32355 | p. 7
                                                                                                                                   (page number not for citation purposes)
XSL• FO
RenderX
JMIR PUBLIC HEALTH AND SURVEILLANCE Shakeri Hossein Abad et al
Variable Canada (N=98,722) United States (N=10,193) United Kingdom (N=9154) Australia (N=4067)
PAb SQc SBd PA SQ PA PA SQ SB PA SQ SB
Edmon- Montréal Vancou- Florida Brook- Flori- Liver- Scot- Edinburgh Adelaide Perth Adelaide
ton ver lyn da pool land
Source, n (%)
Organiza- 3109 727 1105 63 (1.72) 97 76 368 94 143 (7.77) 135 22 (2.56) 26 (5.0)
tion (14.28) (4.87) (10.13) (3.71) (4.32) (14.08) (4.36) (8.82)
Individual 18,663 14,192 9807 3391 2551 1638 2246 2063 1697 1396 836 491
(85.72) (95.13) (89.87) (92.65) (97.59) (93.12) (85.92) (95.64) (92.23) (91.18) (97.44) (95.0)
a
The 3 labels collected for each tweet were consolidated into a single label using majority voting. The discrepancy between the numbers of binary and
multi-class labels is because of how majority voting calculates the truth label for each of these categories.
b
PA: physical activity.
c
SQ: sleep quality.
d
SB: sedentary behavior.
Figure 3. Overview of information tracking using TweetID. Each tweet or text is identified by a unique TweetID (provided by LPHEADA). This ID
is mapped to metadata that includes user_id, place_name, place_full_name, user_description, and created_at. A total of 3 labels are provided for each
TweetID that can be used for developing machine learning models. user_id was used to infer the demographics of each tweet, including gender, age
range, and source. Adjusted time (month/day/hour) was extracted using created_at, and text, place_name, place_full_name, and user_description were
used to identify the city and state or province mapped to each TweetID. LPHEADA: Labelled Digital Public Health Data Set.
https://publichealth.jmir.org/2022/2/e32355 JMIR Public Health Surveill 2022 | vol. 8 | iss. 2 | e32355 | p. 8
(page number not for citation purposes)
XSL• FO
RenderXJMIR PUBLIC HEALTH AND SURVEILLANCE Shakeri Hossein Abad et al
Labels presents self-reported PASS surveillance and l1=0 otherwise.
Let L denote the set of j unique class labels,t represent the tweet Like the multi-class category, each tweet is mapped to a
text, and wk represent the kth worker who labeled the tweet, quadruple, and there is a class called unclear (l3) with j=3. The
where k ∈ {1,2,3}. Each lj ∈ L is defined based on two binary labels did not directly come from the AMT workers and
were generated by dichotomizing the collected labels.
conditions: whether the tweet is self-reported (c1 ∈ {0,1}) and
whether the tweet reports a recent PASS experience (c2 ∈ {0,1}). User’s Demographic Data
For each PASS category across the 4 countries, the data set In the demographic data set, each tweet t is mapped to quadruple
contains the following 2 subsets of labels for each tweet. D = ⟨tweetID,a,g,o⟩, where g ∈{male, female} represents the
gender of the user who posted the tweet, a ∈
Multi-class Labels
{≤18,19-29,30-39,40≤} represents their age range, and o ∈
In this subset, each tweet t is mapped to quadruple L = {0,1} shows the source of the tweet (ie, o=1 if the tweet was
⟨tweetID,(w1, lj1),(w2,lj2),(w3,lj3)⟩, where j=5 and each lj is posted by an organization and o=0 otherwise). Table 2 shows
defined based on the values of both c1 and c2 conditions and the demographic distribution of the Canadian data set based on
can be formulated as {11,10,01,00}. We also let workers choose gender and age range of the unique users associated with tweet
a fifth option, called unclear, to ensure they do not give random IDs. We can see that 79.24% (16,027/20,227) of female users
labels to tasks that they are not confident of performing in this data set are inferred to be agedJMIR PUBLIC HEALTH AND SURVEILLANCE Shakeri Hossein Abad et al
Figure 4. Geospatial details of the Canadian data set.
User Object
Temporal Data
This object comprises user’s screen name, description, follower
The temporal data set inferred from the created_at field of the
count, friend count, listed count (ie, the number of public lists
Twitter metadata presents the adjusted time of each tweet based
that the user is a member of), tweet count (ie, the number of
on the tweet’s location. Each row of this data set is presented
tweets issued by the user), and profile characteristics (eg, image,
in the form of T = ⟨tweetID,h,d,m⟩, where h, d, and m represent
color, and URLs).
the hour, weekday, and month associated with each tweet,
respectively. The year value does not need any adjustment and Tweet Object
can be extracted directly from the original created_at field. For This object comprises hashtags mentioned in each tweet, emojis,
example, Figure 1 represents the frequency of tweets in each user mentions, URLs, and media (eg, images and videos). For
PASS category across Canada at the national (Figure 1A) and example, Figure 5 illustrates the distribution of the top 10
city levels (Figures 1B-1D). The highlighted area in Figure 1A hashtags per label for each of the PASS categories in the entire
demonstrates the data set’s temporal windows that can be used data set. Hashtags are basically keywords or word strings
to compare different aspects of PASS surveillance between prefixed with the symbol # that are used for categorizing and
2019 and 2020. communicating tweets pertaining to the same topics. Although
Twitter Metadata the high level of intersection between the hashtags of positive
and negative classes in our data set makes this feature a less
In addition to the inferred data records mentioned above,
discriminating feature for the development of ML models (eg,
TweetIDs presented in LPHEADA can be used to retrieve
annotated hashtags in Figure 5), this field can still be used by
Twitter metadata. This metadata, in addition to the tweet text,
PASS-related advocacy campaigns on Twitter to brand their
place object, time of the tweet, and user IDs, provides more
movement and open up their campaigns to users who need more
details on the tweet and user objects, including the following.
information about the context [29]. As tagged tweets are easily
archived and accessible, the hashtag field can be effectively
leveraged to improve the public’s engagement in digital PHS
discussions.
https://publichealth.jmir.org/2022/2/e32355 JMIR Public Health Surveill 2022 | vol. 8 | iss. 2 | e32355 | p. 10
(page number not for citation purposes)
XSL• FO
RenderXJMIR PUBLIC HEALTH AND SURVEILLANCE Shakeri Hossein Abad et al
Figure 5. The distribution of the top 10 hashtags per label for each of the physical activity, sedentary behavior, and sleep quality categories. The label
on top of each bar graph shows the class of tweets presented in the graph. For example, the YY category presents all tweets that are self-reported and
describe a recent PASS experience. Similarly, YN presents all self-reported tweets but does not present a recent PASS experience. NC presents tweets
with an unclear label. The number at the end of each bar presents the frequency of its corresponding hashtag. The intersections between 2 classes of
labels for each PASS category are annotated using filled circles (•). Same hashtags are tagged with the same number of circles. This figure is based on
all data collected from Canada, the United States, the United Kingdom, and Australia. PASS: physical activity, sedentary behavior, and sleep.
quality, sedentary behavior} and s ∈ {physical activity, sleep
General Release Notes quality, sedentary behaviour}, nij defines the number of answers
We have made our data set publicly available, along with
given to the jth choice (j ∈ {1,2,3,4,5}), as we have 5 choices
instructions and Jupyter Notebooks [30,31] to illustrate the
for each tweet), we calculate LC as follows:
application of the data. All data and code (written in Python 3)
used in this study are available through our GitHub repository
[25]. We provide all necessary instructions, required libraries,
and sample Jupyter Notebooks, allowing replicating our
experiments and using the data set. |s| denotes the size of the surveillance category s, and as we
collect 3 labels for each tweet, the denominators in the entropy
Discussion formula receive the constant value of 3.LC ranges from 0 to 1,
and the values close to 0 show less consistency between
Technical Validation workers’ input. After calculating LC for each PASS category,
To verify the quality of crowd-generated labels and set a we had LC>0.52 for the multi-class labeling and LC>0.73 for
baseline for the data set, we conducted 4 studies. First, we used the binary labeling task.
a series of statistical inference models to verify the quality of To consolidate the collected labels for each tweet, we used the
the labels provided in this data set. Second, we evaluated the majority voting (MV) technique (Table 1). Defining the
semantic consistency between the data sets collected from the
estimated label as , and the submitted label by worker w as
countries included in our repository. Third, we trained and tested
12 binary classifiers using the labels provided in the data set. lw, the MV approach for a binary labeling task assigns 1 to
Finally, to investigate the structural differences between all
if and assigns 0 if otherwise. The discrepancy
subsets of LPHEADA, we conducted linguistic and lexical
between the number of binary and multi-class labels presented
analysis and visualized the results for further comparisons.
in Table 1 is caused by the way that MV approach calculates
Moreover, to address unseen technical issues of the data set, we
the truth label for each of these categories. In addition to MV,
provide a public issue tracker for handling bug reports,
there are models, such as those by David and Skene [33] and
describing solutions to technical issues, data updates, and other
Raykar et al [34] and the generative model of labels, abilities,
issues and contributions.
and difficulties [35], that incorporate the error rate of annotators
Methods of Label Agreement (workers), task complexity, and context-sensitive features into
To measure the consistency of labels generated by AMT the inference process and can be used to predict truth labels
workers, we calculated label consistency (LC) as the average from crowd-labeled data.
entropy of the collected labels for each PASS category [32]. Semantic Consistency
For each tweet ti ∈ Ts, where Ts denotes the set of all tweets
To validate the semantic consistency of the data sets collected
related to surveillance category s ∈ {physical activity, sleep from different countries, we transformed the data set of each
https://publichealth.jmir.org/2022/2/e32355 JMIR Public Health Surveill 2022 | vol. 8 | iss. 2 | e32355 | p. 11
(page number not for citation purposes)
XSL• FO
RenderXJMIR PUBLIC HEALTH AND SURVEILLANCE Shakeri Hossein Abad et al
PASS category into a semantic space of low dimensionality scatterplots presented in Figure 6 illustrate our data sets in a
using latent semantic analysis. For the vector presentation of 2-dimensional latent semantic space. The high level of overlap
each data set, to capture high-level semantics of the text, we between the data sets of each PASS category indicates that the
ran the PASS category of each country through a pretrained data from different countries cover similar semantic space, but
word2vec embedding model. This model contains the space is scaled differently based on the size of the data sets.
300-dimensional vectors of 3 million words and phrases trained
Moreover, to further investigate the internal consistency of the
on 100 billion words from a Google News data set. The resulting
data sets presented in this paper, we trained 3 convolutional
300-dimensional vectors were then averaged for each tweet.
neural network multi-class classifiers (ie, 1 for each PASS
For each tweetT composed of words ⟨w1,w2,...,wn⟩, with category) to classify tweets into Canada, US, Australia, or UK
defining the embedding of wi, the embedding of tweetT can be classes. Given the highly imbalanced distribution of the classes
calculated as: in our data set due to the highly unequal number of samples
from each country, we used the average precision (AP) metric
to measure the discrimination ability of our predictive models.
The poor performance of these classifiers (APPA, 37%; APSB,
We then applied truncated singular value decomposition on the
32%; APSQ, 31%) in detecting each tweet’s country implies a
new vectorized data set and kept the top 2 dimensions of the
data set containing the most variance (eg, those directions in high level of semantic and syntactic cohesion among the 4
vector space of the data set that contain more information). The countries in our data set.
Figure 6. Scatter plots of the first 2 dimensions of latent semantic analysis performed on physical activity, sedentary behavior, and sleep categories,
and classified based on the geographic source of the data.
robust to heterogeneous and imbalanced class distributions.
Classification of PASS Categories Like AUC score, AP is a model-wide and threshold-free
For the PASS classification experiment, we used a standard evaluation metric. However, for imbalance class distributions
convolutional neural network classifier with 1 layer of with the negatives outnumbering the positives, AP is more
convolution with global max-pooling on top of a word2vec informative than AUC, as it mainly evaluates the fraction of
embedding trained on 100 billion words of Google News. The true positive samples among positive predictions and is more
vectors have a dimensionality of 300 and were trained using robust to the relationship between false-positive and
the continuous bag-of-words architecture [36]. We used the false-negative rates [37]. As shown in Table 3, for each of the
binary labels of the data set to train and evaluate the model on Canada, US, and UK data sets, we find a steady increase in the
each of 12 data sets provided in LPHEADA. Owing to the overall performance of the classifier as the size of the data set
imbalanced distribution of binary labels across these data sets increase (ie, |PA|>|SQ|>|SB|). Interestingly, the UK data set
(Table 1), in addition to precision, recall, F1, and area under achieves the highest performance for the PA category among
the curve (AUC) scores, we used AP to measure the weighted all the countries.
mean of precision at different thresholds to make the score
https://publichealth.jmir.org/2022/2/e32355 JMIR Public Health Surveill 2022 | vol. 8 | iss. 2 | e32355 | p. 12
(page number not for citation purposes)
XSL• FO
RenderXJMIR PUBLIC HEALTH AND SURVEILLANCE Shakeri Hossein Abad et al
Table 3. Binary classification of tweets using bidirectional long short-term memory.a
Metrics Country (%)
Canada United States United Kingdom Australia
Physical activity
Precision 78 75 80 65
Recall 78 76 81 68
F1 78 76 80 64
AUCROCb 83 76 84 64
APc 81 75 81 66
Sedentary behavior
Precision 73 62 79 74
Recall 73 64 83 86
F1 73 62 79 80
AUCROC 76 62 63 57
AP 78 65 66 66
Sleep quality
Precision 76 70 73 61
Recall 76 70 76 60
F1 75 70 73 60
AUCROC 81 70 66 63
AP 83 72 71 64
a
The same classifier is used to classify the data from different countries.
b
AUCROC: area under the receiver operating characteristic curve.
c
AP: average precision.
sentences, words, syllables, and characters in each tweet (ie,
Linguistic Properties text readability consensus). Figure 7 illustrates these
To understand and validate the linguistic properties of each data comparisons based on the minimum (red), average (pink), and
set, we measured and visually compared the following metrics maximum (light pink) values of each feature. Although all data
for each PASS category grouped by country: (1) sentence count, sets have similar behavior in terms of each feature’s minimum
(2) grammar score (ie, number of grammar errors), (3) the value, the Canadian data set has a lower score for the average
average number of syllables per word and the average sentence number of syllables per word and the average sentence length
length (ie, Flesch-Kincaid Grade Level index [38]), (4) the for all PASS categories. Interestingly, the sleep quality data set,
average number of words per sentence and the percentage of compared with other PASS categories, has a higher value for
words with 3 or more syllables (ie, Gunning Fog index [39]), the maximum number of grammar errors and sentence count
(5) a combination of average sentence length and percentage metrics, whereas all data sets show the same behavior for the
of difficult words (ie, Dale-Chall readability [40]), (6) sentence minimum and the average values of these metrics. These
length and number of polysyllables (ie, Linsear Write readability location-specific linguistic characteristics should be considered
[40]), (7) number of characters (ie, Coleman-Liau Index when using these data sets to train and evaluate PASS
[40,41]), (8) the average number of characters per word and surveillance ML models. For example, a model trained on the
number of words per sentence (ie, automated readability index Canadian data set may not present some linguistic features of
[38]), and (9) the text standard score based on number of a data set that originated in Australia and vice versa.
https://publichealth.jmir.org/2022/2/e32355 JMIR Public Health Surveill 2022 | vol. 8 | iss. 2 | e32355 | p. 13
(page number not for citation purposes)
XSL• FO
RenderXJMIR PUBLIC HEALTH AND SURVEILLANCE Shakeri Hossein Abad et al
Figure 7. Linguistic comparisons across different countries. ar: automated readability index; c: Coleman-Liau Index; d: Dale-Chall readability; f:
Flesch-Kincaid grade level; g: Gunning Fog index; gs: grammar score; l: Linsear Write readability; sc: sentence count; t: text readability consensus.
context-sensitive terms for filtering all the PASS categories are
Limitations comprehensive enough, we used domain-specific ontologies,
Several limitations should be noted. First, we collected our data WordNet [42], and NLP techniques (eg, topic modeling,
set using Twitter’s free streaming API, which returns a random language modeling, and lexical analysis) to detect latent word
sample of about only 1% of global public tweets produced at a patterns to identify PASS-related contexts in unstructured text.
given time. However, our data set spans 19 months of tweets
posted by users from 4 English-speaking countries, which Despite these limitations, the curated, validated [43], and labeled
provides enough diversity and coverage for conducting data set provided in this paper will allow researchers and
retrospective and comparative digital public PASS studies. practitioners to delve into different aspects of digital PASS
Moreover, the search terms used to filter the data set could have surveillance by developing ML, NLP, and exploratory models.
impacted the topics included in our data set, which may We believe that the novelty and comprehensiveness of this data
influence the generalizability of the results derived from this set will help the development, evaluation, and deployment of
data set. To address this and to ensure the lists of digital PASS surveillance systems, and it will be an invaluable
resource for both public health researchers and practitioners.
Acknowledgments
This work was supported by a postdoctoral scholarship from the Libin Cardiovascular Institute and the Cumming School of
Medicine, University of Calgary. Additionally, this work was supported by a Discovery Grant from the Natural Sciences and
Engineering Research Council of Canada (RGPIN-2014-04743). The Public Health Agency of Canada funded the Amazon
Mechanical Turk costs.
https://publichealth.jmir.org/2022/2/e32355 JMIR Public Health Surveill 2022 | vol. 8 | iss. 2 | e32355 | p. 14
(page number not for citation purposes)
XSL• FO
RenderXJMIR PUBLIC HEALTH AND SURVEILLANCE Shakeri Hossein Abad et al
Authors' Contributions
ZSHA was responsible for data collection and curation, model development, documentation and maintenance of the data set, data
analysis and visualization and wrote the paper. GB and WT reviewed the paper and provided comments. JL contributed to the
conception and design of the study and revised the manuscript.
Conflicts of Interest
None declared.
Multimedia Appendix 1
A complete list of the regular expressions and filtering words for each PASS domain.
[PDF File (Adobe PDF File), 63 KB-Multimedia Appendix 1]
References
1. Kemp S. Digital 2020: July global statshot. Datareportal. 2020. URL: https://datareportal.com/reports/
digital-2020-july-global-statshot [accessed 2021-01-08]
2. Fung IC, Tse ZT, Fu KW. The use of social media in public health surveillance. Western Pac Surveill Response J
2015;6(2):3-6. [doi: 10.5365/wpsar.2015.6.1.019] [Medline: 26306208]
3. Brownstein JS, Freifeld CC, Madoff LC. Digital disease detection--harnessing the Web for public health surveillance. N
Engl J Med 2009;360(21):2153-2157. [doi: 10.1056/nejmp0900702] [Medline: 19423867]
4. Sinnenberg L, Buttenheim AM, Padrez K, Mancheno C, Ungar L, Merchant RM. Twitter as a tool for health research: a
systematic review. Am J Public Health 2017;107(1):e1-e8. [doi: 10.2105/ajph.2016.303512] [Medline: 27854532]
5. Pershad Y, Hangge P, Albadawi H, Oklu R. Social medicine: Twitter in healthcare. J Clin Med 2018;7(6):121. [doi:
10.3390/jcm7060121] [Medline: 29843360]
6. Raghupathi W, Raghupathi V. Big data analytics in healthcare: promise and potential. Health Inf Sci Syst 2014;2:3. [doi:
10.1186/2047-2501-2-3] [Medline: 25825667]
7. Shakeri Hossein Abad Z, Kline A, Sultana M, Noaeen M, Nurmambetova E, Lucini F, et al. Digital public health surveillance:
a systematic scoping review. NPJ Digit Med 2021;4(1):41. [doi: 10.1038/s41746-021-00407-6] [Medline: 33658681]
8. Teutsch SM. Considerations in planning a surveillance system. In: Lee LM, Teutsch SM, Thacker SB, St. Louis ME, editors.
Principles and practice of public health surveillance. Oxford: Oxford University Press; 2010:18-28.
9. Declich S, Carter AO. Public health surveillance: historical origins, methods and evaluation. Bull World Health Organ
1994;72(2):285-304 [FREE Full text] [Medline: 8205649]
10. Croner CM. Public health, GIS, and the internet. Annu Rev Public Health 2003;24:57-82. [doi:
10.1146/annurev.publhealth.24.012902.140835] [Medline: 12543872]
11. Graham M, Hale SA, Gaffney D. Where in the world are you? Geolocation and language identification in Twitter. Prof
Geogr 2014;66(4):568-578. [doi: 10.1080/00330124.2014.907699]
12. Doan S, Ritchart A, Perry N, Chaparro JD, Conway M. How do you #relax when you’re #stressed? A content analysis and
infodemiology study of stress-related tweets. JMIR Public Health Surveill 2017;3(2):e35. [doi: 10.2196/publichealth.5939]
[Medline: 28611016]
13. Woo H, Sung Cho H, Shim E, Lee JK, Lee K, Song G, et al. Identification of keywords from Twitter and Web blog posts
to detect influenza epidemics in Korea. Disaster Med Public Health Prep 2018;12(3):352-359. [doi: 10.1017/dmp.2017.84]
[Medline: 28756796]
14. Chorianopoulos K, Talvis K. Flutrack.org: open-source and linked data for epidemiology. Health Informatics J
2016;22(4):962-974. [doi: 10.1177/1460458215599822] [Medline: 26351261]
15. Jimeno-Yepes A, MacKinlay A, Han B, Chen Q. Identifying diseases, drugs, and symptoms in Twitter. Stud Health Technol
Inform 2015;216:643-647. [Medline: 26262130]
16. Aphinyanaphongs Y, Lulejian A, Brown DP, Bonneau R, Krebs P. Text classification for automatic detection of e-cigarette
use and use for smoking cessation from Twitter: a feasibility pilot. Pac Symp Biocomput 2016;21:480-491 [FREE Full
text] [Medline: 26776211]
17. Mowery D, Smith H, Cheney T, Stoddard G, Coppersmith G, Bryan C, et al. Understanding depressive symptoms and
psychosocial stressors on Twitter: a corpus-based study. J Med Internet Res 2017;19(2):e48. [doi: 10.2196/jmir.6895]
[Medline: 28246066]
18. Müller MM, Salathé M. Crowdbreaks: tracking health trends using public social media data and crowdsourcing. Front
Public Health 2019;7:81. [doi: 10.3389/fpubh.2019.00081] [Medline: 31037238]
19. O'Connor K, Pimpalkhute P, Nikfarjam A, Ginn R, Smith KL, Gonzalez G. Pharmacovigilance on Twitter? Mining tweets
for adverse drug reactions. AMIA Annu Symp Proc 2014;2014:924-933 [FREE Full text] [Medline: 25954400]
20. Watkins NG, Lovell NH, Larsen ME. SMCT - an innovative tool for mental health analysis of Twitter data. Annu Int Conf
IEEE Eng Med Biol Soc 2018;2018:4114-4117. [doi: 10.1109/EMBC.2018.8513257] [Medline: 30441260]
https://publichealth.jmir.org/2022/2/e32355 JMIR Public Health Surveill 2022 | vol. 8 | iss. 2 | e32355 | p. 15
(page number not for citation purposes)
XSL• FO
RenderXJMIR PUBLIC HEALTH AND SURVEILLANCE Shakeri Hossein Abad et al
21. Zhao L, Chen J, Chen F, Wang W, Lu CT, Ramakrishnan N. Simnest: social media nested epidemic simulation via online
semi-supervised deep learning. In: 2015 IEEE International Conference on Data Mining. 2015 Presented at: ICDM'15;
November 14-17, 2015; Atlantic City p. 639-648. [doi: 10.1109/icdm.2015.39]
22. Lee IM, Shiroma EJ, Lobelo F, Puska P, Blair SN, Katzmarzyk PT, Lancet Physical Activity Series Working Group. Effect
of physical inactivity on major non-communicable diseases worldwide: an analysis of burden of disease and life expectancy.
Lancet 2012;380(9838):219-229. [doi: 10.1016/s0140-6736(12)61031-9] [Medline: 22818936]
23. Roberts KC, Butler G, Branchard B, Rao DP, Otterman V, Thompson W, et al. The physical activity, sedentary behaviour
and sleep (PASS) indicator framework. Health Promot Chronic Dis Prev Can 2017;37(8):252-256. [doi:
10.24095/hpcdp.37.8.04] [Medline: 28800295]
24. Paolacci G, Chandler J, Ipeirotis PG. Running experiments on Amazon mechanical turk. Judgm Decis Mak 2010;5(5):411-419.
25. Filtering tweets by location. Twitter developer platform. URL: https://developer.twitter.com/en/docs/tutorials/
filtering-tweets-by-location [accessed 2021-01-12]
26. Wang Z, Hale S, Adelani DI, Grabowicz P, Hartman T, Flöck F, et al. Demographic inference and representative population
estimates from multilingual social media data. In: Procedings of the 2019 World Wide Web Conference. New York:
Association for Computing Machinery; 2019 Presented at: WWW'19; May 13-17, 2019; San Francisco p. 2056-2067. [doi:
10.1145/3308558.3313684]
27. Developer agreement and policy. Twitter developer platform. 2020. URL: https://developer.twitter.com/en/developer-terms/
agreement-and-policy [accessed 2020-08-01]
28. Data intelligence for health lab: LPHEADA-labelled-public-HEAlth-DAtaset. Github. URL: https://github.com/
data-intelligence-for-health-lab/Lpheada-Labelled-Public-HEAlth-DAtaset [accessed 2022-02-03]
29. Ojo A, Guntuku SC, Zheng M, Beidas RS, Ranney ML. How health care workers wield influence through Twitter hashtags:
retrospective cross-sectional study of the gun violence and COVID-19 public health crises. JMIR Public Health Surveill
2021;7(1):e24562. [doi: 10.2196/24562] [Medline: 33315578]
30. Perez F, Granger BE. IPython: a system for interactive scientific computing. Comput Sci Eng 2007;9(3):21-29. [doi:
10.1109/mcse.2007.53]
31. Kluyver T, Ragan-Kelley B, Pérez F, Granger B, Bussonnier M, Frederic J, Jupyter Development Team. Jupyter notebooks
- a publishing format for reproducible computational workflows. In: Proceedings of the 20th International Conference on
Electronic Publishing. Amsterdam: IOS Press; 2016 Presented at: ELPUB '16; June 7-9, 2016; Göttingen p. 87-90. [doi:
10.3233/978-1-61499-649-1-87]
32. Zheng Y, Li G, Li Y, Shan C, Cheng R. Truth inference in crowdsourcing: is the problem solved? Proc VLDB Endow
2017;10(5):541-552. [doi: 10.14778/3055540.3055547]
33. Dawid AP, Skene AM. Maximum likelihood estimation of observer error-rates using the EM algorithm. J R Stat Soc Ser
C Appl Stat 1979;28(1):20-28. [doi: 10.2307/2346806]
34. Raykar VC, Yu S, Zhao LH, Valadez GH, Florin C, Bogoni L, et al. Learning from crowds. J Mach Learn Res
2010;11(43):1297-1322.
35. Whitehill J, Wu TF, Bergsma J, Movellan J, Ruvolo P. Whose vote should count more: optimal integration of labels from
labelers of unknown expertise. In: Proceedings of the 22nd International Conference on Neural Information Processing
Systems. Red Hook: Curran Associates; 2009 Presented at: NIPS '09; December 7-10, 2009; Vancouver p. 2035-2043.
36. Mikolov T, Sutskever I, Chen K, Corrado G, Dean J. Distributed representations of words and phrases and their
compositionality. In: Proceedings of the 26th International Conference on Neural Information Processing Systems - volume
2. Red Hook: Curran Associates; 2013 Presented at: NIPS '13; December 5-10, 2013; Lake Tahoe p. 3111-3119.
37. Saito T, Rehmsmeier M. The precision-recall plot is more informative than the ROC plot when evaluating binary classifiers
on imbalanced datasets. PLoS One 2015;10(3):e0118432 [FREE Full text] [doi: 10.1371/journal.pone.0118432] [Medline:
25738806]
38. Kincaid JP, Fishburne Jr RP, Rogers RL, Chissom BS. Derivation of new readability formulas (automated readability index,
fog count and flesch reading ease formula) for navy enlisted personnel. Naval Education and Training Command. 1975.
URL: https://www.readcube.com/articles/10.21236%2Fada006655 [accessed 2021-07-09]
39. Gunning R. Technique of clear writing. Toronto: McGraw-Hill; 1952.
40. Mohammadhassanzadeh H, Sketris I, Traynor R, Alexander S, Winquist B, Stewart SA. Using natural language processing
to examine the uptake, content, and readability of media coverage of a pan-Canadian drug safety research project:
cross-sectional observational study. JMIR Form Res 2020;4(1):e13296. [doi: 10.2196/13296] [Medline: 31934872]
41. Coleman M, Liau TL. A computer readability formula designed for machine scoring. J Appl Psychol 1975;60(2):283-284.
[doi: 10.1037/h0076540]
42. Miller GA. WordNet: a lexical database for English. Commun ACM 1995;38(11):39-41. [doi: 10.1145/219717.219748]
43. Shakeri Hossein Abad Z, Butler GP, Thompson W, Lee J. Crowdsourcing for machine learning in public health surveillance:
lessons learned from Amazon mechanical turk. J Med Internet Res 2022;24(1):e28749 [FREE Full text] [doi: 10.2196/28749]
[Medline: 35040794]
https://publichealth.jmir.org/2022/2/e32355 JMIR Public Health Surveill 2022 | vol. 8 | iss. 2 | e32355 | p. 16
(page number not for citation purposes)
XSL• FO
RenderXJMIR PUBLIC HEALTH AND SURVEILLANCE Shakeri Hossein Abad et al
Abbreviations
AMT: Amazon Mechanical Turk
AP: average precision
API: application programming interface
AUC: area under the curve
DPHS: digital public health surveillance
HIT: human intelligence task
LC: label consistency
LPHEADA: Labelled Digital Public Health Dataset
ML: machine learning
MV: majority voting
NLP: natural language processing
PASS: physical activity, sedentary behavior, and sleep
PHS: public health surveillance
Edited by Y Khader; submitted 23.07.21; peer-reviewed by N Zhang, M Lotto, K Kishore; comments to author 16.08.21; revised
version received 02.10.21; accepted 13.10.21; published 14.02.22
Please cite as:
Shakeri Hossein Abad Z, Butler GP, Thompson W, Lee J
Physical Activity, Sedentary Behavior, and Sleep on Twitter: Multicountry and Fully Labeled Public Data Set for Digital Public Health
Surveillance Research
JMIR Public Health Surveill 2022;8(2):e32355
URL: https://publichealth.jmir.org/2022/2/e32355
doi: 10.2196/32355
PMID:
©Zahra Shakeri Hossein Abad, Gregory P Butler, Wendy Thompson, Joon Lee. Originally published in JMIR Public Health and
Surveillance (https://publichealth.jmir.org), 14.02.2022. This is an open-access article distributed under the terms of the Creative
Commons Attribution License (https://creativecommons.org/licenses/by/4.0/), which permits unrestricted use, distribution, and
reproduction in any medium, provided the original work, first published in JMIR Public Health and Surveillance, is properly
cited. The complete bibliographic information, a link to the original publication on https://publichealth.jmir.org, as well as this
copyright and license information must be included.
https://publichealth.jmir.org/2022/2/e32355 JMIR Public Health Surveill 2022 | vol. 8 | iss. 2 | e32355 | p. 17
(page number not for citation purposes)
XSL• FO
RenderXYou can also read