Phase 1 Studies Summary of Major Findings of the South Bay Salt Pond Restoration Project, South San Francisco Bay, California
←
→
Page content transcription
If your browser does not render page correctly, please read the page content below
Prepared for South Bay Salt Pond Restoration Project

Phase 1 Studies Summary of Major Findings of the
South Bay Salt Pond Restoration Project,
South San Francisco Bay, California

Open-File Report 2018–1039

U.S. Department of the Interior
U.S. Geological Survey
Cover:
Upper photograph: Pond A21 of the South Bay Salt Pond Restoration Project area, San Francisco, California,
looking westward from northeastern corner of pond. (Photograph by Chris Benton, University of California,
Berkeley, July 2014.)

Lower photograph: Black simmer (Rynchops niger) flying amid shorebirds and terns at Redwood Shores.
(Photograph by M. Bruce Grosjean, Pelican Media, 2012.)
Phase 1 Studies Summary of Major Findings of the
South Bay Salt Pond Restoration Project,
South San Francisco Bay, California
By Laura Valoppi

Prepared for South Bay Salt Pond Restoration Project

Open-File Report 2018–1039

U.S. Department of the Interior
U.S. Geological Survey
U.S. Department of the Interior
RYAN K. ZINKE, Secretary

U.S. Geological Survey
William H. Werkheiser, Deputy Director
   exercising the authority of the Director

For more information on the USGS—the Federal source for science about the Earth,
its natural and living resources, natural hazards, and the environment—visit
https://www.usgs.gov/ or call 1–888–ASK–USGS (1–888–275–8747).

For an overview of USGS information products, including maps, imagery, and publications,
visit https:/store.usgs.gov.

Any use of trade, firm, or product names is for descriptive purposes only and does not imply
endorsement by the U.S. Government.

Although this information product, for the most part, is in the public domain, it also may
contain copyrighted materials as noted in the text. Permission to reproduce copyrighted items
must be secured from the copyright owner.

Suggested citation:
Valoppi, L., 2018, Phase 1 studies summary of major findings of the South Bay Salt Pond Restoration Project,
South San Francisco Bay, California: U.S. Geological Survey Open-File Report 2018–1039, 58 p., plus
appendixes, https://doi.org/10.3133/ofr20181039.

ISSN 2331-1258 (online)
Acknowledgments
Financial support for the Lead Scientist position in the U.S. Geological Survey was provided by the U.S. Geological
Survey, Western Ecological Research Center, the California Coastal Conservancy, and the U.S. Fish and Wildlife
Service.

The Science Team for their knowledge, skill, dedication, and willingness to engage in an adaptive management
process (current principal investigators, in alphabetical order):

Josh Ackerman, U.S. Geological Survey
Kristin Byrd, U.S. Geological Survey
John Callaway, University of San Francisco
Susan De La Cruz, U.S. Geological Survey
Brian Fulfrost, Brian Fulfrost and Associates
James Hobbs, University of California, Davis
Bruce Jaffe, U.S. Geological Survey
Stacy Moskal, U.S. Geological Survey
Janet Thompson, U.S. Geological Survey
Lynne Trulio, San Jose State University
Mark Mavin-DiPasqualie, U.S. Geological Survey
David Schoellhamer, U.S. Geological Survey
Darell Slotton, University of California, Davis
Karine Tokatlian, San Francisco Bay Bird Observatory
Yiwei Wang, San Francisco Bay Bird Observatory
Julian Wood, Point Blue Conservation Science

                                                        iii
The past and current Project Management Team for their unfailing commitment to working together to meet the
goals of the South Bay Salt Pond Restoration Project and to using the best available science in their decision-
making (current members, in alphabetical order):

Ariel Armbruster, Center for Collaborative Policy
Chris Barr, U.S. Fish and Wildlife Service
Rechelle Blank, Santa Clara Valley Water District
John Bourgeois, California State Coastal Conservancy
Brenda Buxton, California State Coastal Conservancy
Laura Choledenko, California State Coastal Conservancy
William DeJager, U.S. Army Corps of Engineers
Matt Gerhart, California State Coastal Conservancy
Conrad Jones, California Department of Fish and Wildlife
John Krause, California Department of Fish and Wildlife
Greg Martinelli, California Department of Fish and Wildlife
Anne Morkill, U.S. Fish and Wildlife Service
Pat Showalter, Santa Clara Valley Water District
Cheryl Strong, U.S. Fish and Wildlife Service
Rachel Tertes, U.S. Fish and Wildlife Service

Reviews of draft versions of this report were done by John Bourgeois, Cheryl Strong, Brenda Buxton, Ariel
Ambruster, the Science Team, and peer reviewers Doug Barnum, U.S. Geological Survey and Sandra Scoggins of
the San Francisco Bay Joint Venture have made this a better document. Thank you all for your comments, edits,
and suggestions.

                                                         iv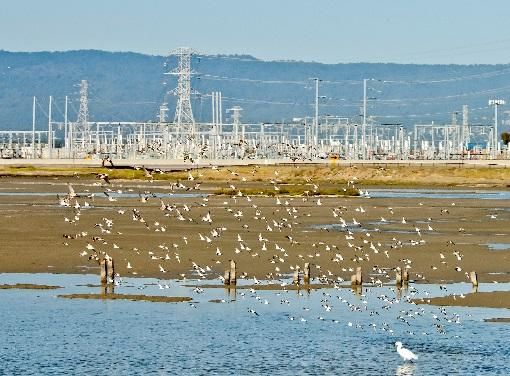
Contents
Acknowledgments...................................................................................................................................................... iii
Executive Summary ....................................................................................................................................................1
Introduction .................................................................................................................................................................2
Marsh, Mice, and Rails ...............................................................................................................................................7
Sediment Dynamics .................................................................................................................................................. 10
Bird Use of Changing Habitats.................................................................................................................................. 14
Mercury..................................................................................................................................................................... 20
Effects on Aquatic Species ....................................................................................................................................... 29
Water Quality ............................................................................................................................................................ 34
Invasive and Nuisance Species ................................................................................................................................ 39
Public Access and Wildlife ........................................................................................................................................ 42
Climate Change and Sea-Level Rise ........................................................................................................................ 45
References Cited ...................................................................................................................................................... 49
Appendixes ............................................................................................................................................................... 58
Appendix 1. Summary of Researcher/Manager Meeting, Milpitas, California, March 15, 2016 ............................ 58
Appendix 2. Survey of Managers on Phase 1 Studies ......................................................................................... 58
Appendix 3. Survey of Researchers on Phase 1 Studies ..................................................................................... 58
Figures
Figure 1. Map showing South Bay Salt Pond Restoration Project area and pond numbers, South San Francisco
Bay, California ........................................................................................................................................................... 3
Figure 2. Diagram showing adaptive management staircase for tidal habitat restoration for the South Bay Salt
Pond Restoration Project, South San Francisco Bay, California................................................................................ 4
Figure 3. Expanded stoplight configuration for evaluating progress toward meeting the Adaptive Management
Plan objectives of the South Bay Salt Pond Restoration Project, South San Francisco Bay, California .................... 6
Figure 4. Graph showing net sediment flux estimated at Dumbarton Bridge, from the wastewater-treatment
plants, and from local tributaries to South San Francisco Bay, California ................................................................ 10
Figure 5. Graph showing sediment accumulation in Ponds A6 and A21, South San Francisco Bay, California .... 11
Figure 6: Graph showing overall South Bay Wintering Bird Abundance ................................................................ 17
Figure 7. Photograph showing Pond A8, which is 40 feet wide with eight gates that can be independently
opened or closed, South Bay Salt Pond Restoration Project, California .................................................................. 21
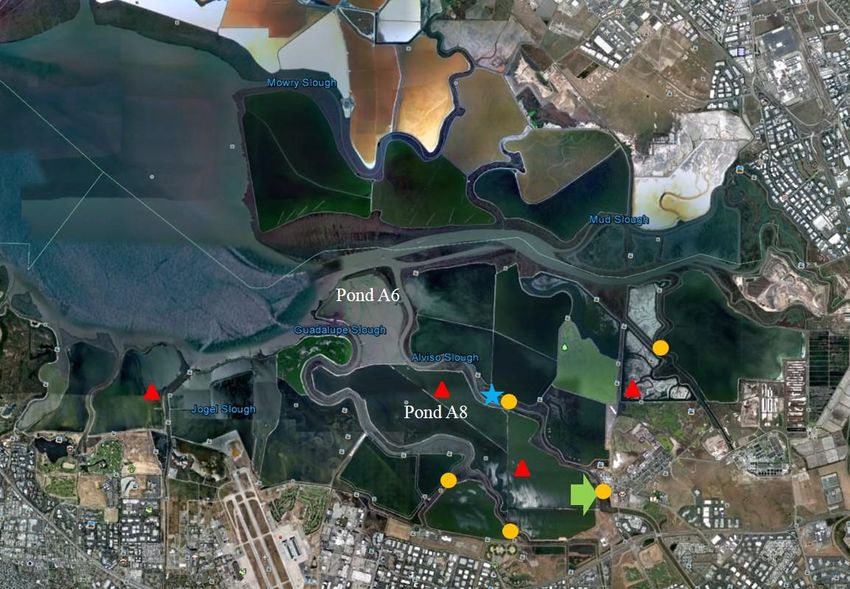
Figure 8. Map showing Pond A8, Alviso Slough, and vicinity, South Bay Salt Pond Restoration
Project, California .................................................................................................................................................... 22
Figure 9. Graph showing history of Pond A8 gate opening and closing, South Bay Salt Pond Restoration
Project, California .................................................................................................................................................... 24
v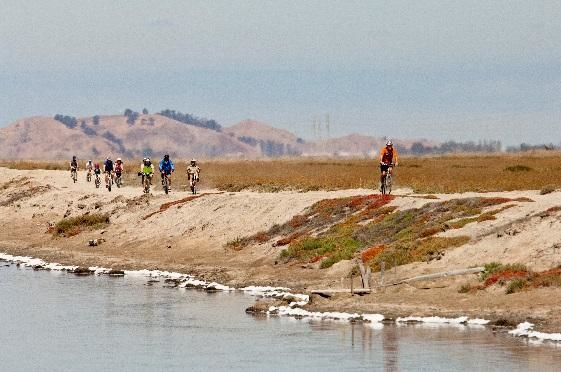
Figure 10. Graph showing mercury concentrations in Forster's Tern eggs , South Bay Salt Pond Restoration
Project, California, 2010–13..................................................................................................................................... 25
Figure11. Graphs showing mercury concentrations in Forster’s Tern and American Avocet eggs after
opening the Pond A8 gates, South Bay Salt Pond Restoration Project, California, 2010–15 .................................. 26
Figure 12. Graphs showing summer and winter assemblages of fish in Alviso Complex, South Bay Salt Pond
Restoration Project, 2010–13 .................................................................................................................................. 31
Figure 13. Graphs showing mean catch-per-unit-effort CPUE of fish and macro-invertebrates in fully tidal
restoration ponds (Tidal Ponds) versus Sloughs in the Alviso Marsh and stations in Lower South Bay habitats
sampled via otter trawls (upper graphs), and comparisons between Tidal Ponds and tidally muted (Managed
Ponds) via beach seine (lower graphs), South Bay Salt Pond Restoration Project, California ................................ 31
Figure 14. Map showing location and features of water quality studies in Alviso Complex, South Bay
Salt Pond Restoration Project, California ................................................................................................................. 36
Figure 15. Graphs showing A8 gate operations effects on dissolved oxygen (DO) in Alviso Slough
(mid-slough station), South Bay Salt Pond Restoration Project, California .............................................................. 37

Conversion Factors
U.S. customary units to International System of Units

                      Multiply                                           By                                  To obtain
                                                                Length

 inch (in.)                                                2.54                              centimeter (cm)
 foot (ft)                                                 0.3048                            meter (m)
 mile (mi)                                                 1.609                             kilometer (km)
                                                                  Area
 acre                                                      0.004047                          square kilometer (km2)
                                                                Volume
 gallon (gal)                                              3.785                             liter (L)
                                                                  Mass
 kilogram (kg)                                           35.2739                             ounce (oz.)

                                                                                vi
Phase 1 Studies Summary of Major Findings of the
South Bay Salt Pond Restoration Project,
South San Francisco Bay, California
By Laura Valoppi

Executive Summary
        The South Bay Salt Pond Restoration Project (Project) is one of the largest restoration efforts in
the United States. It is located in South San Francisco Bay of California. It is unique not only for its
size—more than 15,000 acres—but also for its location adjacent to one of the nation’s largest urban
areas, home to more than 4 million people (Alameda, Santa Clara, and San Mateo Counties). The
Project is intended to restore and enhance wetlands in South San Francisco Bay while providing for
flood management, wildlife-oriented public access, and recreation. Restoration goals of the project are
to provide a mosaic of saltmarsh habitat to benefit marsh species and managed ponds to benefit
waterbirds, throughout 3 complexes and 54 former salt ponds.
        Although much is known about the project area, significant uncertainties remain with a project
of this geographic and temporal scale of an estimated 50 years to complete the restoration. For example,
in order to convert anywhere from 50 to 90 percent of the existing managed ponds to saltmarsh habitat,
conservation managers first enhance the habitat of managed ponds in order to increase use by
waterbirds, and provide migratory, wintering, and nesting habitat for more than 90 species of
waterbirds. Project managers have concluded that the best way to address these uncertainties is to
carefully implement the project in phases and learn from the outcome of each phase. The Adaptive
Management Plan (AMP) identifies specific restoration targets for multiple aspects of the Project and
defines triggers that would necessitate some type of management action if a particular aspect is trending
negatively. U.S. Geological Survey (USGS) biologist Laura Valoppi served as the project Lead Scientist
and oversaw implementation of the AMP in coordination with other members of the Project
Management Team (PMT), comprised of representatives from the California State Coastal
Conservancy, California Department of Fish and Wildlife, the Santa Clara Valley Water District, the
U.S. Army Corps of Engineers, and the U.S. Fish and Wildlife Service.
        To implement the AMP, the PMT have selected and funded applied studies and monitoring
projects to address key uncertainties. This information is used by the PMT to make decisions about
current management of the project area and future restoration actions in order to meet project.

                                                    1
This document summarizes the major scientific findings from studies conducted from 2009 to
2016, as part of the science program that was conducted in conjunction with Phase 1 restoration and
management actions. Additionally, this report summarizes the management response to the study results
under the guidance of the AMP framework and provides a list of suggested studies to be conducted in
“Phase 2–A scorecard summarizing the Project’s progress toward meeting the AMP goals for a range of
Project objectives.” The scoring to date indicates that the Project is meeting or exceeding expectations
for sediment accretion and western snowy plover (Charadrius alexandrinus nivosus) recovery. There is
uncertainty with respect to objectives for California gulls (Larus californicus), California least tern
(Sternula antillarum), steelhead trout (Oncorhynchus mykiss), and regulatory water quality objectives.
Water quality and algal blooms, specifically of the managed ponds, is indicated as trending negative.
However, the vast majority of objectives are trending positive, including increased abundance for a
number of bird guilds, increasing marsh habitat, maintenance of mudflats, visitor experience, estuarine
fish numbers, and special-status marsh species numbers.

Introduction
        The South Bay Salt Pond Restoration Project (Project) is one of the largest restoration efforts in
the United States (fig. 1). It is located in South San Francisco Bay of California. It is unique not only for
its size—more than 15,000 acres—but for its location adjacent to one of the nation’s largest urban areas,
home to more than 4 million people. The Project is intended to restore and enhance wetlands in South
San Francisco Bay while providing for flood management and wildlife-oriented public access and
recreation. Restoration goals of the project are to provide a mosaic of saltmarsh habitat to benefit marsh
species and to provide managed ponds to benefit waterbirds, throughout 3 complexes and 54 former salt
ponds. In order to minimize the loss of the historical use of managed ponds by birds, conservation
managers first increase use of managed ponds by waterbirds over a smaller footprint, and maintain
migratory, wintering, and nesting habitat for more than 90 species of waterbirds. If this can be
accomplished, then anywhere from 50 to 90 percent of the existing managed ponds may be converted to
saltmarsh habitat. In addition to uncertainties related to increasing the use of managed ponds by birds,
there are a number of other uncertainties associated with implementing a project of this scale, such as
whether there is sufficient sediment to support additional marsh habitat. The restoration efforts are
estimated to take approximately 40 years to complete.
        Although much is known about the project area (as documented in the 2007 Environmental
Impact Statement/Report; U.S. Fish and Wildlife Service and California Department of Fish and Game,
2007), significant uncertainties remain with a project of this geographic and temporal scale. Project
managers have concluded that the best way to address these uncertainties is to carefully implement the
project in phases and to learn from the results. How this will be done as described in the Adaptive
Management Plan (AMP) by Trulio and others (2007). U.S. Geological Survey (USGS) biologist Laura
Valoppi served as the project’s Lead Scientist and oversaw implementation of the AMP in coordination
with other members of the Project Management Team (PMT), which included the Lead Scientist and
representatives from the Santa Clara Valley Water District, U.S. Fish and Wildlife Service, the
California Coastal Conservancy, California Department of Fish and Wildlife, the U.S. Army Corps of
Engineers, and the Santa Clara Valley Water District.

                                                      2
To implement the AMP, the PMT selected and funded a series of applied studies and monitoring
projects to generate information about the Project’s impacts. This information is used by the PMT to
make decisions about current management of the project area and future restoration actions in order to
meet project objectives. The applied studies and monitoring is conducted by the Science Team,
comprised of researchers from the USGS, universities, non-profit and consultant organizations.
Not only is adaptive management essential to keeping the project on track towards meeting its
objectives, it is the primary tool identified in the Environmental Impact Statement and Report (EIS/R;
U.S. Fish and Wildlife Service and California Department of Fish and Game, 2007) for avoiding
significant impacts to the environment. Adaptive management (and its associated information
collection) provides project managers information and data that increases their understanding of the
restored system, and provides some answers to key questions. Responses to unanticipated changes can
be based on data and a better understanding of the habitats that are managed and restored. For these
reasons, adaptive management is integral to the project and restoration proceeds following support for
the applied studies and monitoring per the AMP.
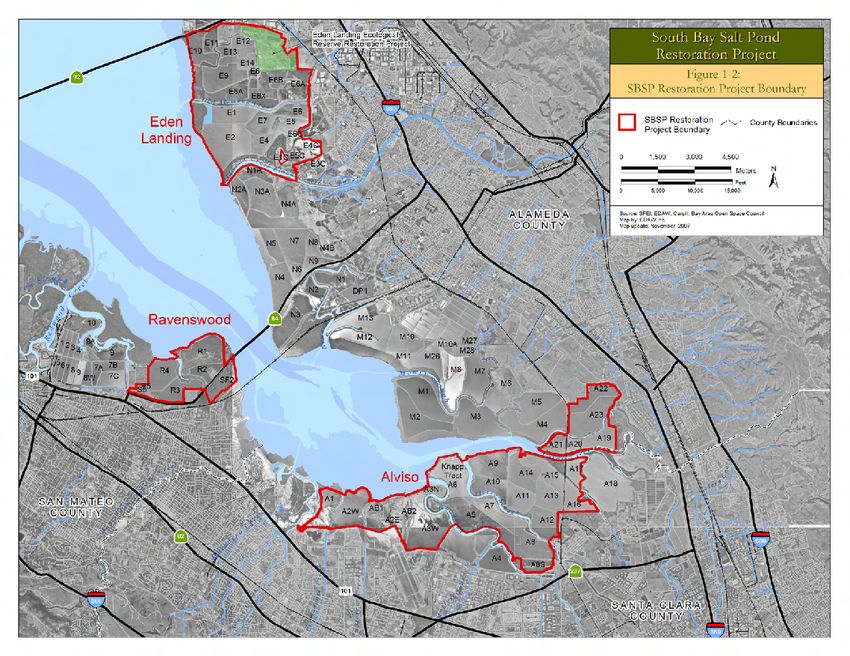
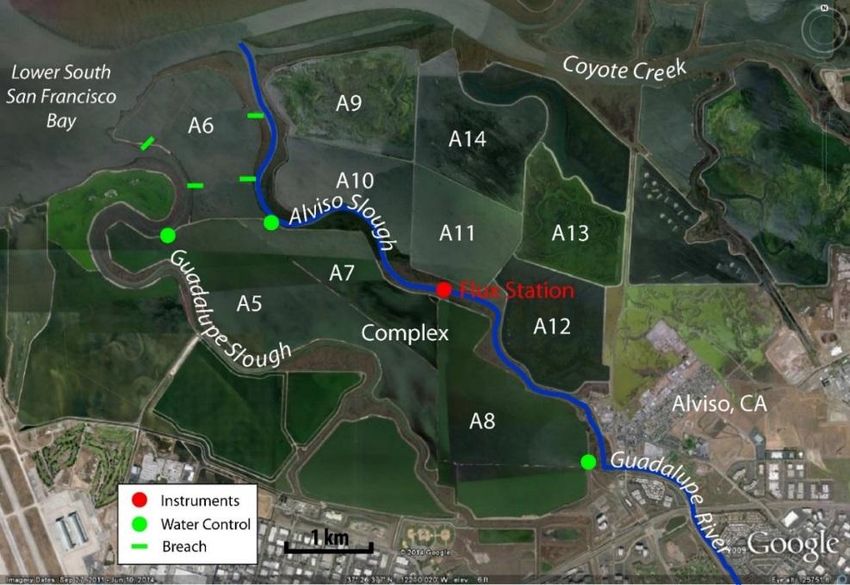
Figure 1. Map showing South Bay Salt Pond Restoration Project area and pond numbers, South San Francisco
Bay, California. Eden Landing complex is owned and operated by the California Department of Fish and Wildlife as
part of the Eden Landing Ecological Reserve. The Ravenswood and Alviso Complexes are owned and operated by
the U.S. Fish and Wildlife Service as part of the Don Edwards San Francisco Bay National Wildlife Refuge.
3The Project developed a number of visions for what the restored ecosystem could look like in 50
years. In particular, the EIS/R for the Project evaluated (1) a 50 percent tidal:50 percent managed pond
alternative in which approximately 50 percent of the Project area is returned to tidal action and 50
percent is managed as ponded habitat, and (2) a 90 percent tidal:10 percent managed pond. The Project
managers agreed that, due to the many uncertainties, the mix of habitats that will optimally meet the
Project objectives—including the amount of tidal restoration and its location—cannot be predicted at
this time. Given this, the Project will implement restoration and management in phases and will use an
adaptive management process for determining how far the system can move toward tidal restoration and
associated marsh habitats, while still meeting the Project objectives. The adaptive management staircase
in (fig. 2) is a conceptual view of this process. Adaptive management will provide the information
needed to determine how far to proceed along the staircase and at what pace. Implicit in the staircase
and the Project’s core mission is that the Project will continue to add tidal habitat to the system, so long
as the other Project objectives are met. Another possibility is that the Project might stop adding tidal
habitat before 50 percent of the Project area is returned to tidal action, if substantial unanticipated
impacts are identified.
Figure 2. Diagram showing adaptive management staircase for tidal habitat restoration for the South Bay Salt
Pond Restoration Project, South San Francisco Bay, California. ISP, Interim Stewardship Plan, where water control
structures were added to the former salt ponds, allowing bay water in.
4A number of key uncertainties are identified in the Adaptive Management Plan (AMP), such as:
• Sediment dynamics: The extent to which tidal marsh restoration inside the ponds might result
in the loss of slough and Bay tidal mudflat habitat outside of the Project ponds.
• Bird use of changing habitats: The extent to which tidal marsh species can be recovered while
maintaining the diversity and abundance of nesting and migratory waterbirds observed prior to
the Project.
• Effects on non-avian species: The extent to which restoration and management may affect fish
and other critical species in the South Bay ecosystem.
• Mercury: The extent to which Project restoration and management actions might result in an
increase in bioavailable mercury in the food chain above pre-Project concentrations.
• Water quality: The effects of pond management regimes on slough and Bay water quality and
important aquatic species.
• Invasive and nuisance species increase: The effects of invasive species, especially invasive
cordgrass (Spartina) hybrids, red fox (Vulpes Vulpes), California gulls, and mosquitoes
(Anopheles spp.).
• Public access and wildlife: Ways in which public access and recreation can be integrated into
the Project without negatively affecting wildlife.
Additionally, climate change and associated sea-level rise, although not specifically identified in
the AMP as an uncertainty, have been the focus of research and management actions to begin enacting
resiliency strategies to ameliorate some of the projected impacts. Appendix 3 of the AMP Report
(EIS/R; U.S. Fish and Wildlife Service and California Department of Fish and Game, 2007) lists several
project objectives associated with the key uncertainties and identifies restoration targets for that
particular objective. The AMP also describes triggers that identify conditions that would result in a
management action response. A trigger is a change in a specific attribute of the ecosystem related to a
particular objective. As an example, if the objective is for sufficient sediment to form a vegetated marsh,
the target is for the rate of accretion of sediment in a pond restored to full tidal flows to be sufficient to
support vegetated marsh within a specified timeframe; the trigger would be if sediment accretion is not
on a trajectory to form vegetated marsh in the expected timeframe. The management actions that result
from a trigger could be reviews of the data to determine if the slower sediment accretion was due to
restoration actions, studies of the effects of a slower development of vegetated marsh, or adjustments to
the design of the restoration to increase sediment accretion in that pond. Several presentations have been
given that describe how adaptive management is being applied for management decisions for the Project
(Valoppi and Bourgeois, 2014; Valoppi and others, 2014a, 2014b, 2015).
5This report provides a summary of the PMT and Science Team evaluation of how well the
Project is meeting the AMP targets for each objective and whether a trigger has been identified that
would indicate the need for additional management action for the Project to stay on track to meet its
goal. This report summarizes the results of that evaluation using an expanded stoplight configuration
(fig. 3) to assess whether the Project is meeting expectations with respect to goals of the AMP.
Meets/exceeds expectations
Uncertain, trending positive
Uncertain
Uncertain, trending negative
Not meeting expectations
Figure 3. Expanded stoplight configuration for evaluating progress toward meeting the Adaptive Management Plan
objectives of the South Bay Salt Pond Restoration Project, South San Francisco Bay, California.
Details of the basis for the Science Team and PMT scoring of each of the key uncertainties is
provided in appendix 1, which summarizes a meeting held on March 15, 2016. Researchers from all
disciplines involved and the management team met together to review the key research results to date,
arrive at a consensus on a ranking of the progress on the AMP objectives, and develop a list of studies
recommended for Phase 2 studies. Appendixes 2 and 3 contain a survey of managers and researchers
respectively on the specific studies conducted as part of Phase 1, the utility of the studies to evaluate the
management questions, the quality of the studies, and recommendations for Phase 2.
Each of the following sections contain a summary of the key findings of the applied studies and
monitoring conducted during Phase 1 pertaining to subject matter of that section. References are
provided at the end of the document, organized by section. Each section also contains the expanded
stoplight score evaluating progress toward meeting the AMP objectives; a summary of the management
actions taken based on the science findings; and a summary of needed studies for Phase 2. Thus, each
section focuses on a particular topic area and provides a comprehensive overview of the key
uncertainties, the context for the issue, a summary of management responses to Phase 1 studies, an
evaluation of progress to date toward the restoration goals, how managers adaptively managed during
Phase 1, and needed studies to be conducted during Phase 2.
6Marsh, Mice, and Rails
Central to the Project is the restoration of former salt ponds back to the original salt marsh
habitat. Salt marsh habitat provides many benefits to the human landscape in terms of improved flood
protection, filtering of contaminants from water, and recreational opportunities (Goals Project, 2015).
This habitat is also essential for the life history of at least 11 different species and subspecies of plants
and wildlife, many of which are listed by the State and Federal governments as threatened or
endangered (U.S. Fish and Wildlife Service, 2013). In particular, two species, the federally endangered
Ridgway’s rail (Rallus obsoletus; formerly known as California clapper rail), and the salt marsh harvest
mouse (reithrodontomys raviventris), can only live in a saltmarsh environment, and both are keystone
species for salt marsh habitat. The rail and mouse now exist in about 10 percent of the area they
formerly occupied, primarily due to loss and conversion of the salt marsh habitat they rely upon (Liu
and others, 2012; U.S. Fish and Wildlife Service, 2013). Restoration of salt marsh habitat is critical to
the recovery of these species.
.
Salt Marsh Harvest Mouse in pickleweed.
Photograph by Pelican Media.
The first construction of the Project was in spring 2006, when the “Island Ponds” (Ponds A19,
A20, and A21) were breached along Coyote Creek, and tidal waters flowed into the ponds. Managers
chose these ponds as they were relatively isolated and small, and did not pose a threat of flooding of
neighboring parcels if breached. These ponds were breached in order to begin an early experiment in
restoration, to study how quickly the marsh developed and how quickly tidal marsh species would
occupy the habitat. In less than 10 years, Pond A21 had enough sediment that 118 acres of marsh plants,
such as cordgrass (Spartina spp.) and pickleweed (Salicornia spp.), became established. The amount of
sediment coming in was monitored (see section, “Sediment”), as was the establishment of salt marsh
plant species. Ponds A19 and A20 have not had marsh habitat establish as quickly; Pond A20 has 33
acres of vegetation established, Pond A19 has 14 acres (Santa Clara Valley Water District and U.S. Fish
and Wildlife Service, 2015).
In July 2014, staff from the San Francisco Estuary Invasive Spartina Project
(http://www.spartina.org/) spotted a Ridgway’s rail inside Pond A21. In 2015, the U.S. Fish and
Wildlife Service began to survey these ponds for the presence of the Ridgway’s rail or the salt marsh
harvest mouse. In July of that year, several of the endangered mice were trapped, and breeding rails
were documented in Pond A21.
7The presence of these two keystone species occurred sooner than had been expected—the AMP
estimated that it would take at least 5–10 years for marsh vegetation to become established, and decades
after substantial marsh vegetation was established before these species would inhabit the newly restored
area.
Non-native, invasive cordgrass species of smooth cordgrass (Spartina alternifora) and its
hybrids with the native California cordgrass (Spartina foliosa) has been the focus of an extensive
identification and control program (San Francisco Estuary Invasive Spartina Project) throughout the San
Francisco Bay, including within the Project area.
This invasive species poses a threat to native marsh habitat (Overton and others, 2014, 2015).
The Project has coordinated removal of invasive cordgrass (Spartina) from the Project area with the
Invasive Spartina Project. The Project has collaborated with the Invasive Spartina Project on
revegetation of marsh plants, surveys for Ridgway’s rail, and other measures to offset declines in marsh
habitat, on Project lands.
Key Uncertainty
How do Ridgway’s rails (California clapper rail) and (or) other key tidal habitat species
(such as the salt mouse harvest mouse) respond to variations in tidal marsh habitat quality
and what are the habitat factors contributing to that response?
Question 1. Is marsh vegetation establishment trending toward reference marsh quality?
Question 2. Does tidal marsh habitat for Ridgway’s rails within the Project area meet
recovery plan criteria for rail habitat? For numbers of rails?
Question 3. Does tidal marsh habitat for salt marsh harvest mice within the Project area
meet recovery plan criteria for mice habitat? For number of mice?
Question 4. How do Ridgway’s rails and/or other key tidal habitat species respond to
variations in tidal marsh habitat quality and what are the habitat factors contributing to
that response?
Key Uncertainty: How do Ridgway’s rails (California clapper rail) and (or) other key Score
tidal habitat species (salt mouse harvest mouse) respond to variations in tidal marsh
habitat quality and what are the habitat factors contributing to that response?
1 Is marsh vegetation establishment trending toward reference marsh quality?
2 Does tidal marsh habitat for Ridgway’s rails within the Project area meet recovery plan
criteria for rail habitat?
3 Does the number of Ridgway’s rails within the Project area meet recovery plan criteria
for number of rails?
4 Does tidal marsh habitat for salt marsh harvest mice within the Project area meet
recovery plan criteria for mice habitat?
5 Does the number of salt marsh harvest mice within the Project area meet recovery plan
criteria number of mice
Meets/exceeds expectations Uncertain, trending positive Uncertain Uncertain, trending negative Not meeting expectations
8Management Responses to Phase 1 Studies
o Marsh habitat has established sooner than the AMP predicted at Pond A21, so no
additional restoration is planned.
o Marsh habitat in Ponds A19 and A20 has occurred more slowly so, as per the AMP,
design of these ponds has been adjusted to construct additional breaches, lower portions of
levees, and excavate pilot channels in order to increase tidal flows into the ponds. These
restoration actions are being planned for Phase 2 of the restoration.
o Managers continue to coordinate with the Invasive Spartina Project to assess and control
occurrences of Spartina hybrids.
Needed Phase 2 Studies for Marsh, Mice, and Rails
o Fund implementation and effectiveness of the weed management plan to control other
invasive species such as pepperweed.
o Repeat satellite imagery techniques used for establishing baseline vegetation types and
extent to assess landscape level changes from Phase 1 restoration actions. The AMP
recommends doing this every 5 years, beginning 5 years after the restored area has
reached vegetation colonization elevation.
o Assess quality of the restored marsh by using adjacent established marshes as reference
sites.
o Conduct rail surveys baywide once the Invasive Spartina Project is no longer conducting
surveys.
o Evaluate marsh restoration projects from other bay restoration sites to evaluate best
practices for features such as upland transition zones/ecotones, marsh mounds, and
revegetation.
9Sediment Dynamics
For the restored tidal marshes to be established and be self-sustaining over time, a certain
amount of mud (sediment) must be available in the Bay waters. Nature’s first step in creating a marsh is
to build up enough sediment in a subsided pond to allow plants to grow, and so those sediments need to
be suspended in Bay waters to reach the restoration site. This sediment also replenishes existing marshes
and mudflats.
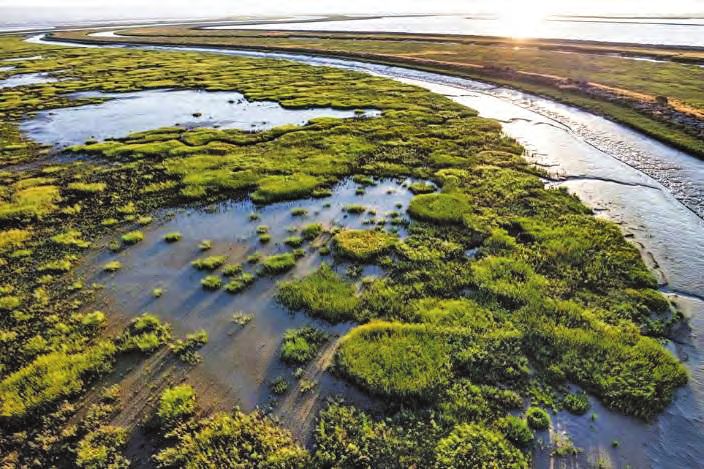
Sedimentation in Pond A21 after breach.
Photograph by Laura Valoppi, U.S. Geological Survey.
A USGS team led by David Schoellhamer has been monitoring the sediment movement (flux)
in and out of South San Francisco Bay and has found flux to be variable from 2009 to 2011
(Schoellhamer, Shellenbarger, and others, 2013; Shellenbarger and others, 2013, 2014; Schoellhamer
and others, 2015). In 2009, there was a net sediment flux going into South Bay of about 242,000 tons,
while the following year there was only about 12,000 tons of sediment going into South Bay. In 2011,
there was a substantial reversal in the direction of sediment, with 485,000 tons of sediment moving out
of South Bay (fig. 4). Other studies by these researchers indicate that overall sediment in the San
Francisco Bay started decreasing in the late 1990s, and it is unknown whether sediment supply will stay
constant or continue to decrease (Schoellhamer, Wright, and others, 2013).
Figure 4. Graph showing net sediment flux estimated at Dumbarton Bridge, from the wastewater- treatment plants,
and from local tributaries to South San Francisco Bay, California. Water year (WY) is from October 1 of that year to
September 30 of the following year. Positive values indicate sediment flux out of South Bay. Negative values
indicate sediment flux into South Bay. Graphic courtesy of Greg Shellenbarger.
10Key Uncertainty
Is there sufficient sediment available in the South Bay to support marsh development without
causing unacceptable impacts to existing habitats?
Question 1. Will sediment accretion in restored tidal areas be adequate to create and to
support emergent tidal habitat ecosystems within the 50-year projected time frame?
Question 2. Will sediment movement into restored tidal areas significantly reduce habitat
area and/or ecological functioning (such as plankton, benthic, fish, or bird diversity or
abundance in the South Bay)?
Question 3. Will restoration activities always result in a net decrease in flood hazard?
During that same time period (2011), John Callaway of University of San Francisco showed
very high sediment accumulation in Pond A6; this pond had only been re-opened to natural tidal flow in
December 2010 (Callaway and others, 2009). Within 28 months, there was an average sediment
deposition of 18.5 in. (470 mm) in 28 months, or about 8 in/yr. The A6 sedimentation rate was even
greater than the rapid rates seen at Pond A21, a 2006 restoration project. Pond A21 accumulated about 8
in. (about 203 millimeters) over 3 years in portions of the pond (fig. 5) (Callaway and others, 2013).
Based on results from Ponds A6 and A21, we expect high rates of sedimentation to continue for future
restored ponds in the South Bay. Both sites had rates of sediment accretion that are orders of magnitude
higher than those found in higher elevation, well-developed tidal marshes. Both Ponds A6 and A21 are
located in the Alviso Complex, an area that has subsided ponds, so higher accumulation rates were
expected. Marsh habitat has become established in Pond A21 and on the higher elevations within Pond
A6, indicating sufficient sediment is available to increase elevation to a level where marsh plants can
colonize. Small areas of pickleweed have become established on the higher elevations of Ponds
E9/E8A/E8X in Eden Landing, indicating the ponds are also accumulating sediment although the rate is
not known. Overall Phase 1 marsh establishment has proceeded rapidly, despite fluctuations in annual
sediment. Future studies could focus on understanding the variability in sediment coming into South
Bay over time and sediment accumulation in Eden Landing and Ravenswood Complexes.
Figure 5. Graph showing sediment accumulation in Ponds A6 and A21, South San Francisco Bay, California.
Graphic courtesy of John Callaway, University of San Francisco.
11In order to track future changes in habitat as restoration efforts progressed, Brian Fulfrost and
associates conducted a 3 year project (2009–11) of obtaining satellite imagery to delineate vegetation,
mudflats, and other habitat within a 33,000 acre area that encompassed the Project area, as well as the
extensive mudflats and vegetated habitats south of the San Mateo Bridge (Fulfrost and others, 2012).
More than 1,000 vegetation surveys were conducted in the field to ground-truth the habitat models that
were developed from the satellite imagery to specific habitat classifications. This project was successful
in characterizing and delineating baseline conditions for several habitat types, but not delineating
mudflat habitat due to technical limitations. The chief limitation was matching the timing of the satellite
fly-over with the tides–it was nearly impossible to have the satellite fly-over at the lowest tides in order
to show the full extent of mudflat habitat. Mudflat habitat is valuable for foraging birds, especially
during winter and migration seasons. This meant that a baseline of mudflat habitat could not be fully
and accurately established with this technology.
A surprising finding of this study was the visibility of biofilm (a “slime” layer that is mixture of
algae, bacteria, organic matter and sediment bound up in a gelatinous mixture on top of the mudflats
that can provide food for some fish and birds feeding on the mudflat) on the surface of exposed mudflat
and discernible in the satellite images. Biofilm is a food source for wildlife that very little is known
about and future investigations could provide valuable insights into San Francisco Bay food webs.
As part of mapping bathymetry (the underwater equivalent to topography) in the Alviso area,
Amy Foxgrover and Bruce Jaffe from USGS (Foxgrover and others, 2014) mapped a small portion of
the mudflat area off Pond A6 (which was breached in December 2010) from early 2010 to late 2013.
That data showed that the mudflat area off Pond A6 has been slightly depositional, increasing elevation
by approximately 4–6 inches between late 2010 and November 2013. Brian Fulfrost of San Francisco
Bay Bird Observatory and Kristin Byrd of the USGS have begun to investigate other techniques for
mapping mudflat habitat and evaluating changes that might be due to restoration actions (Fulfrost and
others, 2015a, 2015b). This work could be continued in Phase 2 to establish baseline mudflat habitats,
and evaluate changes to the extent and quality of the mudflat habitat with restoration.
All of the above studies indicate that currently there is sufficient sediment to restore marshes and
maintain mudflat habitat. Therefore, currently there is a positive trajectory for there to be sufficient
sediment to support marsh restoration and maintain existing habitat. However, there are also data
showing a decreased sediment supply into San Francisco Bay, and future sea-level rise projections
suggest that there will be additional sediment demand for maintenance of marshes and mudflats.
Therefore, managers have begun measures to bring in additional upland fill material and investigate the
potential for beneficial reuse of dredged sediments (Valoppi and others, 2013).
12Key Uncertainty: Is there sufficient sediment in the South Bay to support marsh Score
development without causing unacceptable impacts to existing habitats?
1 Is current vegetated marsh maintained or increased?
2 Will the sediment accretion rate in restored tidal areas be adequate to create and support
emergent tidal habitat ecosystems within the projected 50-year timeframe?
3 Will sediment movement into restored tidal areas significantly decrease mudflat habitat?
Meets/exceeds expectations Uncertain, trending positive Uncertain Uncertain, trending negative Not meeting expectations
Management Responses to Phase 1 Studies
o Managers and researchers are working together in a Mudflat Working Group and the San
Francisco Bay Joint Venture to explore cost-effective methods for mapping the extent
and quality of mudflat habitat.
Needed Phase 2 Studies for Sediment Dynamics
o Continued study is needed to evaluate the amount of sediment entering far South Bay and
the sediment accumulation in breached ponds of Eden Landing Complex and future
breaches at Ravenswood Complex as the spatial variability in sediment accumulation
rates is unknown.
o Studies are needed in Phase 2 to understand the extent of mudflat habitat, to develop
cost-effective and accurate methods to map baseline conditions and track future changes
in mudflats, and to determine how restoration actions may affect the quantity or quality
of that habitat.
o Studies are needed to map the extent of biofilm, to understand its importance to shorebird
foraging, and to learn how restoration actions might alter biofilm.
13Bird Use of Changing Habitats
In addition to restoring tidal marsh, the Project must also provide for birds that use the managed
ponds remaining after some ponds are breached for tidal marsh restoration. A key focus of research
during Phase 1 has been how to enhance and manage pond habitat to support a greater number of birds
in fewer ponds so that more ponds can be restored to tidal marsh. About 93 species of breeding,
wintering, and migratory birds use the managed pond habitat.
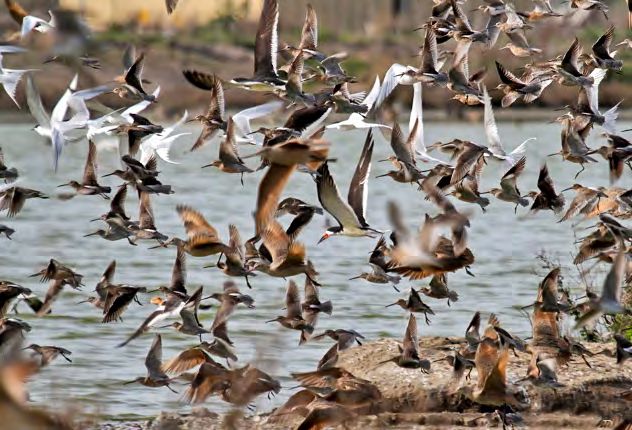
Waterbird use of shallow water areas at Pond SF2.
Photograph by Pelican Media.
A number of studies have been undertaken at restoration sites that have been designed to
increase bird use of managed ponds. These include:
• Bird Island Experiment: Ponds designed with islands for breeding and feeding birds (Ponds
A16, SF2, E12, E13);
• Social Attraction Experiment: Using bird decoys and calls to attract nesting birds that like to
breed in groups, such as terns (Ponds SF2 and A16);
• Habitat Diversity Experiment: Ponds built with varying topography and salinities designed to
increase species diversity by creating habitat diversity for bird use (Ponds E12/E13);
• Multi-species Management Experiment: Ponds that evaluate timing of flood-up to provide
habitat for different bird species during different seasons (Ponds E6A/E6B/E8); and
• Western Snowy Plover (Charadrius alexandrinus nivosus) Habitat Enhancement:
Experimental placement of oyster shells to evaluate effectiveness as camouflage for plover nests
and chicks (Pond E14).
Studies by Josh Ackerman and Alex Hartman of the USGS on the Bird Island Experiment
ponds developed an “island recipe” of the optimal size, shape, and number of islands per pond for
breeding birds (Ackerman and others, 2014; Hartman and others, 2013, 2015; Valoppi and others,
written commun., 2014). Researchers found it was better to have three to five islands per pond in several
ponds rather than a large number of islands in just one pond. Long, skinny islands that are away from
levees, are less than 5 acres in size, and have areas between 1.5 to 3 feet above the water line, are
optimal for nesting birds. This recipe will be useful to managers in the design and construction of
islands in other ponds to increase breeding bird habitat and productivity.
14The Bird Island Experimental islands at Ponds SF2 and A16 have had little use by breeding
birds, and breeding Forester’s terns (Sterna forsteri) and American avocets (Recurvirostra americana)
have moved from ponds undergoing restoration and management actions, thus triggering management
action per the AMP. With consultation with the Pond Management Working Group, social attraction
was determined to be a viable management action. In order to increase the use of the islands in those
ponds, Social Attraction Experiments were set up in 2015 by Josh Ackerman and Alex Hartman in
collaboration with the U.S. Army Corps of Engineers, as a mitigation project for impacts on Caspian
terns (Hydroprogne caspia) in the Pacific Northwest (Hartman and others, 2016). Social attraction
consists of setting up decoys of Caspian terns, along with a solar-powered loudspeaker to emit tern calls,
on a few of the islands at Ponds SF2 and A16. The idea is that real Caspian terns would be attracted to
the decoys and calls and then nest on those islands. Decoys and bird calls were also set up on one island
at each of those ponds for snowy plovers. In the first year, Caspian terns at the islands with decoys
created 224 nests, resulting in a total of about 174 tern chicks fledged. This was unexpected, considering
that very few Caspian terns have nested with the Project area in the past century. Snowy plovers were
not attracted to the decoys/calls.
Other studies conducted by Stacy Moskal of the USGS on Pond SF2 focused on wintering and
migratory bird use, and found that shorebirds often congregated on shallow mounds of dirt
unintentionally created by earth-moving equipment (Moskal and others, 2015). Based on this
observation, in another set of ponds (E12/E13), a Habitat Diversity Experiment was created by
building topographic diversity that varied water depths within the ponds (De La Cruz and others, written
commun., 2016).
In this design, a series of shallow channels snake through the pond bottom, alongside shallow
dirt mounds—both constructed to mimic the terrain favored by the shorebirds. These ponds were also
designed to carry low, medium, and high salinity water in a series of mini “salt ponds.” By creating
habitat diversity through variation in water depth and salinity, managers hope to increase the species
diversity in these ponds. Studies in these ponds are evaluating bird use and invertebrate prey at varying
levels of salinity, the bird use of the shallow mounds for foraging and roosting, and bird use of islands
as nesting habitat (Takekawa and others, 2013; Ackerman and others, 2014; Washburn and others,
2015).
15Key Uncertainty
Can the existing number and diversity of migratory and breeding shorebirds and waterfowl
be supported in a changing (reduced salt pond) habitat area?
Question 1. Will the habitat value and carrying capacity of South Bay for nesting and
foraging migratory and resident birds be maintained or improved relative to current
conditions?
Question 2. Will shallowly flooded ponds or ponds constructed with islands or furrows
provide breeding habitat to support sustainable densities of snowy plovers while
providing foraging and roosting habitat for migratory shorebirds?
Question 3. Will ponds reconfigured and managed to provide target water and salinity
levels significantly increase the prey base for, and pond use by waterfowl, shorebirds and
phalaropes/grebes compared to existing ponds not managed in this manner?
Question 4. To what extent will the creation of large isolated islands in reconfigured
ponds maintain numbers (and reproductive success) of terns and other nesting birds in the
South Bay, while increasing densities of foraging birds over the long term compared to
ponds not managed in this manner?
Question 5. Will pond and panne habitats in restoring tidal habitats provide habitat for
significant numbers of foraging and roosting shorebirds and waterfowl over the long
term?
In ponds E6A, E6B, and E8, a multi-species management experiment that created dry habitat for
the threatened western snowy plover during summer nesting and wet foraging habitat for diving ducks
during the winter is being studied by Susan De La Cruz of the USGS and Karine Tokatlian of the San
Francisco Bay Bird Observatory (De La Cruze and others, 2015). Research will evaluate plover nesting
success in the spring and summer, how a seasonal drying and wetting regime influences benthic
invertebrate prey species for diving ducks in fall and winter, and also evaluate the physical and
landscape characteristics of ponds that enhance diving duck abundance and foraging behavior.
Preliminary results from the plover studies indicate that ponds with a dry pond bottom and internal
water channels resulted in higher plover nesting success. Preliminary results for diving ducks indicate
that there were fewer lesser scaup (a species of diving duck, Aythya affinis) (observed in seasonally dry
ponds compared to unmanaged ponds, while ruddy duck (Oxyura jamaicensis) numbers were similar
between pond types. Diving duck behavior was similar between the seasonally dry and unmanaged
ponds.
A Snowy Plover Habitat Enhancement Study is being conducted on Pond E14 by Karine
Tokatlian and Caitlin Robinson-Nilsen of the San Francisco Bay Bird Observatory. Oyster shells were
placed on portions of the dry pond bottom and then plover nesting success was evaluated (Tokatlian and
others, 2016). Plovers have a number of known predators, such as California gulls (Larus californicus),
common ravens (Corvus corax), and northern harriers (Circus cyaneus), red-tailed hawk (Buteo
jamaicensis), which decrease nest success (Tokatlian, 2015; Tokatlian and others, 2015). By adding
oyster shells to the pond surface, the shells provide camouflage for eggs and chicks and may help reduce
16the amount of predation. First year results indicated 98 plover nests in this pond, and shell treatment
increased breeding bird numbers, nesting density, and apparent chick fledge rates compared to previous
years. However, statistically there was no significant effect on nest survival or chick behavior in the
shell areas, perhaps because the small sample size was not sufficient to detect a change. Continued
monitoring of shell enhancement on plover nesting is needed, as is continued monitoring of plover
nesting (Pearl and others, 2016).
In addition to the focused studies noted above, USGS and the San Francisco Bay Bird
Observatory have monitored bird use of all ponds during high tide every 4–6 weeks since 2003
(Washburn and others, 2015; De La Cruz and others, 2016). Basic habitat characteristics of the ponds,
such as salinity and water depth and other features, were also recorded. This allowed for an extensive
analysis by Susan De La Cruz of the USGS of the pond characteristics favored by nine bird guilds—
dabbling ducks, diving ducks, eared grebes, fish-eaters, gulls, herons and egrets, medium shorebirds,
small shorebirds, and terns. During the period surveyed, 93 species of birds were observed, with diving
and dabbling ducks (35 percent), small and medium shorebirds (49 percent), and gulls (11 percent)
being the most abundant guilds. Peak abundances were observed in winter months. Total winter
waterbird abundance increased non-linearly over the study period, more than doubling from 98,151
birds in 2002 to 235,936 in 2014 (fig. 6). Pond depth and salinity were key variables related to bird
distributions across the ponds; this analysis can be used by managers to refine pond operations in order
to increase bird use.
Figure 6: Graph showing overall South Bay Wintering Bird Abundance. The blue solid line is the mean number of
birds for each year and the gray bands represent the 95-percent confidence limits around the mean. Graphic
provided by Susan De La Cruz, U.S. Geological Survey.
17Key Uncertainties: Can the existing number and diversity of migratory and breeding Score
shorebirds and waterfowl in the Project area be supported with reductions in salt pond
acreage?
1 Is the number of diving ducks maintained?
2 Is the number of ruddy ducks maintained?
3 Will managed ponds provide foraging and roosting habitat for migratory shorebirds?
4 Will managed ponds provide breeding habitat to support sustainable densities of snowy
plovers?
5 To what extent will the creation of large isolated pond islands maintain numbers and
reproductive success of terns, avocet, and stilts?
6 Will reconfigured and managed ponds significantly increase the prey base for, and pond
use by, waterfowl, shorebirds, and phalaropes/grebes?
7 Is the number of California least terns in the Project area maintained?
Meets/exceeds expectations Uncertain, trending positive Uncertain Uncertain, trending negative Not meeting expectations
Management Responses to Phase 1 Studies
o Managers reworked the surface of the islands at Pond SF2 in response to crack
development after chicks were lost in the first year after construction.
o Managers worked with engineers to redesign how islands were constructed at Ponds A16
and E12/E13 in order to minimize cracking.
o A pilot project to investigate surface treatments for islands was conducted at Ponds
E12/13 prior to construction of the remaining islands.
o Mounds and shallow water features for birds were added to Ponds E12/13 design.
o The “island recipe” for constructing islands to maximize use by breeding birds is being
incorporated into Phase 2 actions.
o A Pond Management Working Group, comprised of managers and researchers, meets
regularly to evaluate bird survey data and make recommendations for changes to
managed pond operation for optimization of bird use.
18Needed Phase 2 Studies for Bird Use of Changing Habitats
o Continue the high tide bird surveys on all ponds to understand bird-habitat linkages,
long-term impacts of conversion of ponds to marsh, and develop optimal or target salinity
and water levels for bird guilds and species.
o Study food availability in ponds to continue understanding the carrying capacity of the
ponds, especially for diving ducks.
o Study how to maximize islands for shorebird foraging and roosting.
o Further study of California gull predation on shorebird and tern eggs and chicks as ponds
are restored; GPS mark gulls to evaluate habitat use and use of landfills; understand if
gull population increases as a result of local reproduction or immigration; identify gull
diet to understand percentage from landfills.
o Continue social attraction studies on newly constructed islands for terns.
o Continue enhancing islands and creating islands for nesting habitat.
o Continue studying breeding bird nest abundance and nest success in the Project area to
understand long term trends.
o Conduct a population count of breeding avocets, stilts, and Forster’s terns in the entire
South Bay to determine if populations have declined, especially for avocets whose
breeding population appears to have declined.
o Continue habitat enhancement and predator management of plover nesting areas and
study their effectiveness.
o Conduct additional snowy plover studies to track brood movement and estimate fledging
rates.
o Understand snowy plover carrying capacity or density limits; understand use of foraging
on transitional mudflat habitat; understand movement and migration out of historical
areas from habitat restoration.
o Explore the use of unmanned aerial vehicles for monitoring as well as their possible
impacts to wildlife.
o Monitor bird use of newly restored areas as they change from mudflats to vegetated
marsh, including the use of panne habitat.
o Continue understanding carrying capacity of mudflat habitat and biofilm for shorebirds.
19Mercury
Mercury, a potent neurological and reproductive toxin, is an unfortunate legacy of the California
gold rush in much of the San Francisco Estuary and its watershed. Mined from the Coast Range and
then used in the Sierra Nevada mines to extract gold, extensive amounts of mercury continues to wash
out of these former mining areas and collect in the sediments of San Francisco Estuary. One of the
largest mercury mines in North America, the New Almaden Mine, released contaminated material into
the surrounding area that eventually washed down into the Guadalupe River, contaminating the
sediments. The Guadalupe River drains into Alviso Slough, in the center of the Alviso Pond Complex.
As a result, the ponds adjacent to Alviso Slough, including Pond A8, have extensive mercury deposits,
and prior studies had found high concentrations of mercury in fish and bird eggs in Pond A8. There was
concern that fully restoring Pond A8 would increase the amount of mercury that was in the bioavailable
form—methylmercury (MeHg)–the more toxic form of mercury that is readily taken up into wildlife
food webs. It is the MeHg form that bioaccumulates through food webs, not the inorganic mercury.
Complex biogeochemical processes operate to convert the inorganic mercury to MeHg, so inorganic
mercury is not a good indicator of the amount of MeHg present.
Forster’s tern chick being banded for nest success study for mercury research.
Photograph by Laura Valoppi, U.S. Geological Survey.
Key Uncertainty
Will mercury be mobilized into the food web of the South Bay and beyond at a greater rate
than prior to restoration?
Question 1. Will tidal habitat restoration and associated channel scour increase MeHg
concentrations in marsh and bay-associated sentinel species?
Question 2. Will pond management increase MeHg concentrations in ponds and pond-
associated sentinel species?
20You can also read