Passive Microwave Data Exploitation via the NRL Tropical Cyclone Webpage
←
→
Page content transcription
If your browser does not render page correctly, please read the page content below

TCORF/IHC
 March 16, 2017
 Distro A:
 Public/UNCLASS

Passive Microwave Data Exploitation via
 the NRL Tropical Cyclone Webpage
 Josh Cossuth, Rich Bankert, Kim Richardson, Mindy Surratt
 U.S. Naval Research Laboratory, Monterey, CA

 Sponsored by: NOAA Joint Hurricane Testbed

Collaborators:
 National Hurricane Center: Lixion Avila, Eric Blake, Dave Roberts, Chris Landsea
 Joint Typhoon Warning Center: Brian Strahl, Brian DeCicco
 Central Pacific Hurricane Center: Tom Birchard
Outline
• Scope of JHT project
• Interpretation of TC Satellite Imagery
 – Introducing new products and whowing a few
 historical cases
• Discussion of parallax task sunset
• Status and future of microwave imager data
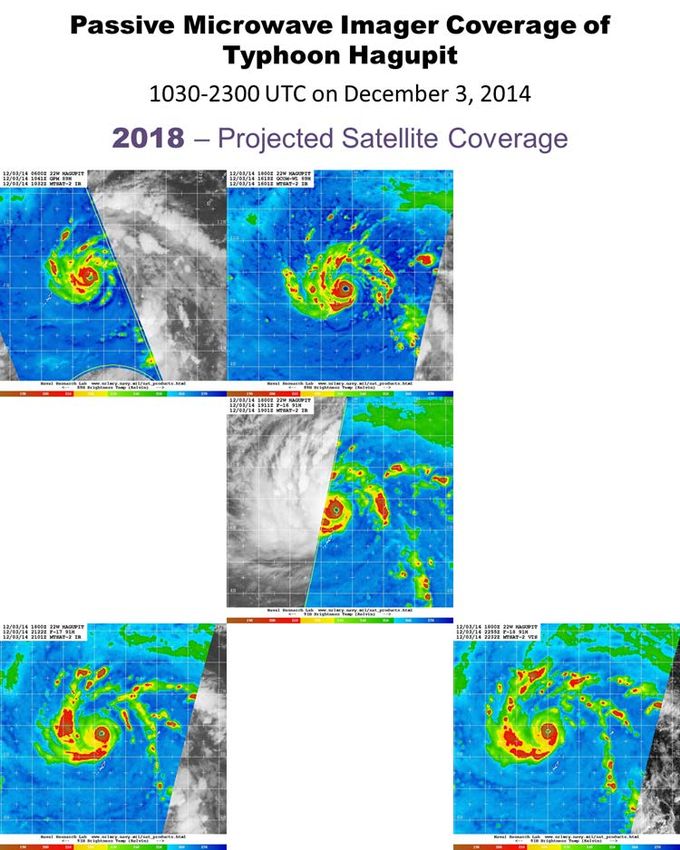
Project Overview
• The NRL TC webpage (http://www.nrlmry.navy.mil/TC.html) provided storm-centric
 operational and research satellite analyses in a near real-time setting since 1997.
 – Leader in microwave data, showing key hydrometeor structure information
 – Research platform for DoD transition to FNMOC TC
 • https://www.fnmoc.navy.mil/tcweb/cgi-bin/tc_home.cgi
• JHT goals:
 – Provide an updated standardized processing methodology for TC-microwave imager data analysis
 of near real-time and historical cases.
 – Codify operations into an open source platform that can be shared.
 • Product output as images (current TC web) and eventually data files (direct to AWIPS-2 ingest)
• Results through mid-Year 2:
 – Formalize standardized method of processing microwave imagery into python.
 – Demonstrated and ported a realtime demo mode (ad hoc python/Matlab) to GeoIPSTM.
 – Format, stage, and process historical dataset to quantify brightness temperature statistics and
 populate archive.
 – Deliver real-time tests of new products/visualizations since summer 2016 (see following slides).
Distribution of 89 GHz Brightness
 Temperatures

 • Low level cloud and
Black Line = liquid water emission
Log(Counts) • Convective Scattering
Gray Line = and atmospheric
Abs(Derivative) (in)stability
Product Comparison: Carlos (SH042017)

89 GHz H-Pol 89 GHz H-Pol 37 GHz H-Pol 37 GHz H-Pol
Current New Current New
Enhancement Enhancement Enhancement Enhancement

89 GHz 19 GHz Low Level Hydrometeor
Polarization Polarization Enhancement Type
Difference Difference RGB False Color RGB False Color
New Product New Product New Product New Product
Product Comparison: Hurricane Andrew
Product Comparison: Hurricane Wilma
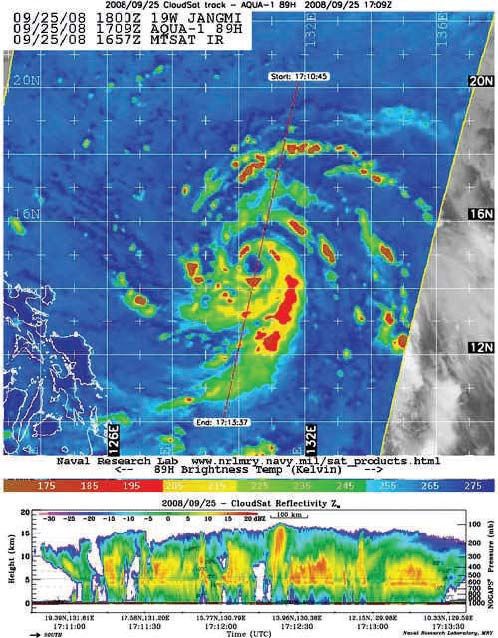
Parallax Estimate via MI/Radar
• Passive microwave imagery is frequently used to
 estimate low-level center due to IR or Vis ambiguity
• Yet, conically scanning microwave imagers have
 high earth incidence angles of ~50-55 degrees,
 leading to positional error of hydrometeor features
 – ARCHER estimates parallax based on assumed average
 height by frequency (10 km for 89 GHz, 2 km for 37 GHz)
• Original Plan:
 – Develop a statistical relationship between the brightness
 temperatures and their effective heights/parallax
 corrections using coincident microwave imagery and
 space-based vertical radar (i.e., TRMM and GPM).
• However, preliminary investigations and discussion
 with JHT POCs indicated a potential lack of
 operational utility, based on the following…
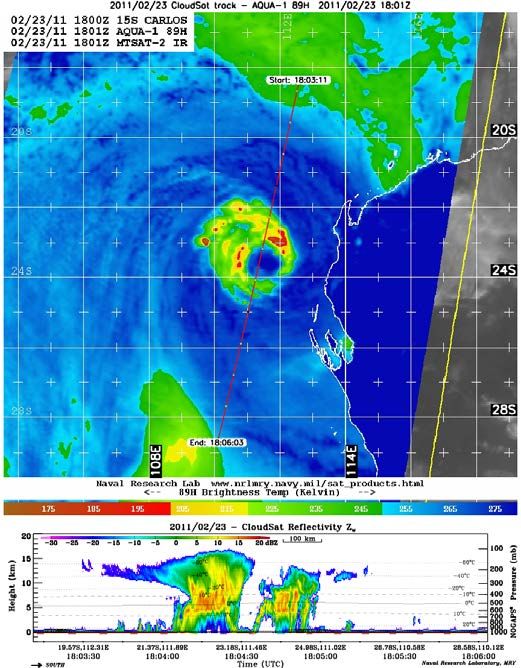
What is gained by Parallax Correction
To simplify, assume:
• Consistent satellite geometry
• Gaussian height weighting
• Ignore surface curvature
Parallax (P) calculation reduces
to trigonometric relationship α
using Earth Incidence Angle (α) H tan =
and Feature Height (H)
 P

 4 km 8 km 14 km
 Given:Sensor Earth Incidence
 Mean Mean Mean
 Angle (deg)
 • Best track TC position resolution/uncertainty
 Height of 0.1 degrees
 Height Height
 Microwave sensor resolution
 •AMSR-2 55 O(10 5.7
 km) 11.4 20.0
 Does a rigorous parallax53.1
 SSMIS correction of5.3atmospheric
 10.7 signals
 18.6
 make sense?
 Windsat 10.7 GHz 50.1 4.8 9.6 16.7
Project Status Summary
• Enhancement of currently available
 satellite data provides the ability to
 better focus on features of interest
 • Storm properties and their importance
 are better highlighted with
 visualization refinements via
 quantitative analysis
• Finishing the JHT:
 • Add SSMIS, SSM/I, WINDSAT, and
 SAPHIR to 2017 season realtime demo
 • Finalize new products and reprocess
 1987-2012 cases globally
• Beyond:
 • Work with NCEI to transition products
 and data to NOAA
Proposed NRL TC Webpage Design
 Proposed Product
 • Remaining the same:
 • Satellite/Product table
 • Ability to access and
 download real-
 time/archived image files
 • New:
 • New web layout in HTML5,
 CSS, Javascript
 • Responsive layout to work
 on all screen sizes
 • Redesigned visualizations
 (e.g., looping, thumbnails,
 comparison slider)
 • Status:
 • Contractor working on test
 version on NRL dev server
 • Currently only microwave
 imagery, but plans to add
 Vis/IR, scatterometry, and
Desktop View model overlays
 Mobile View
Status of Microwave Constellation
• The loss of several key satellites, especially
 those with high resolution and rapid refresh
 inclined orbits (TMI and MADRAS)) has
 decreased the mean revisit time of areas.
 Key sensor loss years:
 • MADRAS (2013)
 • TMI (2015)
 • F19 SSMIS (2016)

• Older research and development satellites
 are well beyond their planned lifetime and
 may be expected to terminate at anytime.
 DMSP missions are also reaching design
 limits and will decline soon after. Launch
 years for older sensors :
 • F15 SSM/I (1999)
 • WINDSAT (2003)
 • F16 SSMIS (2003)
 • F17 SSMIS (2006)
 • F18 SSMIS (2009)
Extra Slides
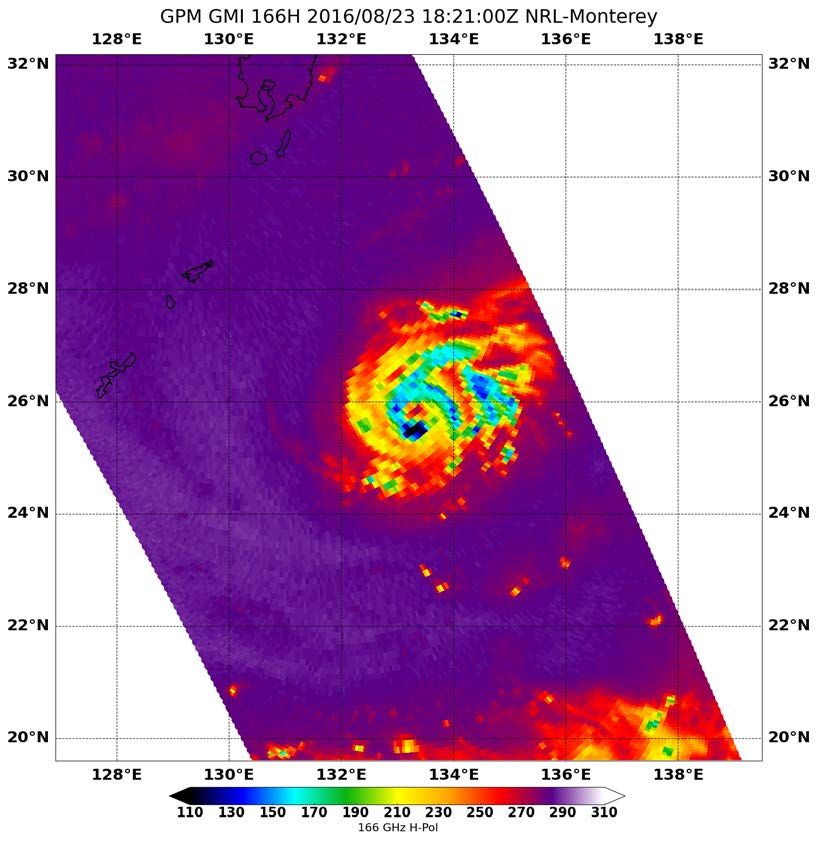
166 GHz Horizontal Polarization
 Proposed Product

• Focuses on Cloud Ice content
 • No ambiguity of signal from
 surface/low levels like 89 GHz
 • Much larger brightness
 temperature/color range better
 gauge convective intensity
• Only available on GMI
 • 150 GHz and 183 GHz are on other
 microwave imagers/sounders and
 could be similarly beneficial
 • Future missions (especially
 cubesats) will include similar
 higher frequencies
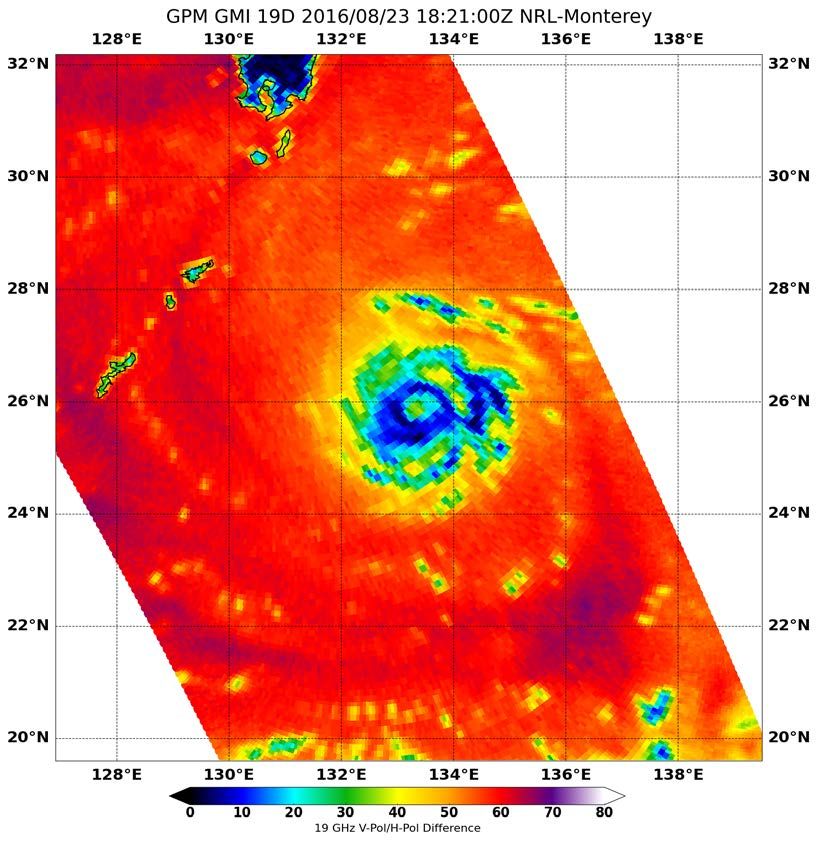
19 GHz Polarization Difference
 Proposed Product

• Focuses on precipitating liquid
 • The closer to 0, the more cloud
 liquid water that masks surface
 emission
 • No ambiguity of signal from ice as
 in current 37 GHz products
 • Able to more easily see low level
 structure (e.g., closed eyewall) to
 infer intensity change trend
• Cons:
 • Too coarse on SSM/I and SSMIS for
 structure analyses
 • Difficult to use over land
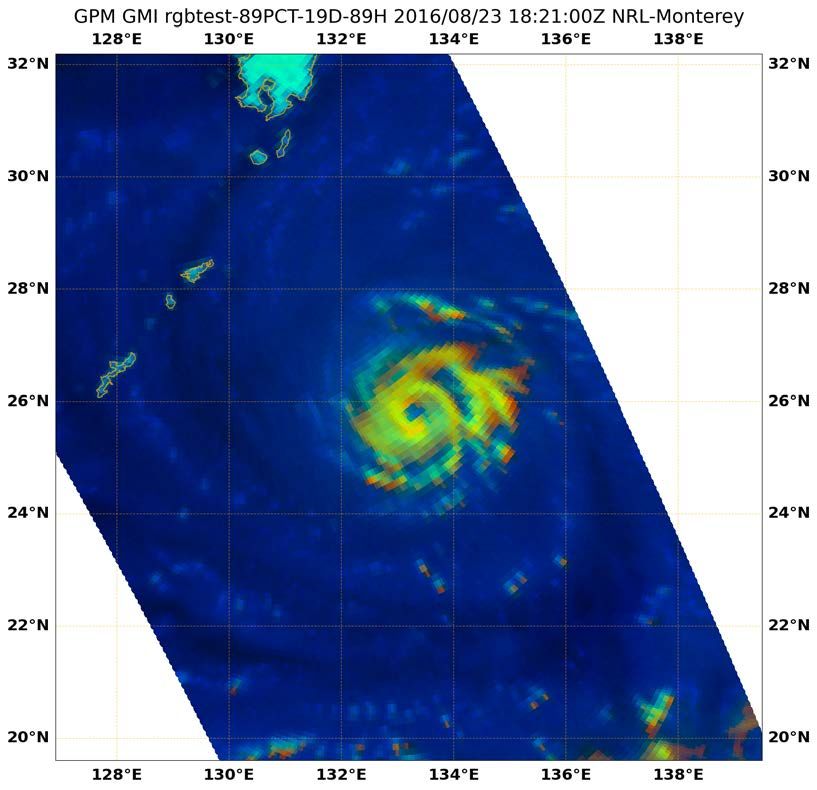
Hydrometeor Type False Color RGB
 Proposed Product

• Interpretation:
 • Red pixels are convective ice only
 • Green pixels are low level precipitating
 liquid water
 • Note: land is also bluish-green
 • Yellowish/orange pixels show
 combinations of both convective liquid
 and ice
 • Lighter blue to dark blue colors show
 shallow non-precipitating liquid
 water/moist air to drier cloud free areas
• Purpose:
 • Used to discriminate vertical convective
 structure and its symmetry.
 • In this case:
 • Western eye/eyewall is vertically stacked
 • The eastern eyewall is open at upper
 levels, but closed and elliptical at lower
 levels
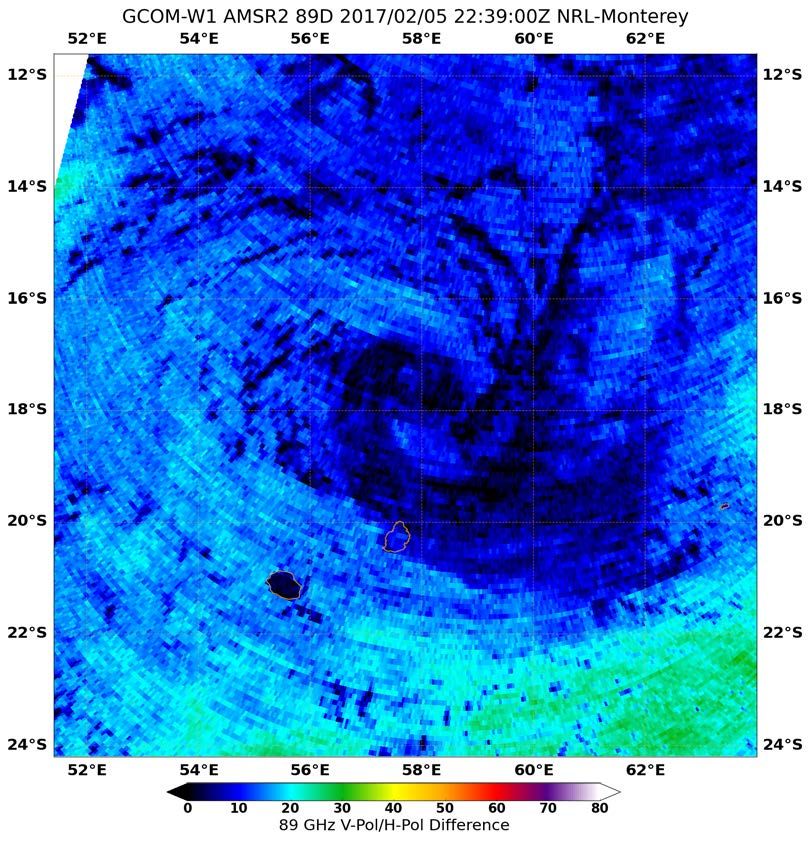
89 GHz Polarization Difference
 Proposed Product

• A higher resolution low level
 liquid water analysis.
 • The closer to 0, the more cloud
 liquid water that masks surface
 emission
 • Finer detail of structure compared
 to 19/37 GHz products.
 • Relative environmental stability
 seen at higher values
• Cons:
 • Signal saturates quickly and ice
 scattering not mitigated
 • Difficult to use over land
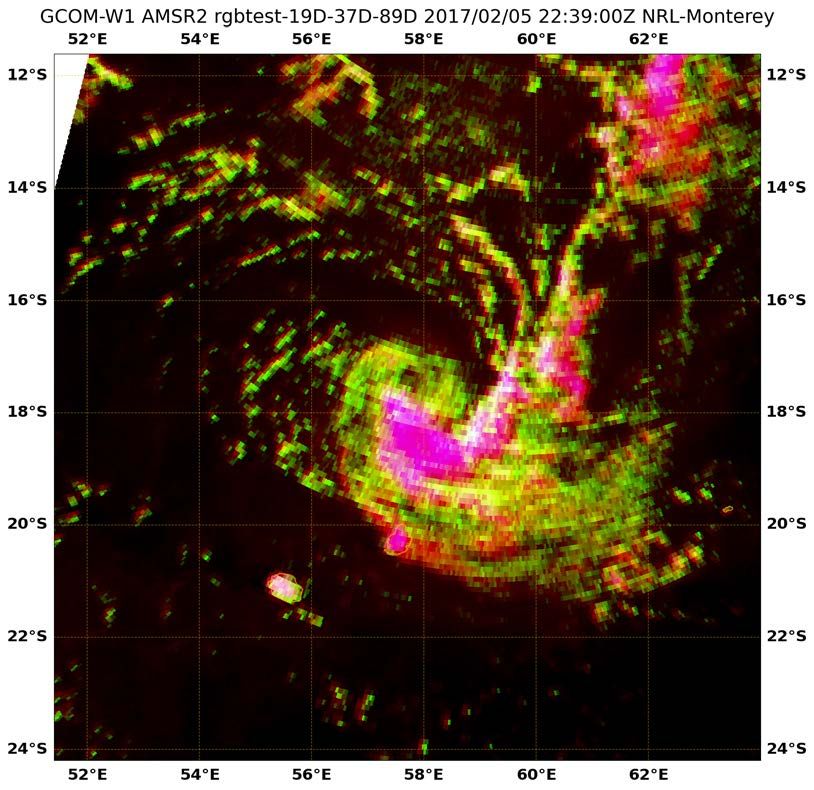
Low Level Enhancement False Color
 RGB
 Proposed Product

• Interpretation:
 • Magenta/White represents
 precipitating convective clouds
 • Yellow/Green pixels show lower
 tropospheric water emission
 • Black pixels represent hydrometeor-
 free oceanic background
• Purpose:
 • Used for weak and asymmetric
 storms to highlight low level center
 of circulation and banding/inflow
• Cons:
 • Signal to noise ratio is low since 89
 GHz emission signal is leveraged to
 maximize resolution
Distribution of 37 GHz Brightness
 Temperatures

 • Low level liquid water
Black Line = emission
Log(Counts) • Surface to lower
Gray Line = tropospheric water
Abs(Derivative) vapor, clouds and
 atmospheric (in)stability
Product Comparison: Hurricane Gilbert
Product Comparison: Hurricane Floyd
Future Microwave Additions and Alternatives
DoD/JPL Compact Ocean Wind Vector Radiometer (Nov 2017)
• Gap-filler with 3-year life design; Polarimetric wind from 18.7, 23.8, 33.9
 GHz; Dual look angle to provide better wind direction than WindSat

Others scheduled for 2022+
• DoD Weather Satellite Follow-on (WSF; 2022):
• JAXA AMSR2 Follow-on (2022+):
• EUMETSAT METOP-SG A and B (2022+):

Potential for Cubesats
• TEMPEST, TROPICS, and other sounders may be operationally useful if
 near real-time data acquisition can be arranged
• C-Ka bands are not currently in development, though NASA has identified
 these microwave imagers frequencies as viable (given a large antenna)
You can also read


