Oxygen suppression of macroscopic multicellularity - Nature
←
→
Page content transcription
If your browser does not render page correctly, please read the page content below
ARTICLE
                  https://doi.org/10.1038/s41467-021-23104-0                 OPEN

                  Oxygen suppression of macroscopic
                  multicellularity
                  G. Ozan Bozdag 1 ✉, Eric Libby                   2,3,4,   Rozenn Pineau1,5, Christopher T. Reinhard                        6,7   &
                  William C. Ratcliff 1,8 ✉
1234567890():,;

                  Atmospheric oxygen is thought to have played a vital role in the evolution of large, complex
                  multicellular organisms. Challenging the prevailing theory, we show that the transition from
                  an anaerobic to an aerobic world can strongly suppress the evolution of macroscopic mul-
                  ticellularity. Here we select for increased size in multicellular ‘snowflake’ yeast across a range
                  of metabolically-available O2 levels. While yeast under anaerobic and high-O2 conditions
                  evolved to be considerably larger, intermediate O2 constrained the evolution of large size.
                  Through sequencing and synthetic strain construction, we confirm that this is due to O2-
                  mediated divergent selection acting on organism size. We show via mathematical modeling
                  that our results stem from nearly universal evolutionary and biophysical trade-offs, and thus
                  should apply broadly. These results highlight the fact that oxygen is a double-edged sword:
                  while it provides significant metabolic advantages, selection for efficient use of this resource
                  may paradoxically suppress the evolution of macroscopic multicellular organisms.

                  1 School of Biological Sciences, Georgia Institute of Technology, Atlanta, GA, USA. 2 Integrated Science Lab, Umeå University, Umeå, Sweden. 3 Department

                  of Mathematics and Mathematical Statistics, Umeå University, Umeå, Sweden. 4 Santa Fe Institute, Santa Fe, NM, USA. 5 Interdisciplinary Graduate Program
                  in Quantitative Biosciences, Georgia Institute of Technology, Georgia, USA. 6 School of Earth and Atmospheric Sciences, Georgia Institute of Technology,
                  Atlanta, GA, USA. 7 NASA Astrobiology Institute, Alternative Earths Team, Riverside, CA, USA. 8 NASA Astrobiology Institute, Reliving the Past Team,
                  Atlanta, GA, USA. ✉email: ozan.bozdag@gmail.com; william.ratcliff@biology.gatech.edu

                  NATURE COMMUNICATIONS | (2021)12:2838 | https://doi.org/10.1038/s41467-021-23104-0 | www.nature.com/naturecommunications                               1
ARTICLE                                                                  NATURE COMMUNICATIONS | https://doi.org/10.1038/s41467-021-23104-0

W
            hile simple multicellularity first evolved in prokaryotes          examine the effect of oxygen on multicellular size using a com-
            as early as 2.6 billion years ago1,2, these lineages never        bination of experimental evolution, synthetic biology, and
            evolved to be large and complex3,4 (i.e., exhibiting              mathematical modeling, using yeast model system of undiffer-
extensive cellular differentiation with numerous cell types). This            entiated multicellularity. First, we perform an ~800 generation
is in striking contrast to eukaryotic life, which independently               selection experiment, examining the ability of snowflake yeast to
evolved an impressive array of large, complex multicellular                   evolve larger size under a range of O2 levels. While large size
forms5–7. Yet even within eukaryotes, it was not until several                readily evolves in anaerobic and high-O2 conditions (near mod-
hundred million years after the diversification of their crown                 ern levels), it is suppressed at intermediate pO2. To confirm that
groups that macroscopic multicellular linages arose and under-                the results of our evolution experiment reflect selection acting on
went a global evolutionary radiation8–11. During this prolonged               multicellular size, and are not confounded by metabolic differ-
lag (1.6–0.8 Ga), the concentration of O2 in Earth’s ocean-                   ences or parallel evolutionary changes, we genetically engineer
atmosphere system was much lower than today (perhaps below                    small and large snowflake yeast and examine their fitness under
~1% of the present atmospheric level, PAL)12,13. By the start of              varying pO2. Finally, we recapitulate our results in a simple
the Ediacaran (635 Ma), millimeter-to-centimeter scaled macro-                evolutionary model, highlighting how selection for efficient use of
scopic multicellular eukaryotes had evolved and spread across the             oxygen when it is limiting can strongly constrain the evolution of
oceans11,14–19. These organisms, which represent the first globally            increased multicellular size.
distributed forms of macroscopic multicellularity, had a thin                    Taken together, this work suggests that the oxygenation of
tissue layer and were diffusion-limited due to the absence of                 Earth’s oceans was neither necessary nor sufficient for the evo-
sophisticated cellular differentiation15,20,21, with key innovations          lution of large multicellular size. In fact, when limiting to growth,
such as circulatory systems evolving later in metazoans. The                  oxygen may strongly suppress the evolution of large size by
abrupt radiation of macroscopic multicellularity in the Ediacaran             favoring smaller organisms that can better utilize it. This result
oceans coincides with evidence for a global rise in ocean-                    has far-reaching implications for the origin of complex life,
atmosphere oxygen levels (~800–550 Ma)12,22–24. Although this                 suggesting that the transition from an anaerobic to microaerobic
geobiological observation is largely undisputed, the role of oxygen           world may have acted as a powerful constraint on the evolution of
in the evolution of macroscopic multicellularity remains a topic of           large, diffusion-limited organisms, providing new insight into the
intense debate25–29.                                                          mechanisms underlying the so-called “boring billion” years of
   The oxygen control hypothesis (OCH) is the dominant                        Earth’s evolutionary history between ~1.8–0.8 Ga49.
explanation causally linking the concentration of oxygen with
multicellular size27. The OCH posits that, in organisms that lack a
                                                                              Results
circulatory system, the ability for oxygen to diffuse into an
                                                                              Model system. We constructed our initial snowflake yeast by
organism places limits on organism size. The OCH thus predicts
                                                                              deleting the ACE2 open reading frame in the unicellular strain
that increasing atmospheric pO2 should generally increase the
                                                                              Y55. This leads to incomplete separation of mother and daughter
depth to which O2 can diffuse, monotonically increasing the
                                                                              cells, resulting in the formation of multicellular clusters. Snow-
maximum size that can be attained before diffusive O2 limitation
                                                                              flake yeast possess an emergent multicellular life cycle in which
impedes growth27. The central prediction of the OCH, that
                                                                              clusters grow until packing strain generated by cellular division
increased atmospheric pO2 can support larger multicellular
                                                                              causes cell–cell fracture, giving rise to new snowflake yeast
organisms, has largely been supported by mathematical
                                                                              clusters50,51. Mutations are efficiently segregated between groups,
models30–34, comparative work in natural environments35,36, and
                                                                              and individual clusters are primarily monoclonal52,53. Snowflake
manipulative experiments with modern animals37, most of which
                                                                              yeast populations undergo ~5 generations of growth per day,
show that low pO2 constrains body size (but see ref. 38).
                                                                              readily adapting to size-based selection by evolving to be
   The OCH, however, is not a general model for oxygen-size
                                                                              larger51,54.
relationships, and it cannot be applied to the question of how the
                                                                                 Snowflake yeast grow as approximately spherical clusters of
transition from an anaerobic to a microaerobic world would have
                                                                              densely packed cells, but little is known about the extent to which
affected organismal size. This is because the OCH assumes that
                                                                              interior cells are limited by access to oxygen—a constraint that is
organisms are obligately aerobic, a derived metabolic strategy
                                                                              necessary for their use as a model system of diffusion-limited
suited to an already well-oxygenated world. Stem-group eukar-
                                                                              multicellularity. We examined the diffusion depth of oxygen
yotes, for example, which evolved in the low-O2 oceans of the
                                                                              within snowflake yeast by genomically integrating the MitoLoc
Proterozoic39, were mixotrophic40–43, and mixotrophy remains
                                                                              construct (preSU9-GFP + preCOX4-mCherry)55 into our ances-
common today in oxygen-minimum zones44–46. Further, the
                                                                              tral snowflake yeast strain, allowing us to visualize mitochondrial
OCH has focused almost exclusively on physiological rather than
                                                                              activity throughout the cluster. The preSU9-GFP marker localizes
evolutionary timescales, examining the immediate physiological
                                                                              to the F0-ATPase subunit-9 independent of aerobic respiration,
impacts of O2 but ignoring evolutionary feedbacks that are ulti-
                                                                              whereas preCOX4-mCherry localizes to the mitochondria only
mately responsible for systematic changes in multicellular size.
                                                                              when there is an active proton gradient in the organelle. Only
Oxygen is a valuable resource, both increasing the efficiency of
                                                                              cells near the surface were capable of respiration, while the rest of
metabolism up to 16-fold47 and stochiometrically unlocking the
                                                                              the cluster interior is effectively anaerobic (Fig. 1a). Furthermore,
metabolic potential available in non-fermentable carbon48. Thus,
                                                                              while an average of 28% of cells/cluster showed aerobic activity
the evolution of multicellular size should be viewed through the
                                                                              under standard batch culture conditions, this increased to 56%
lens of evolutionary trade-offs (i.e., multicellular organisms can
                                                                              with oxygen supplementation (Fig. 1b; Mann–Whitney U = 262,
potentially gain a benefit by being large, but may suffer increased
                                                                              n1 = 29, n2 = 37, p = 0.0003, two-tailed). Despite their branched
diffusive constraints on access to O2 as a result, reducing the
                                                                              growth form, respiration in snowflake yeast is strongly diffusion
metabolic benefits of using oxygen), rather than through the
                                                                              limited.
strictly physiological lens of the OCH.
   To our knowledge, no prior work has examined the relation-
ship between oxygen availability and size over evolutionary                   Examining the impact of pO2 on size via experimental evolu-
timescales in a diffusion-limited multicellular organism, a gap               tion. Saccharomyces cerevisiae has evolved a somewhat unusual
that is partly due to the lack of suitable model systems. Here, we            form of mixotrophy: it ferments glucose, even in the presence of

2                 NATURE COMMUNICATIONS | (2021)12:2838 | https://doi.org/10.1038/s41467-021-23104-0 | www.nature.com/naturecommunications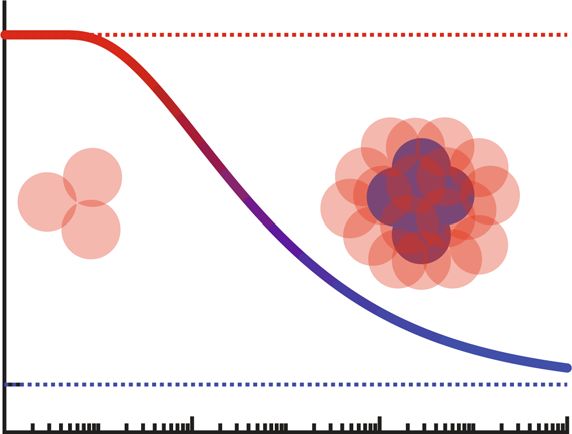
NATURE COMMUNICATIONS | https://doi.org/10.1038/s41467-021-23104-0                                                                                                 ARTICLE

                           a                                                                       b                     100

                                                                                         Percentage of respiring cells
                                                                                                                         80

                                                                                                 per cluster
                                                                                                                         60

                                                                                                                         40

                                                                                                                         20

                                                                                                                           0

                                                                               50 μm                                           Intermediate O2   Supplemental O2

Fig. 1 Interior cells are O2 limited and largely incapable of respiration. a Images of representative snowflake yeast clusters expressing the MitoLoc55
construct (left: under intermediate O2, right: under supplemental O2). Peripheral cells are actively respiring, as shown by the dual staining of preCOX4-
mCherry, which only enters mitochondria with an active proton gradient, as well as pre-SU9-GFP, which labels all mitochondria. In contrast, few internal
cells are respiring. b Supplementing our batch culture with additional oxygen doubled the fraction of respiring cells per cluster, from an average of 28% to
an average of 56% (Mann–Whitney test, U = 262, p = 0.0003, two-tailed; n = 29 and 37 for the intermediate and supplemental O2 treatments,
respectively). The whiskers are drawn down to the 10th and up to the 90th percentiles, and data outside of the whiskers are shown as individual points.
The lines in the middle of the boxes show the median values. Source data are provided as a Source Data file.

oxygen (a process known as the Crabtree effect)56. To directly                  evolution (Fig. 2d). Across all 23 populations, cellular aspect ratio
relate oxygen availability to O2-mediated growth, we grew our                   explained 92% of the variation in multicellular size (Fig. 2d; y =
yeast on a non-fermentable carbon source, glycerol, forcing it to               36.44x−11.97, p < 0.0001). The strong linear correlation suggests
respire throughout the culture cycle. We evolved snowflake yeast                 that the mechanistic underpinnings of increased multicellular size
under three different metabolically-available pO2 regimes: (1) we               (increased packing efficiency through cellular elongation) was
generated mutants incapable of respiration (known as “petite”                   similar in all experimental populations, and was unaffected by
yeast) which grow anaerobically even in the presence of atmo-                   environmental or metabolic differences.
spheric oxygen; (2) we grew strictly aerobic yeast under inter-
mediate O2 (~24% Present Atmospheric Level [PAL]) and (3)
high O2 (72% PAL). Finally, as a control for the effects of mod-                Testing O2-mediated size suppression via synthetic construc-
ifying yeast metabolism, we also evolve mixotrophic yeast under                 tion. Experimental evolution is fundamentally multi-dimen-
intermediate oxygen (~25% PAL O2). We evolved five replicate                     sional, with long-term evolutionary change being affected by
populations of each treatment (20 populations total) for 145 daily              genetic historical contingencies57. To rigorously test the
transfers, or ~812 generations (generations/day measured for all                hypothesis that selection favors large size under both anaerobic
populations at 0, 50, 100, and 145 transfers). Each day, the yeast              and highly aerobic conditions, but favors small size when O2 is
experienced 24 h of selection for faster growth followed by a                   limiting, we constructed otherwise isogenic large and small
single round of selection for larger multicellular size (4-min set-             snowflake yeast. To find a short list of candidate mutations for
tling selection54, see “Methods” section for details).                          constructing a large-sized phenotype, we sequenced the genome
   Surprisingly, greater oxygen availability did not necessarily                of a large snowflake yeast, and identified 36 de novo mutations
foster the evolution of larger size. The two treatments that                    (see Supplementary Data 1 for a list of mutations). We then
evolved to be the largest were aerobic respiration under high O2                screened seven single-gene deletions for their effect on size, and
(97% increase in mean size; p < 0.0001, F3,24 = 12.19, Dunnett’s                found that the combined deletion of GIN4 and ARP5 resulted in
test in one-way ANOVA) and anaerobic fermentation (93%                          the formation of more elongated cells, which in turn increased the
increase in mean size; Fig. 2a and Supplementary Figs. 2–5; p <                 average radius of multicellular groups by 69.7% in petite (mito-
0.0001, F3,22 = 256.7, Dunnett’s test in one-way ANOVA).                        chondria incapable of oxidative respiration) and 29.3% in grande
However, strictly aerobic yeast grown under intermediate O2                     (functional mitochondria) snowflake yeast (Fig. 3a; p < 0.0001,
did not evolve to be significantly larger, even after 145 days of                F3,10759 = 1398, Sidak’s Method in one-way ANOVA). These
daily size selection (8.9% increase, p = 0.1, F3,24 = 1.734, Dun-               mutations increase group size by modifying the biophysics of
nett’s test in one-way ANOVA), while the mixotrophic control                    snowflake yeast growth. Specifically, Δarp5 increases cellular
cultured under intermediate O2 evolved to be 37% larger than                    aspect ratio, decreasing the packing fraction within clusters and
their ancestor (p < 0.0001, F3,24 = 329.1, Dunnett’s test in one-               increasing their biophysical toughness51, and Δgin4 increases the
way ANOVA). Indeed, rather than a positive, monotonic                           size of bud scars, potentially increasing the strength of cell–cell
relationship, such as that described by the OCH, we find that                    connections.
intermediate oxygen availability strongly suppressed the                           We competed our synthetic strains under the same conditions as
evolution of larger size relative to either anaerobic or highly                 our evolution experiment. Specifically, we competed small vs. large
aerobic conditions after 145 days of evolution in a total of 20                 snowflake yeast phenotypes under three different pO2 levels and four
evolved populations (Fig. 2c; p < 0.0001, Welch’s t-test, t = 8.6,              metabolic conditions: (1) anaerobic (petite) snowflake yeast under 0%
df = 18).                                                                       PAL metabolically-available O2; strictly aerobic (grande) snowflake
   Prior work has demonstrated that snowflake yeast evolve to be                 yeast under both (2) intermediate-O2 and (3) high-O2 conditions
larger primarily by increasing their cellular aspect ratio. This                (25% PAL and 75% PAL, respectively); and (4) mixotrophic (grande)
heritable, cell-level trait underlies the emergence of greater                  snowflake yeast under intermediate-O2 (25% PAL), as a control. For
multicellular size by reducing the strain on cell–cell connections              each competition, we calculated the daily selection coefficient
caused by cellular packing51. To determine if yeast cultured under              (proportional change in the frequency of individual clusters) of large
both low and high O2 were employing similar biophysical                         vs. small snowflake yeast, rw, after 24 h of growth and one round of
mechanisms to increase size, we examined the relationship                       settling selection for two consecutive days of growth and size
between mean cellular aspect ratio and mean cluster size for our                selection. Consistent with the outcome of our experimental evolution
three ancestors and 20 evolved populations after 145 days of                    (Fig. 2), engineered large snowflake yeast were strongly favored by

NATURE COMMUNICATIONS | (2021)12:2838 | https://doi.org/10.1038/s41467-021-23104-0 | www.nature.com/naturecommunications                                                 3
ARTICLE NATURE COMMUNICATIONS | https://doi.org/10.1038/s41467-021-23104-0
a Strictly anaerobic
Strictly aerobic
Strictly aerobic (supplemental O2)
Control (mixotroph)
b 50 μm
70
Ancestor Strictly aerobic
Cluster radius ( m) 60
50
40
Strictly aerobic
30 Control (mixotroph) Strictly anaerobic (supplemental O2)
0 50 100 150
Strictly anaerobic Strictly aerobic (supplemental O2)
Days of evolution Strictly aerobic Control (mixotroph) Ancestors
c 125 d 75
65
Cluster radius ( m)
100
% increase in size
75 55
50 45
25
35
0
25
0 10 20 30 40 50 60 70 80 1.0 1.2 1.4 1.6 1.8 2.0 2.2 2.4
O2 available for metabolism (mean %PAL) Cellular aspect ratio
Fig. 2 The evolution of large size in snowflake yeast is constrained under low-oxygen conditions. a Temporal dynamics of size evolution in each
treatment. b Confocal images of representative clusters for each treatment after 145 transfers. Color indicates z-axis depth. c Low oxygen constrained the
evolution of large size, relative to anaerobic or highly aerobic conditions. Shown here are the final mean size of snowflake yeast clusters within each of the
20 populations shown in a, plotted against the average metabolically-available pO2 from each experimental microcosm. Line (c) is a spline with four knots.
d Larger multicellular size evolved through increased cellular aspect ratio in all treatments. The aspect ratio and cluster size values are from the three
ancestral genotypes (strictly aerobic, strictly anaerobic, and mixotrophic control) and 20 evolved populations. Source data are provided as a Source
Data file.
selection under anaerobic (mean rw = 0.26, p < 0.0001) and highly respire aerobically, while cells that are anoxic ferment, and then
aerobic (mean rw = 0.24, p < 0.0001) conditions, while small calculate the size that maximizes fitness as a function of envir-
snowflake yeast were favored under intermediate O2 (Fig. 3b; onmental pO2.
strictly aerobic mean rw = −0.3, p < 0.0001; mixotrophic control We calculate fitness (w) as the expected number of offspring
mean rw = −0.28, p < 0.0001; F3,26 = 265.1, Tukey’s HSD; one-way over time (t) as a function of organism size (s):
ANOVA).
Both gin4Δ and arp5Δ mutations have pleiotropic effects, wðs; tÞ ¼ ð2pðsÞÞt=τðO;sÞ ; ð1Þ
reducing unicellular growth rates in a similar manner under both
intermediate and high-O2 conditions. Unicellular gin4Δ mutants where p(s) is the probability that an organism of size s survives to
had a relative fitness of 0.898 and 0.900 under intermediate-O2 double in size, and thus reproduce, and τ(O,s) is the time an
and supplemental-O2 conditions, respectively. Similarly, unicel- organism of size s takes to double in volume given a certain pO2.
lular arp5Δ had a relative fitness of 0.937 and 0.949 under As with most models of early multicellularity, we assume that
intermediate-O2 and supplemental-O2 conditions, respectively. there is a fitness-related advantage associated with increased size
This reduction in growth rates should not affect our interpreta- and link survival to organism size with the expression
tion of the engineered multicellular-strain competition experi- pðsÞ ¼ 1 0:5eks , where k is a positive scaling parameter (with
ment: despite this growth cost, the engineered strain that forms smaller values of k, organisms need to be larger to obtain the
larger clusters still outcompeted the smaller competitor under same survival benefit of increased size, see Supplementary Fig. 6).
both anaerobic and high-O2 conditions (but not under The range of p(s) ensures a population can grow, regardless of
intermediate-O2). organism size, though larger size improves survival with
diminishing returns.
General evolutionary model of O2-size relationships. To con- To determine the time to reproduction τ(O,s), we assume that
textualize our experimental results and provide general insight cells grow exponentially such that the rate of change in organism
into the role of oxygen in the evolution of organismal size, we size is given by ds=dt ¼ λa ðsÞs, where λa ðsÞ is the average cell
developed a first-principles evolutionary model. This model is not growth rate for an organism of size s. Aerobic growth quickly
intended to directly recapitulate our experimental results above, depletes oxygen within a group of cells, resulting in an anaerobic
but instead is designed to examine how oxygen affects the evo- core58,59. For each O2 environment (0–100% PAL), we calculate
lution of multicellular size more generally. We consider a simple, the proportion of anaerobic cells within the spherical organism,
spherical, diffusion-limited multicellular organism under size pf ¼ ð1 θ=rÞ3 , where r is its radius and θ is the distance from
selection across a range of oxygen environments (0–100% PAL). the surface with enough oxygen to sustain respiration. Based on
We assume that cells within the organism with access to oxygen prior experiments, we assume that respiration yields 6.8 times as
4 NATURE COMMUNICATIONS | (2021)12:2838 | https://doi.org/10.1038/s41467-021-23104-0 | www.nature.com/naturecommunicationsNATURE COMMUNICATIONS | https://doi.org/10.1038/s41467-021-23104-0 ARTICLE
**** pARTICLE NATURE COMMUNICATIONS | https://doi.org/10.1038/s41467-021-23104-0
a respiration growth rate b
Mean cell growth rate
Relative fitness
fermentation growth rate
Organism size (s) Organism size (s)
c d
Fittest organism size (radius, μm)
Fittest organism size (radius, μm)
maximum size considered maximum size considered
Oxygen diffusion depth θ (μm) pO2 (% PAL)
Fig. 4 Trade-offs constrain the evolution of size under intermediate O2 conditions. We modeled the O2-dependent evolution of size in a simple, diffusion-
limited organism. a Larger organisms can develop an anaerobic core of cells (blue shading), decreasing their average growth rate. b Large size is adaptive when
oxygen is absent or abundant (100% PAL), but is maladaptive when oxygen is present but cannot efficiently reach internal cells via diffusion. Blue, purple, and
red lines represent oxygen diffusion distance θ of 0 (no oxygen), 1 (low oxygen), and ∞ (high oxygen), respectively. Relative to anaerobic or highly aerobic
conditions, intermediate oxygen availability strongly suppresses the evolution of large size (shown as a function of O2 diffusion depth in c, and as a function of
environmental pO2 in d). In both c and d, dashed lines denote k = 0.1, while solid lines denote k = 0.00001. With smaller values of k, organisms need to be
larger to obtain the same survival benefit of increased size. In d, black, green, and red lines model the rate of O2 consumption, φ = 46 mg s−1 l−1, while the blue
line has φ = 4.6 mg s−1 l−1. The black and blue lines model the rate of O2 diffusion, De = 1.12 × 10⁻⁵ cm2 s−1, green line De = 2.24 × 10⁻⁵ cm2 s−1, red line De =
5.56 × 10⁻⁵ cm2 s−1. In all figures, solid lines denote k = 0.00001 and dashed lines denote k = 0.1. MATLAB code to generate each of these figures can be
found in Supplementary Code 1.
diffusion, smaller organisms gain a fitness advantage because a particularly exciting avenue for discovering how environmental
larger proportion of their cells have access to oxygen, increasing constraints may have acted to shape the evolution of complex
their per-cell metabolic returns. As a result, the evolution of large multicellular life13,25–28,31,72,73.
size can be highly constrained under low-O2 conditions, but is The evolution of macroscopic multicellularity is a complex topic
unconstrained by this selection when O2 is either absent or in with no single causal agent26,74. Several macroevolutionary trends are
great abundance. becoming apparent, however. The evolution of large, physically-robust
Our results show striking parallels with historical trends. While bodies generally requires cellular specialization3,4 in addition to a
fossils of putative macroscopic multicellular organisms have been permissive oxygen environment, and this may evolve through long-
identified during low-O2 periods of Earth’s history66,67, it was not term evolutionary feedbacks26. For example, cell types capable of
until atmospheric oxygen rose to relatively high levels in the late transporting oxygen and nutrients within organisms may have evolved
Proterozoic that we see unequivocal evidence for the rapid rise through feedbacks with physical mechanisms allowing for large orga-
and ecological expansion of millimeter-to-centimeter scale nismal size, leading to dramatic increases in organismal complexity5.
multicellularity11,17–19,26,68. Stem group eukaryotes arose ~1.8 At least within eukaryotes, aerobic metabolism is important not just
billion years ago, after the Great Oxidation Event (2.4 Ga), but from an energetic perspective, but also as a mechanism for generating
did not evolve macroscopic multicellularity for over a billion molecules (e.g., reactive oxygen species) that play a key role in devel-
years. During this so-called “boring billion”49 oxygen was present opment and intercellular communication75. Developing a conceptual
in surface marine environments but at relatively low levels12,69— synthesis for the origin and subsequent evolution of complex multi-
conditions that our work suggests could have strongly con- cellular life will thus require a transdisciplinary effort, including novel
strained the evolution of large size. Recent work has shown that first-principles approaches that will allow us to understand, not simply
evolutionary transitions, both from unicellularity to characterize, historical patterns of macroevolutionary change.
multicellularity54,70,71 and from microscopic to macroscopic
multicellularity7, are not necessarily highly constrained by innate
Methods
biological limitations. Indeed, snowflake yeast evolve a 4.5-fold Snowflake yeast as a model of undifferentiated multicellularity. We used
increase in maximum cluster size over just 145 days (radius of the snowflake yeast to examine the relationship between oxygen availability and the
95th percentile ancestor = 39.8 µm, radius of the 95th percentile evolution of multicellular size50,52,54. Saccharomyces cerevisiae is a yeast that
day-145 supplemental oxygen = 180 µm), a miniscule interval typically grows as single cells. In nature, size-based selection may result from a
number of conditions, including predation, resistance to abiotic stresses, or for the
with respect to geologic time. Ongoing research into the state and benefits of cooperative metabolism70,76–78. Here, we favor larger size through daily
dynamics of early Earth surface environments, together with an selection for rapid settling through liquid media. Larger clusters settle through
inclusive consideration of evolutionary trade-offs, is thus a liquid media more rapidly than smaller clusters, allowing us to quickly select for
6 NATURE COMMUNICATIONS | (2021)12:2838 | https://doi.org/10.1038/s41467-021-23104-0 | www.nature.com/naturecommunicationsNATURE COMMUNICATIONS | https://doi.org/10.1038/s41467-021-23104-0 ARTICLE
large size across large numbers (~400,000 in the ancestral strain) of individual control. For each treatment group, we evolved five replicate populations, for a total
snowflake clusters. We stress, however, that settling selection is not meant to of 20 populations. Anaerobic and mixotrophic snowflake yeast were grown in
directly recapitulate any particular environmental selection for multicellularity, but YEPD (1% yeast extract, 2% peptone, 2% dextrose) and strictly aerobic yeast were
rather provides a powerful means for selecting directly on organism size—a step at grown in YEP-Glycerol (1% yeast extract, 2% peptone, 2.5% glycerol). We grew
the heart of any evolutionary transition to multicellularity. these populations in 10 ml liquid cultures in large diameter (25 mm) test tubes with
rapid mixing (250 rpm) at 30 °C. For the supplemental O2 treatment, we sparged
humidified air into the culture tubes (utilizing the approach developed in ref. 79)
Strain construction. All of our experiments begin with an isogenic clone of a throughout the culture cycle. To apply directional selection for large size in
diploid yeast, strain Y55, engineered to form “snowflake” clusters by deletion of snowflake yeast, we took stationary-phase populations that had grown for 24 h and
both copies of the reading frame encoding the ACE2 transcription factor52 (ace2Δ:: transferred 1.5 ml (approximately 400,000 clusters) of each culture into 2 ml cen-
KANMX/ace2Δ::KANMX, or ace2Δ, all primer sequences are listed in Supple- trifuge tubes and let them settle on bench top for 4 min. Next, we discarded top
mentary Data 2). This basic ace2Δ snowflake yeast strain is naturally mixotrophic, 1450 µl of these samples and transferred the bottom 50 µl into 10 ml of fresh media
capable of both fermentation and aerobic respiration. From this basic snowflake for the next round of growth. In total, we applied 145 consecutive rounds of growth
yeast, we generated metabolically anaerobic yeast by selecting a randomly gener- and settling selection, or ~812 snowflake yeast generations. We measured the
ated petite mutant (i.e., carrying deletions on its mitochondrial DNA that render it dilution factor used to calculate80 the approximate number of generations snow-
nonfunctional). This anaerobic yeast phenotype strictly ferments its carbon and flake yeast undergoes with a Sysmex Cyflow Cube 6 flow cytometer, measuring the
cannot consume O2 for its energy metabolism. We confirmed the fact that this daily fold change in cluster number for all 20 populations at after 0, 50, 100, and
strain cannot respire by showing it was incapable of growth on glycerol, a non- 145 days of evolution. This allows us to account for changes in the daily dilution
fermentable carbon source. We also confirmed that it does not consume O2 during factor (and thus number of generations per day), that occurred over our experi-
growth with direct O2 measurements using O2 optodes. For the third and final ment. We measured average O2 in each treatment group for all populations by
strain, which is strictly aerobic, we simply grew snowflake yeast in media where using a fiber-optic O2 optode that provides real-time O2 monitoring (FireStingO2,
their primary carbon source (glucose) was replaced with equal molar concentration PyroScience, GmbH, Germany) (raw data for average pO2 measured for each
of glycerol, which cannot be fermented and can only be metabolized via aerobic population can be found in the Source Data file). Finally, we also stored weekly
respiration. frozen glycerol stocks of each population at −80 °C.
To generate a large snowflake yeast genotype for the competition assays (relative
fitness analysis, Fig. 3), we deleted two genes, GIN4 and ARP5, in the ace2Δ
background. These two genes were selected from a list of 36 de novo mutations from a Fitness assays on genetically-engineered small and large clusters. To examine
large snowflake yeast isolate that evolved under selection for larger size (Supplementary the relative fitness of genetically engineered “large” clusters vs. “small” clusters, we
Data 1 for a complete list of mutations). Among those 36 mutations, we screened the recapitulated the same treatments that were used in our evolution experiment. Those
deletions of seven genes (i.e., ARP5, GIN4, MEP2, RPA49, ENT4, MCM6, and MLP2) conditions are as follows: (1) competition of two anaerobic (i.e., petite) phenotypes (0%
for their potentially positive effect on cluster size in our basic strain (ace2Δ). The PAL metabolically available O2), (2) competition of two mixotrophic phenotypes (~25%
deletions of ARP5 and GIN4 increased the size of the snowflake yeast clusters visibly. PAL O2), (3) competition of two strictly aerobic phenotypes (~25% PAL O2), and (4)
We brought these mutations together under the same genetic background to obtain competition of two strictly aerobic phenotypes with supplemental oxygen (~75–80%
even larger clusters. To do this, in diploid single strain isolates of our basic strain PAL O2). To start the competition assays, we first grew four strains in monocultures
(ace2Δ), we generated two strains, one of which is heterozygous arp5Δ::HYGNT1/ARP5, overnight. These strains were: (1) “small petite” (ura3::dTomato/URA3+ace2Δ), (2)
while the other was gin4Δ::NATNT2/GIN4. Next, we induced sporulation and meiosis “large petite” (ace2Δ+arp5Δ+gin4Δ), (3) “small grande” (ura3::dTomato/URA3
by incubating both transformants in 5 ml KAc (2% potassium acetate, 0.5 g dextrose). +ace2Δ), (4) “large grande” (ace2Δ+arp5Δ+gin4Δ). From these monocultures, we
To collect haploid transformants, we digested tetrads in 15 µl (seven units 100 µl−1) prepared mixtures of small and large phenotypes, separately for petite and grande
zymolyase (Zymo Research EU, Freiburg, Germany). We dissected tetrads on YEPD snowflake yeast. We measured the starting proportions of small vs. large yeast via
plates (1% yeast extract, 2% peptone, 2% dextrose, and 1.5% agar) by using a tetrad- fluorescent microscopy. Next, we inoculated 100 µl of each mixture into 10 ml of
dissection microscope platform (The SporePlay, Singer Instruments, Watchet, UK). By appropriate fresh media for the first day of co-culturing. In total, we applied three days
replica plating four-spore colonies onto either Hygromycin-B (Enzo Life Sciences) or of growth and two rounds of settling selection. To minimize the potential for evolution
Nourseothricin Sulfate (Gold Biotechnology Inc., U.S.)-containing plates, we obtained to occur within these fitness assays, we increased the strength of settling selection by
two viable and two inviable spores for each genotype. Through autodiploidization of decreasing the duration of settling selection from 4 to 3 min. We measured the final
germinated viable colonies, we obtained two homozygous deletion strains for each locus proportions of each phenotype via fluorescent microscopy and then calculated the
(arp5Δ or gin4Δ). To bring these two mutations (in addition to ace2Δ) together under average daily change in frequency of large vs. small yeast daily in each competition.
the same genetic background, we separately induced sporulation, digested spore walls, When calculating the frequency of each genotype, we counted every snowflake yeast
and by mixing them in YEPD, allowed them to fertilize by outcrossing. By plating cluster as one individual. Because group size distributions were stable (see “Measuring
mated isolates onto media containing both drugs, we obtained our large snowflake yeast multicellular size” below), changes in the numbers of groups should also closely reflect
genotype with all three mutations (ace2Δ+arp5Δ+gin4Δ). From this triple mutant changes in the number of cells and alleles. We measured relative fitness by calculating
(ace2Δ+arp5Δ+gin4Δ) strain, which is referred to as “grande” due to its intact the average change in frequency, rather than the more common method of calculating
mitochondrial respiratory phenotype, we also selected three biological replicates of the ratio of Malthusian growth parameters, because our analysis pipeline used fluor-
randomly produced a large “petite” mutant phenotype, which is incapable of escent microscopy to differentiate strains, allowing us to easily calculate relative fre-
respiration. As for the small genotype used in the competition, we simply used our basic quencies of each strain, but not their overall abundance (raw data in the Source
ace2Δ-only strain. Data file).
To be able to measure the relative proportion of small vs large isolates in our
relative fitness assays, we tagged our small strains (of both petite and grande) with a
red fluorescence protein. To do that, we amplified the pFA6a-prTEF2-dTomato- Measuring multicellular size. We measured the size of snowflake yeast within all
terminator_ADH1-NATMX4 construct from a pFA6a-tdTomato plasmid and 20 populations after 50, 100, and 145 days of evolution. Prior to measuring their
inserted it into the URA3 locus. We confirmed red fluorescent activity of size, we did an experiment to determine the stability of the size distribution. We
Nourseothricin Sulfate resistant transformants of petite and grande snowflake yeast generated a quantile–quantile plot, regressing cluster size at each percentile from
via fluorescent microscopy, in comparison to lack of fluorescent signal in non- clusters grown for 12 h against the comparable percentiles from 6 h of growth. This
transformed parental strains. relationship was linear with a slope near 1, y = 0.95x + 0.33, r2 = 0.9992.
We generated the mitoloc strains that are used to test O2 diffusion limitation in Therefore, we decided to measure the size during this period in which the size
snowflake yeast by amplifying the NATMX6-preSU9-yeGFP-preCOX4-mCherry distribution was stable, after 10–12 h of daily growth. To measure size, we
construct from the pMitoLoc plasmid (Addgene #58980) using the primer set that inoculated three replicates of each population in liquid media for overnight growth
is listed in Supplementary Data 2. We transformed PCR products into the genome at 30 °C. We transferred 100 µl of each culture into tubes with 10 ml of fresh media
at the LEU2 locus of grande snowflake yeast. We recovered nourseothricin sulfate and grew them for 10–12 h by shaking them at 250 rpm. To measure the multi-
resistant transformants from the plates, and confirmed the expression of the cellular size distributions of each sample, we used the Multisizer-4e Coulter particle
preSU9-yeGFP-preCOX4-mCherry construct by imaging green and red fluorescence sizing and counting device (Multisizer 4 Software, Beckman Coulter, Inc.), which
activity at the mitochondria using a Nikon Eclipse Ti inverted microscope. Images allows us to measure particles that are between 5.6 and 224 µm (aperture diameter
of these strains were captured after growing them in YEP-Glycerol (1% yeast = 280 µm). For each sample, we collected size data from 2000 to 4000 snowflake
extract, 2% peptone, and 2.5% glycerol) after 7 h of growth in fresh media on the yeast clusters (Source Data file). Between each sample run, we ran water and
2nd and 5th day of transfers under intermediate O2 or supplemental O2 conditions. measured the noise produced in cell-free solution. This noise was relatively low
(ARTICLE NATURE COMMUNICATIONS | https://doi.org/10.1038/s41467-021-23104-0
and triple (ace2Δ+arp5Δ+gin4Δ) mutant snowflake (petite and grande) yeast as References
described for above in the Multisizer experiment. We pipetted each of the four 1. Amard, B. & Bertrand-Sarfati, J. Microfossils in 2000 Ma old cherty
strains onto well microscope slides with three replicates, and then captured 25 stromatolites of the Franceville Group, Gabon. Precambrian Res. 81, 197–221
congruent fields of view using a Nikon Eclipse Ti inverted microscope at 100-fold (1997).
magnification. We used ImageJ-Fiji to detect and measure cluster size (Version 2. Schirrmeister, B. E., Antonelli, A. & Bagheri, H. C. The origin of
2.1.0). In total, we measured the size of 10,763 snowflake yeast clusters (Source multicellularity in cyanobacteria. BMC Evolut. Biol. 11, 45 (2011).
Data file). 3. Bell, G. & Mooers, A. O. Size and complexity among multicellular organisms.
We used microscopy to measure the maximum (not just average) change in size Biol. J. Linn. Soc. 60, 345–363 (1997).
between our ancestor and high-O2 evolution lines, as rare but very large groups 4. Bonner, J. T. Perspective: the size‐complexity rule. Evolution 58, 1883–1890
tend to be poorly resolved on the Coulter Counter. For this, we measured the two- (2004).
dimensional cross-sectional area of each cluster. We grew batch cultures of 5. Knoll, A. H. The multiple origins of complex multicellularity. Annu. Rev.
ancestral and evolved populations in 10 ml YEPG for 12 h, pipetted cultures onto Earth Planet. Sci. 39, 217–239 (2011).
well-slides (1 mm in depth), and took 25 stitched images at 100-fold magnification 6. Brunet, T. & King, N. The origin of animal multicellularity and cell
using a Nikon Eclipse Ti inverted microscope. In total, we measured 669 clusters differentiation. Dev. Cell 43, 124–140 (2017).
for the ancestral (strictly aerobic) population and 1519 clusters for the five evolved 7. Nagy, L. G., Kovács, G. M. & Krizsán, K. Complex multicellularity in fungi:
(supplemental O2) populations (Source Data file). Finally, we calculated the mean
evolutionary convergence, single origin, or both? Biol. Rev. 93, 1778–1794
size of the 95th percentile for the ancestral and evolved lines, using this as our
(2018).
estimate of the maximum size strain is capable of obtaining.
8. Payne, J. L. et al. Two-phase increase in the maximum size of life over 3.5
billion years reflects biological innovation and environmental opportunity.
Measuring cellular aspect ratio. We inoculated 23 yeast populations (3 ancestors Proc. Natl Acad. Sci. 106, 24–27 (2009).
and 20 evolved populations after 145 transfers) for overnight growth at 30 °C. We 9. Knoll, A. H. Paleobiological perspectives on early eukaryotic evolution. Cold
then transferred 100 µl of each culture into tubes with 10 mL of fresh media, and grew Spring Harb. Perspect. Biol. 6, a016121 (2014).
them for 12 h by shaking them at 250 rpm in a 30 °C incubator. After washing 500 µl 10. Adam, Z. R., Skidmore, M. L., Mogk, D. W. & Butterfield, N. J. A Laurentian
of each culture and resuspending in 500 µl calcofluor-white (5 µl of 10 µg ml−1 stock record of the earliest fossil eukaryotes. Geology 45, 387–390 (2017).
solution), we fluorescently labeled cell walls by incubating them in the dark for 30 11. Heim, N. A. et al. Hierarchical complexity and the size limits of life. Proc. R.
min. We washed and imaged the samples using a Nikon Eclipse Ti microscope. We Soc. B 284, 20171039 (2017).
measured the aspect ratio of individual cells within snowflake yeast clusters on 12. Lyons, T. W., Reinhard, C. T. & Planavsky, N. J. The rise of oxygen in Earth’s
ImageJ-Fiji81. In total, we collected aspect ratio data for 9553 cells (a mean of 434 cells early ocean and atmosphere. Nature 506, 307–315 (2014).
per population). 13. Canfield, D. E. Oxygen: A Four Billion Year History. (Princeton University
Press, 2014).
DNA extraction, genome sequencing, and identification of de novo mutations 14. Knoll, A., Walter, M., Narbonne, G. & Christie-Blick, N. The Ediacaran
in a large-sized snowflake yeast isolate. In order to identify a list of candidate period: a new addition to the geologic time scale. Lethaia 39, 13–30 (2006).
mutations for the purposes of genetically engineering a large cluster for use in our 15. Droser, M. L. & Gehling, J. G. The advent of animals: the view from the
fitness assays, we sequenced the whole genome of a large-sized snowflake yeast Ediacaran. Proc. Natl Acad. Sci. 112, 4865–4870 (2015).
isolate. We extracted genomic DNA from this evolved isolate and its ancestor, 16. Tarhan, L. G., Droser, M. L., Cole, D. B. & Gehling, J. G. Ecological expansion
using a commercially available kit (Amresco, Inc. VWR, USA). We prepared the and extinction in the late Ediacaran: weighing the evidence for environmental
genomic DNA library using NEBNext Ultra DNA Library Prep Kit for Illumina and biotic drivers. Integr. Comp. Biol. 58, 688–702 (2018).
(New England Biolabs, Inc). We sequenced the genomes of the ancestral and 17. McMenamin, M. Ediacaran biota from Sonora, Mexico. Proc. Natl Acad. Sci.
evolved strain using the HiSeq 2500 platform (Illumina, Inc). To identify muta- 93, 4990–4993 (1996).
tions, we first filtered out low quality reads using Trimmomatic (v0.39)82. We 18. Yuan, X., Chen, Z., Xiao, S., Zhou, C. & Hua, H. An early Ediacaran
aligned FASTQ files to the yeast reference genome using BWA-MEM83. We called assemblage of macroscopic and morphologically differentiated eukaryotes.
SNPs using GATK4 HaplotypeCaller (v4.0.3.0)84, filtered low quality variants calls Nature 470, 390–393 (2011).
VCFTOOLS85. By making a pairwise comparison between the VCF files of the 19. Xiao, S. & Laflamme, M. On the eve of animal radiation: phylogeny, ecology
evolved and the ancestral strain (bcftools-isec, v1.10)86, we extracted de novo and evolution of the Ediacara biota. Trends Ecol. Evol. 24, 31–40 (2009).
variants. This final VCF file was annotated by using SnpEff (v4.3T)87. The list of all 20. Gooden, B. in Journal and Proceedings of the Royal Society of New South Wales
mutations identified in the evolved, large snowflake yeast isolate can be found in vol. 107 (Royal Society of New South Wales).
Supplementary Data 1.
21. Laflamme, M., Xiao, S. & Kowalewski, M. Osmotrophy in modular Ediacara
organisms. Proc. Natl Acad. Sci. 106, 14438–14443 (2009).
Statistical analysis. Linear regression was performed using the “scipy-stats” 22. Fike, D., Grotzinger, J., Pratt, L. & Summons, R. Oxidation of the Ediacaran
package (1.6.0) in Python88. One-way ANOVA and following multiple comparison ocean. Nature 444, 744–747 (2006).
tests were performed using Prism GraphPad version 8.4.2 for Mac OS. 23. Sahoo, S. K. et al. Ocean oxygenation in the wake of the Marinoan glaciation.
Nature 489, 546–549 (2012).
Mathematical modeling. We implemented the mathematical model described in 24. Reinhard, C. T., Planavsky, N. J., Olson, S. L., Lyons, T. W. & Erwin, D. H.
the text in MATLAB. To generate the plots in Fig. 4, we iterated over values of θ Earth’s oxygen cycle and the evolution of animal life. Proc. Natl Acad. Sci. 113,
from 1 to 100, computing the fitness of organisms with volume s ranging from 1 to 8933–8938 (2016).
100,000. To compute the fitness for a given value of θ and s, we solved the equation 25. Wood, R., Donoghue, P. C. J., Lenton, T. M., Liu, A. G. & Poulton, S .W. The
ds=dt ¼ λa ðsÞs to determine the doubling time τ(O,s), which in turn allowed us to origin and rise of complex life: progress requires interdisciplinary integration
directly evaluate the fitness of organisms of each size under different oxygen and hypothesis testing. Interface Focus. 10: 20200024 (2020).
conditions using Eq. 1. All four plots in Fig. 4 can be recapitulated via the 26. Erwin, D. H. & Valentine, J. W. The Cambrian Explosion: the Construction of
MATLAB script appended as Supplementary Code 1. Animal Biodiversity. (Roberts, 2012).
27. Mills, D. B. & Canfield, D. E. Oxygen and animal evolution: Did a rise of
atmospheric oxygen “trigger” the origin of animals? BioEssays 36, 1145–1155
Reporting summary. Further information on research design is available in the Nature
(2014).
Research Reporting Summary linked to this article.
28. Butterfield, N. Oxygen, animals and oceanic ventilation: an alternative view.
Geobiology 7, 1–7 (2009).
Data availability 29. Cole, D. B. et al. On the co‐evolution of surface oxygen levels and animals.
All strains and microscopy images are available upon request. Whole genome sequencing Geobiology 18, 260–281 (2020).
reads of the large-sized snowflake yeast isolate (i.e., with mutations on ARP5 and GIN4) 30. Raff, R. A. & Raff, E. C. Respiratory mechanisms and the metazoan fossil
have been deposited at the Sequence Read Archive (SRA): PRJNA719855. Source data are record. Nature 228, 1003–1005 (1970).
provided with this paper. 31. Catling, D. C., Glein, C. R., Zahnle, K. J. & McKay, C. P. Why O2 is required
by complex life on habitable planets and the concept of “Planetary
Oxygenation Time”. Astrobiology 5, 415–438 (2005).
Code availability 32. Runnegar, B. Oxygen requirements, biology and phylogenetic significance of
Matlab code used to generate Fig. 4a–d is included in Supplementary Code 1.
the late Precambrian worm Dickinsonia, and the evolution of the burrowing
habit. Alcheringa 6, 223–239 (1982).
Received: 9 October 2020; Accepted: 14 April 2021; 33. Runnegar, B. Precambrian oxygen levels estimated from the biochemistry and
physiology of early eukaryotes. Glob. Planet. Change 5, 97–111 (1991).
8 NATURE COMMUNICATIONS | (2021)12:2838 | https://doi.org/10.1038/s41467-021-23104-0 | www.nature.com/naturecommunicationsNATURE COMMUNICATIONS | https://doi.org/10.1038/s41467-021-23104-0 ARTICLE
34. Payne, J. L. et al. The evolutionary consequences of oxygenic photosynthesis: a 67. Li, G. et al. An assemblage of macroscopic and diversified carbonaceous
body size perspective. Photosynth. Res. 107, 37–57 (2011). compression fossils from the Tonian Shiwangzhuang Formation in western
35. Chapelle, G. & Peck, L. S. Polar gigantism dictated by oxygen availability. Shandong, North China. Precambrian Res. 346, 105801 (2020).
Nature 399, 114–115 (1999). 68. Boag, T. H., Darroch, S. A. & Laflamme, M. Ediacaran distributions in space
36. Peck, L. & Chapelle, G. Reduced oxygen at high altitude limits maximum size. and time: testing assemblage concepts of earliest macroscopic body fossils.
Proc. R. Soc. Lond. Ser. B 270, S166–S167 (2003). Paleobiology 42, 574–594 (2016).
37. Klok, C. J. & Harrison, J. F. Atmospheric hypoxia limits selection for large 69. Reinhard, C. T. & Planavsky, N. J. Biogeochemical controls on the redox
body size in insects. PLoS ONE 4, e3876 (2009). evolution of Earth’s oceans and atmosphere. Elements 16, 191–196 (2020).
38. Mills, D. B. et al. Oxygen requirements of the earliest animals. Proc. Natl Acad. 70. Boraas, M. E., Seale, D. B. & Boxhorn, J. E. Phagotrophy by a flagellate selects
Sci. 111, 4168–4172 (2014). for colonial prey: a possible origin of multicellularity. Evolut. Ecol. 12, 153–164
39. Zimorski, V., Mentel, M., Tielens, A. G. & Martin, W. F. Energy metabolism in (1998).
anaerobic eukaryotes and Earth’s late oxygenation. Free Radic. Biol. Med. 140, 71. Herron, M. D. et al. De novo origins of multicellularity in response to
279–294 (2019). predation. Sci. Rep. 9, 1–9 (2019).
40. Müller, M. et al. Biochemistry and evolution of anaerobic energy metabolism 72. Planavsky, N. J. et al. Low Mid-Proterozoic atmospheric oxygen levels and the
in eukaryotes. Microbiol. Mol. Biol. Rev. 76, 444–495 (2012). delayed rise of animals. Science 346, 635–638 (2014).
41. Fritz-Laylin, L. K. et al. The genome of Naegleria gruberi illuminates early 73. Tang, M., Chu, X., Hao, J. & Shen, B. Orogenic quiescence in Earth’s middle
eukaryotic versatility. Cell 140, 631–642 (2010). age. Science 371, 728–731 (2021).
42. Hannaert, V., Bringaud, F., Opperdoes, F. R. & Michels, P. A. Evolution of 74. Cordani, U. G., Fairchild, T. R., Ganade, C. E., Babinski, M. & Leme, J. D. M.
energy metabolism and its compartmentation in Kinetoplastida. Kinetoplastid Dawn of metazoans: to what extent was this influenced by the onset of
Biol. Dis. 2, 1–30 (2003). “modern-type plate tectonics”? Braz. J. Geol. 50, e20190095 (2020).
43. Xie, R. et al. Expanded Asgard archaea shed new light on the origin of 75. Blackstone, N. W. Redox control and the evolution of multicellularity.
eukaryotes and support a 2-domain tree of life. Preprint at bioRxiv (2021). Bioessays 22, 947–953 (2000).
44. Ginger, M. L., Fritz-Laylin, L. K., Fulton, C., Cande, W. Z. & Dawson, S. C. 76. Fisher, R., Bell, T. & West, S. Multicellular group formation in response to
Intermediary metabolism in protists: a sequence-based view of facultative predators in the alga Chlorella vulgaris. J. Evolut. Biol. 29, 551–559 (2016).
anaerobic metabolism in evolutionarily diverse eukaryotes. Protist 161, 77. Lyons, N. A. & Kolter, R. On the evolution of bacterial multicellularity. Curr.
642–671 (2010). Opin. Microbiol. 24, 21–28 (2015).
45. Tielens, A. G., Rotte, C., van Hellemond, J. J. & Martin, W. Mitochondria as 78. Koschwanez, J. H., Foster, K. R. & Murray, A. W. Sucrose utilization in
we don’t know them. Trends Biochem. Sci. 27, 564–572 (2002). budding yeast as a model for the origin of undifferentiated multicellularity.
46. Martin, W. Unmiraculous facultative anaerobes. Bioessays 39, 1700041 (2017). PLoS Biol. 9, e1001122 (2011).
47. Hinkle, P. C., Kumar, M. A., Resetar, A. & Harris, D. L. Mechanistic 79. Miller, A. W., Befort, C., Kerr, E. O. & Dunham, M. J. Design and use of
stoichiometry of mitochondrial oxidative phosphorylation. Biochemistry 30, multiplexed chemostat arrays. JoVE 72, e50262 (2013).
3576–3582 (1991). 80. Kassen, R. Experimental Evolution and the Nature of Biodiversity. (Roberts,
48. Raymond, J. & Segrè, D. The effect of oxygen on biochemical networks and 2014).
the evolution of complex life. Science 311, 1764–1767 (2006). 81. Schindelin, J. et al. Fiji: an open-source platform for biological-image analysis.
49. Holland, H. D. The oxygenation of the atmosphere and oceans. Philos. Trans. Nat. Methods 9, 676–682 (2012).
R. Soc. B 361, 903–915 (2006). 82. Bolger, A. M., Lohse, M. & Usadel, B. Trimmomatic: a flexible trimmer for
50. Ratcliff, W. C. & Travisano, M. Experimental evolution of multicellular Illumina sequence data. Bioinformatics 30, 2114–2120 (2014).
complexity in Saccharomyces cerevisiae. BioScience 64, 383–393 (2014). 83. Li, H. Aligning sequence reads, clone sequences and assembly contigs with
51. Jacobeen, S. et al. Cellular packing, mechanical stress and the evolution of BWA-MEM. https://arxiv.org/1303.3997 (2013).
multicellularity. Nat. Phys. 14, 286–290 (2018). 84. Van der Auwera, G. A. et al. From FastQ data to high‐confidence variant calls:
52. Ratcliff, W. C., Fankhauser, J. D., Rogers, D. W., Greig, D. & Travisano, M. the genome analysis toolkit best practices pipeline. Curr. Protoc. Bioinform.
Origins of multicellular evolvability in snowflake yeast. Nat. Commun. 6, 1–9 43, 11.10. 11–11.10. 33 (2013).
(2015). 85. Danecek, P. et al. The variant call format and VCFtools. Bioinformatics 27,
53. Pentz, J. T. et al. Ecological advantages and evolutionary limitations of 2156–2158 (2011).
aggregative multicellular development. Curr. Biol. 30, 4155–4164 (2020). 86. Li, H. et al. The sequence alignment/map format and SAMtools.
54. Ratcliff, W. C., Denison, R. F., Borrello, M. & Travisano, M. Experimental Bioinformatics 25, 2078–2079 (2009).
evolution of multicellularity. Proc. Natl Acad. Sci. 109, 1595–1600 87. Cingolani, P. et al. A program for annotating and predicting the effects of
(2012). single nucleotide polymorphisms, SnpEff: SNPs in the genome of Drosophila
55. Vowinckel, J., Hartl, J., Butler, R. & Ralser, M. MitoLoc: a method for the melanogaster strain w1118; iso-2; iso-3. Fly 6, 80–92 (2012).
simultaneous quantification of mitochondrial network morphology and 88. Virtanen, P. et al. SciPy 1.0: fundamental algorithms for scientific computing
membrane potential in single cells. Mitochondrion 24, 77–86 (2015). in Python. Nat. Methods 17, 261–272 (2020).
56. Pfeiffer, T. & Morley, A. An evolutionary perspective on the Crabtree effect. 89. Travisano, M. & Lenski, R. E. Long-term experimental evolution in
Front. Mol. Biosci. 1, 17 (2014). Escherichia coli. IV. Targets of selection and the specificity of adaptation.
57. Blount, Z. D., Lenski, R. E. & Losos, J. B. Contingency and determinism in Genetics 143, 15–26 (1996).
evolution: replaying life’s tape. Science 362, eaam5979 (2018).
58. Grimes, D. R., Kelly, C., Bloch, K. & Partridge, M. A method for estimating the
oxygen consumption rate in multicellular tumour spheroids. J. R. Soc. Acknowledgements
Interface 11, 20131124 (2014). We are grateful to Troy von Beck who helped us setting up the air-sparging system for
59. Wessel, A. K. et al. Oxygen limitation within a bacterial aggregate. MBio 5, our supplemental-oxygen treatment experiment. We thank Thomas C. Day for helping
e00992–14. (2014). us with the confocal microscopy. Andrew P. Shaw trained us to use the Multisizer-4e
60. Brown, S. W., Sugden, D. A. & Oliver, S. G. Ethanol production and tolerance instrument located at the Petit Institute core facilities at Georgia-Tech. We would like to
in grande and petite yeasts. J. Chem. Technol. Biotechnol. 34, 116–120 (1984). thank Anthony Burnetti whose own work inspired us to genetically engineer the large
61. Postma, E., Verduyn, C., Scheffers, W. A. & Van Dijken, J. P. Enzymic analysis snowflake yeast phenotype. The narrative structure of the manuscript was improved by
of the crabtree effect in glucose-limited chemostat cultures of Saccharomyces feedback from Pedro Márquez-Zacarías and Peter Conlin. This work was supported by
cerevisiae. Appl. Environ. Microbiol. 55, 468–477 (1989). NSF DEB-1845363 to W.C.R, NSF grant no. IOS-1656549 to W.C.R., NSF grant no. IOS-
62. Dai, Z., Huang, M., Chen, Y., Siewers, V. & Nielsen, J. Global rewiring of 1656849 to E.L., and a Packard Foundation Fellowship for Science and Engineering to W.
cellular metabolism renders Saccharomyces cerevisiae Crabtree negative. Nat. C.R. C.T.R. and W.C.R. acknowledge funding from the NASA Astrobiology Institute.
Commun. 9, 1–8 (2018).
63. Mentel, M. & Martin, W. Energy metabolism among eukaryotic anaerobes in
light of Proterozoic ocean chemistry. Philos. Trans. R. Soc. B 363, 2717–2729 Author contributions
(2008). G.O.B., W.C.R. and C.T.R. conceived of the project. G.O.B. planned, performed, and
64. Martin, W. & Müller, M. The hydrogen hypothesis for the first eukaryote. analyzed the experiments. R.P. assisted with the fitness assays. E.L. and W.C.R. per-
Nature 392, 37–41 (1998). formed the modeling. G.O.B. and W.C.R. wrote the first draft of the paper, and all the
65. Sperling, E. A., Knoll, A. H. & Girguis, P. R. The ecological physiology of authors contributed to the revisions.
Earth’s second oxygen revolution. Annu. Rev. Ecol. Evol. Syst. 46, 215–235
(2015).
66. El Albani, A. et al. The 2.1 Ga old Francevillian biota: biogenicity, taphonomy Competing interests
and biodiversity. PLoS ONE 9, e99438 (2014). The authors declare no competing interests.
NATURE COMMUNICATIONS | (2021)12:2838 | https://doi.org/10.1038/s41467-021-23104-0 | www.nature.com/naturecommunications 9You can also read