Overfishing drives over one-third of all sharks and rays toward a global extinction crisis
←
→
Page content transcription
If your browser does not render page correctly, please read the page content below
Article

Overfishing drives over one-third of all sharks and
rays toward a global extinction crisis
Graphical Abstract                                                        Authors
                                                                          Nicholas K. Dulvy, Nathan Pacoureau,
                                                                          Cassandra L. Rigby, ...,
                                                                          Craig Hilton-Taylor, Sonja V. Fordham,
                                                                          Colin A. Simpfendorfer

                                                                          Correspondence
                                                                          dulvy@sfu.ca (N.K.D.),
                                                                          n.pacoureau@gmail.com (N.P.),
                                                                          colin.simpfendorfer@jcu.edu.au (C.A.S.)

                                                                          In brief
                                                                          The IUCN Red List of Threatened Species
                                                                          is increasingly used to reveal the health of
                                                                          ocean biodiversity. Dulvy et al. assess
                                                                          1,199 chondrichthyans and demonstrate
                                                                          the need for fishing limits on target and
                                                                          incidental catch and spatial protection to
                                                                          avoid further extinctions and allow for
                                                                          food security and ecosystem functions.

Highlights
d   More than one-third of chondrichthyan fish species are
    threatened by overfishing

d   Disproportionate threat in tropics risk loss of ecosystem
    functions and services

d   Three species not seen in >80 years are Critically Endangered
    (Possibly Extinct)

d   The depletion of these species has been driven by continuing
    demand for human food

           Dulvy et al., 2021, Current Biology 31, 1–15
           November 8, 2021 ª 2021 The Author(s). Published by Elsevier Inc.
           https://doi.org/10.1016/j.cub.2021.08.062                                                       ll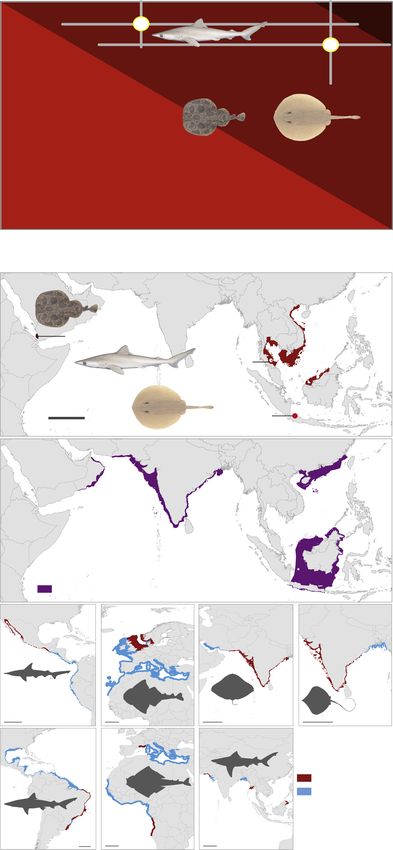
Please cite this article in press as: Dulvy et al., Overfishing drives over one-third of all sharks and rays toward a global extinction crisis, Current Biology
 (2021), https://doi.org/10.1016/j.cub.2021.08.062

                                                                                                                                                   ll
                                                                                                                                             OPEN ACCESS

Article
Overfishing drives over one-third of all
sharks and rays toward a global extinction crisis
Nicholas K. Dulvy,1,18,19,* Nathan Pacoureau,1,* Cassandra L. Rigby,2 Riley A. Pollom,3 Rima W. Jabado,2,4
David A. Ebert,5,6 Brittany Finucci,7 Caroline M. Pollock,8 Jessica Cheok,1 Danielle H. Derrick,1 Katelyn B. Herman,9
C. Samantha Sherman,1 Wade J. VanderWright,1 Julia M. Lawson,10 Rachel H.L. Walls,1 John K. Carlson,11
Patricia Charvet,12 Kinattumkara K. Bineesh,13 Daniel Fernando,14,15 Gina M. Ralph,16 Jay H. Matsushiba,1
Craig Hilton-Taylor,8 Sonja V. Fordham,17 and Colin A. Simpfendorfer2,*
1Earth to Ocean Research Group, Biological Sciences, Simon Fraser University, 8888 University Drive, Burnaby, BC V5A 1S6, Canada
2College  of Science and Engineering, James Cook University, Townsville, QLD 4811, Australia
3IUCN SSC Global Center for Species Survival, Indianapolis Zoo, 1200 West Washington Street, Indianapolis, IN 46222, USA
4Elasmo Project, PO Box 29588, Dubai, United Arab Emirates
5Pacific Shark Research Center, Moss Landing Marine Laboratories, 8272 Moss Landing Road, Moss Landing, CA 95039, USA
6South African Institute for Aquatic Biodiversity, Grahamstown, Eastern Cape 6140, South Africa
7National Institute of Water and Atmospheric Research (NIWA), Wellington, New Zealand
8IUCN, The David Attenborough Building, Pembroke Street, Cambridge, Cambridgeshire CB2 3QZ, UK
9Georgia Aquarium, 225 Baker Street NW, Atlanta, GA 30313, USA
10Bren School of Environmental Science & Management, 2400 Bren Hall, Santa Barbara, CA 93106-5131, USA
11National Marine Fisheries Service, Southeast Fisheries Science Center—Panama City Laboratory, 3500 Delwood Beach Road, Panama

City, FL 32408, USA
12Programa de Pós-Graduação em Sistemática, Uso e Conservação da Biodiversidade, Universidade Federal do Ceará, Fortaleza, Ceará

60440-900, Brazil
13Marine Biology Regional Centre, 130 Santhome High Road, Marine Biology Regional Centre, Tamil Nadu, Chennai, India
14Blue Resources Trust, 86 Barnes Place, Colombo 00700, Sri Lanka
15Department of Biology and Environmental Science, Linnaeus University, SE 39182 Kalmar, Sweden
16International Union for Conservation of Nature Marine Biodiversity Unit, Department of Biological Sciences, Old Dominion University,

Norfolk, VA 23529, USA
17Shark Advocates International c/o The Ocean Foundation, 1320 19th Street NW, Fifth Floor, Washington, DC 20036, USA
18Twitter: @NickDulvy
19Lead contact

*Correspondence: dulvy@sfu.ca (N.K.D.), n.pacoureau@gmail.com (N.P.), colin.simpfendorfer@jcu.edu.au (C.A.S.)
https://doi.org/10.1016/j.cub.2021.08.062

SUMMARY

The scale and drivers of marine biodiversity loss are being revealed by the International Union for Conserva-
tion of Nature (IUCN) Red List assessment process. We present the first global reassessment of 1,199 species
in Class Chondrichthyes—sharks, rays, and chimeras. The first global assessment (in 2014) concluded that
one-quarter (24%) of species were threatened. Now, 391 (32.6%) species are threatened with extinction.
When this percentage of threat is applied to Data Deficient species, more than one-third (37.5%) of chon-
drichthyans are estimated to be threatened, with much of this change resulting from new information. Three
species are Critically Endangered (Possibly Extinct), representing possibly the first global marine fish extinc-
tions due to overfishing. Consequently, the chondrichthyan extinction rate is potentially 25 extinctions per
million species years, comparable to that of terrestrial vertebrates. Overfishing is the universal threat
affecting all 391 threatened species and is the sole threat for 67.3% of species and interacts with three other
threats for the remaining third: loss and degradation of habitat (31.2% of threatened species), climate change
(10.2%), and pollution (6.9%). Species are disproportionately threatened in tropical and subtropical coastal
waters. Science-based limits on fishing, effective marine protected areas, and approaches that reduce or
eliminate fishing mortality are urgently needed to minimize mortality of threatened species and ensure sus-
tainable catch and trade of others. Immediate action is essential to prevent further extinctions and protect the
potential for food security and ecosystem functions provided by this iconic lineage of predators.

INTRODUCTION                                                                      modification and climate change.1–3 These effects, coupled
                                                                                  with those on land, have heralded a new geological epoch—
Human activity has affected the ocean for centuries, directly                     the Anthropocene—characterized by rapid environmental transi-
through fishing and hunting, and indirectly by habitat                            tions driven by humanity.4 On land, the Anthropocene has seen

                                               Current Biology 31, 1–15, November 8, 2021 ª 2021 The Author(s). Published by Elsevier Inc. 1
                                         This is an open access article under the CC BY license (http://creativecommons.org/licenses/by/4.0/).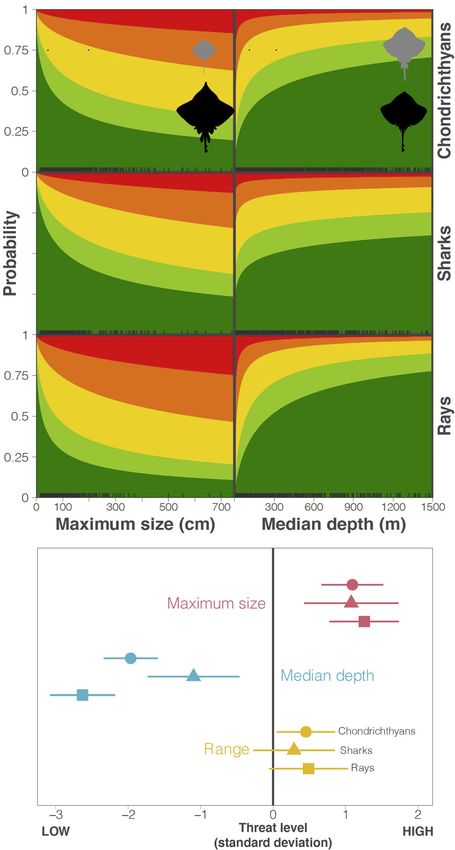
Please cite this article in press as: Dulvy et al., Overfishing drives over one-third of all sharks and rays toward a global extinction crisis, Current Biology
 (2021), https://doi.org/10.1016/j.cub.2021.08.062

           ll
     OPEN ACCESS                                                                                                                                  Article

increased extinctions, with some postulating life on earth is fac-                (44.1%, n = 529) are considered Least Concern (LC). Rays
ing its sixth mass extinction.5 In the ocean, the extinction risk has             are more threatened than previously estimated, with 36.0%
increased most recently over the past century with the growth of                  (n = 220 of 611) of species now threatened, compared to
human populations and associated intensification of industrial                    sharks (31.2%, n = 167 of 536) and chimeras (7.7%, n = 4 of
fishing and technological efficiency, and the rapid development                   52) (Table 1).
of coastlines.6–8 While the recent effects of human pressures
have been well documented for coral reefs,9,10 much of our un-                    Updated threat status compared to the 2014
derstanding of fishery impact is heavily biased toward the                        assessment
most data-rich target species in the developed world.11 How-                      The current observed number of threatened species is more than
ever, statistical predictions, based on life histories, catch, and                twice (391 of 1,199) that of the first global assessment in 2014,
fisheries development, warn that the unassessed data-poor fish-                   which reported 181 of 1,041 species were threatened18 (Fig-
eries, particularly for sharks, may be highly unsustainable.12                    ure 1A). If we assume that DD species are threatened in propor-
   The Class Chondrichthyes (sharks, rays, and chimeras) is one                   tion to the other species, then over one-third (37.5%) of chon-
of the three lineages of fishes, and the most evolutionary distinct               drichthyans are threatened, with a lower estimate of 32.6%
radiation of vertebrates.13 It has survived at least five mass ex-                (assuming DD species are all LC or NT) and an upper estimate
tinctions in its 420 million year history14,15 and has radiated                   of 45.5% (assuming all DD species are threatened; Figure 1A).
throughout the major marine (and some freshwater) habitats,                       In 2014, based on the observed but uncertain threat level, pre-
dominating upper trophic levels and imposing predation risk in                    dictions of the true threat level were made using two methods.
many food webs.16,17 Chondrichthyans are one of the first major                   First, using a trait-based model (similar to the models used in Fig-
marine fish lineages for which extinction risk has been deter-                    ure 4) one-quarter (23.9%; n = 249) of chondrichthyans were pre-
mined for the entire clade. The first global IUCN Red List of                     dicted to be threatened. Second, using the method recommen-
Threatened Species assessment reported at least 17.4% of                          ded by IUCN,26 which assumes that DD species are threatened
1,041 species were threatened, while a trait-based model pre-                     in the same proportion as non-DD species, 33% of species were
dicted one-quarter of all species were threatened.18 That                         predicted to be threatened (n = 340; range 17.4%–64.2%). In
assessment also revealed almost half (46.8%) of species were                      2014, this simple IUCN DD calculation successfully forewarned
Data Deficient (DD), meaning a lack of information inhibited a                    of the likely high threat level, albeit with a high degree of
full grasp of their extinction risk. As our understanding of this                 uncertainty; the current estimate based on the less uncertain
crisis has become clearer, regulatory frameworks and commit-                      2021 assessments is 37.5% threatened species (n = 449, range
ments to halt depletion have evolved. Fishing limits and restric-                 32.6%–45.5%).
tions on trade have increasingly been imposed for both target                        A key question is whether species have genuinely worsened in
and incidentally caught species.19–23 To date, these actions                      status since the last assessment or whether we now have a more
cover a small fraction of chondrichthyans, are applied unevenly                   accurate assessment of status. The reality is that it is a combina-
across species’ ranges, frequently fall short of scientific advice,               tion of both; nevertheless, there are now twice as many threat-
and are often inadequate.23,24                                                    ened species to recover. Next, we consider how the increase
   Reassessment of the extinction risk faced by chondrichthyans                   in threatened species arose from reduction in data deficiency
provides a refined understanding of this group’s trajectory and                   and genuine (an improvement or worsening of the rate of decline,
how individual species are responding to management action                        or population size, or range size, or habitat) and non-genuine
or inaction. More broadly, their distribution across marine habi-                 changes (arising from one or a combination of six reasons; see
tats and a range of higher trophic levels means reassessment en-                  STAR Methods for further details).
ables tracking progress toward broad indicators of the state of
the world’s oceans (e.g., biodiversity targets, Sustainable Devel-                Reduction of data deficiency and non-genuine change
opment Goals).25 Here, we report on the first full reassessment of                due to new knowledge
chondrichthyans almost 10 years after the completion of the first                 The previous global assessment had a very high level of data
global assessment.18 From 2013 to 2021, we assessed 1,199                         deficiency, with nearly half (46.8%, 487 of 1,041) of species clas-
chondrichthyans through 17 workshops resulting in published                       sified as DD. Due to taxonomic changes, this new assessment
Red List global-scale assessments co-authored by 322                              retrospectively finds that 454 of the current species list were
Assessors.                                                                        DD in 2014, compared to 155 of 1,199 (12.9%) in 2021, i.e.,
                                                                                  DD has been reduced by approximately one-third (34.1%, 155/
RESULTS                                                                           454 species). Indeed, we find that, of the species previously
                                                                                  categorized as DD, nearly a quarter (23.4%, n = 106 of 454)
Overall number and percent threatened                                             are now placed in one of the three threatened categories (CR,
We estimate over one-third of chondrichthyans are threatened                      n = 19; EN, n = 24; VU, n= 63), whereas just under half (44.5%,
with extinction globally, based on the observed number                            n = 202) are now LC, and 106 remain DD (Figure 1A). The spatial
of threatened species combined with the estimated number of                       patterning of DD is striking: formerly there were up to 55 DD spe-
DD species that are likely to be threatened (Figure 1A). Of                       cies per hexagon grid cell (23,322 km2; see Figure 7B in Dulvy
1,199 species assessed, 391 (32.6%) are threatened, with 180                      et al.18) and now there are fewer than 10 DD species per hexagon
(15%) Vulnerable (VU), 121 (10.1%) Endangered (EN), and 90                        grid cell (Figure 1B). The current spatial pattern shows high data
(7.5%) Critically Endangered (CR; Table 1). A further 124 species                 deficiency in species-rich countries with considerable scientific
(10.4%) are classified as Near Threatened (NT) and less than half                 capacity to discover new species that might be listed as DD

2 Current Biology 31, 1–15, November 8, 2021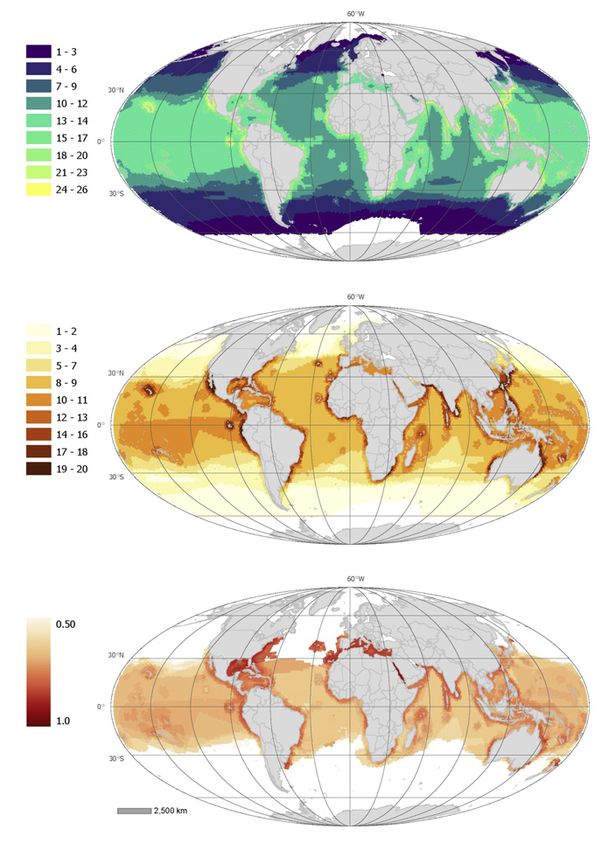
Please cite this article in press as: Dulvy et al., Overfishing drives over one-third of all sharks and rays toward a global extinction crisis, Current Biology
(2021), https://doi.org/10.1016/j.cub.2021.08.062
ll
Article OPEN ACCESS
A Figure 1. Currently, over one-third of chon-
drichthyans are threatened
(A) Difference in IUCN Red List status between
2021 (upper bar) and the first assessment (lower
bar, 2014). This current threat is much greater
(37.5%, estimated range 32.6%–45.6%, red line in
upper bar), based on the observed number of
threatened species combined with the estimated
number of Data Deficient (DD) species that are
likely to be threatened, than the 24% estimated
using a trait-based model in 2014 (gray line in
lower bar) and more similar to the estimate from
the IUCN DD estimator (red line in lower bar, 33%,
range 17%–64%).
(B) The spatial pattern of data deficiency (scale
bar, 2,500 km).
B (C) Euler diagram of three main reasons for non-
genuine change: new information, knowledge of
criteria, and taxonomy.
(D) Half a century of exponential growth in peer-
reviewed scientific literature on sharks, rays, and
chimeras indexed on the Web of Science. CR,
Critically Endangered; EN, Endangered; VU,
Vulnerable; NT, Near Threatened; LC, Least
Concern; DD, Data Deficient.
see STAR Methods for details). The last
decade has seen major improvements in
information and taxonomy, notably with
C D
the publication of major field guides for
sharks29 and rays30 resulting in 171 NE
species assessed for the first time and
50 revised taxonomic concepts. The vol-
ume of peer-reviewed chondrichthyan
research is growing exponentially with
the number of scientific papers published
doubling each decade (Figure 1D). In
addition, a concerted effort to compile
time series of relative abundances, com-
bined with decision-support Bayesian
state-space methods has improved pop-
ulation reduction estimates.31–34 These
approaches were applied to 111 (9.3%)
assessments. Prior to this development,
the calculation of population reduction
(New Zealand, Australia, Taiwan, and Japan), as well as areas of relatively data-rich species was controversial (1) because of
with a high degree of endemicity where research is particularly the challenge of choosing among multiple, potentially contradic-
needed: the Western Indian Ocean, southern Brazil, the Pacific tory time series, and (2) because the focal species was a target or
coast of Nicaragua, and the Gulf of California13,27,28 (Figure 1B). significant incidental catch of commercial fisheries.33 Further,
Next, we consider how the increase in threat level and number of new space-for-time approaches were applied to extensive
LC species in this reassessment is due to the reduction in DD baited remote underwater video abundance estimates for nine
species through non-genuine changes. wide-ranging coral reef species35 (STAR Methods).
Excluding the previously Not Evaluated (NE) species, just un- A genuine status change was recorded for only 15 species
der half (43.6%, n = 448) of chondrichthyan species have not (1.6%, seven sharks and eight rays): twelve species have wors-
changed status since 2014, and just over half (55%, n = 565) ened (i.e., moved to a higher threat category) and three skate
have undergone some form of non-genuine status change species have improved (i.e., moved to a lower category). These
(Figure 1C). Much of the non-genuine change can be genuine improvements demonstrate the promise of fishery man-
attributed to three main reasons: new information (94.2% of agement for addressing declines. The New Zealand Smooth
non-genuine changes), improved application of the criteria Skate (Dipturus innominatus) moved from NT to LC due to
(28.5%), and improved taxonomic resolution (6.5%, Figure 1C; population increases attributed to the implementation of
Current Biology 31, 1–15, November 8, 2021 3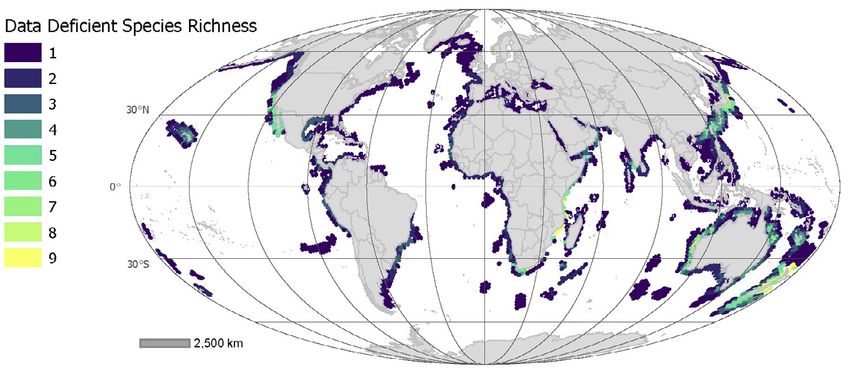
Please cite this article in press as: Dulvy et al., Overfishing drives over one-third of all sharks and rays toward a global extinction crisis, Current Biology
 (2021), https://doi.org/10.1016/j.cub.2021.08.062

            ll
        OPEN ACCESS                                                                                                                               Article

Table 1. Observed number and percent of chondrichthyan species in IUCN Red List categories
                                   Number                      Number
                    Species number threatened                  threatened
                    (% of 1,199)   (% of 391)                  (% of group)         CR (%)      EN (%)      VU (%)       NT (%)       LC (%)       DD (%)
Taxon
Raysa               611 (51.0)           220/391 (56.3)        220/611 (36.0)       55 (9.0)    65 (10.6) 100 (16.4) 70 (11.5)        246 (40.3) 75 (12.3)
Sharks              536 (44.7)           167/391 (42.7)        167/536 (31.2)       37 (6.9)    54 (10.1) 76 (14.2)      49 (9.1)     248 (46.3) 72 (13.4)
Chimeras            52 (4.3)             4/391 (1.0)           4/52 (7.7)           0 (0.0)     0 (0.0)     4 (7.7)      4 (7.7)      35 (67.3)    9 (17.3)
Total               1,199                                      391 (32.6)           92 (7.7)    119 (9.9) 180 (15.0) 123 (10.3) 529 (44.1) 156 (13.0)
Habitat
Coastal             582 (48.5)           296/391 (75.7)        296/582 (50.9)       77 (13.2) 81 (13.9) 138 (23.7) 75 (12.9)          161 (27.2) 50 (8.5)
Deepwater           572 (47.7)           65/391 (16.6)         65/572 (11.3)        11 (1.9)    20 (3.5)    34 (5.9)     47 (8.2)     355 (62.1) 105 (18.4)
Pelagic and         38 (3.2)             23/391 (5.9)          23/38 (62.2)         3 (7.9)     13 (34.1) 8 (21.1)       1 (2.6)      13 (34.2)    0 (0.0)
mesopelagic
Freshwatera         7 (0.6)              6/391 (1.5)           6/7 (85.7)           1 (14.3)    5 (71.4)    0 (0.0)      0 (0.0)      0 (0.0)      1 (14.3)
Separated for the three main extant lineages—rays (Subclass Batoidea), sharks (Subclass Selachimorpha), and chimeras (Suborder Holocephali)—
and for the four main habitats. CR, Critically Endangered; EN, Endangered; VU, Vulnerable; NT, Near Threatened; LC, Least Concern; DD, Data Defi-
cient. Number threatened is the sum of CR, EN, and VU. Species number and number threatened are expressed as percentage of the total species
number (1,199) and total number threatened (391), respectively. The percent of each species in IUCN Red List categories is expressed relative to the
total number of species in the group (taxon or habitat).
a
  Excluding South American freshwater stingrays

science-based catch quotas since 2003.36 Two other large                          numerous other poorly known species assessed as LC or DD,
skates from the Northwest Atlantic shelf seas have recovered                      e.g., the Papuan Guitarfish (Rhinobatos manai) and the Pocket
from severe depletion: Barndoor Skate (D. laevis) and Smooth                      Sharks (Mollisquama spp.). These species are known from only
Skate (Malacoraja senta). While the reasons are not fully under-                  one specimen, and all were assessed as LC based on their low
stood, recovery is partially due to closure of the targeted skate                 likelihood of capture by fisheries.
fishery in Canada and landing prohibitions in the USA.37,38 The                      These are the first reports of likely global extinctions of chon-
smooth skate improved from EN to VU due to increases in abun-                     drichthyans and overexploitation is the most parsimonious expla-
dance indices in the southern part of its range in the USA and the                nation for the cause of these disappearances.46 We attribute
eastern Grand Banks in Canadian waters while the barndoor                         cause to overfishing for three main reasons: (1) as we show
skate improved from EN to LC based on recovery since the                          next, all threatened species are imperiled by overexploitation;
mid-1990s; the population index has exceeded 1965 abundance                       (2) we considered all 11 major threats in the IUCN threat classifi-
levels for almost a decade.37                                                     cation scheme for each threatened species; and (3) these species
                                                                                  are all distributed in the northern Indian Ocean and more than
Emergence of extinctions most likely due to overfishing                           75% of species in any map cell are threatened through this region
Three species are now likely to be extinct, and there are at least                (Figures 6C and S2). The Lost Shark and the Java Stingaree both
eight cases of local extinction. Based on comparison across all                   occurred in the heavily fished waters of Southeast Asia, while the
of the CR and EN species and the application of a new method-                     Red Sea torpedo was known only from a small section of the Red
ology, three species were classified as Critically Endangered                     Sea (Figure 2B). The Java Stingaree and Red Sea Torpedo likely
(Possibly Extinct) (CR(PE))39,40 (Figure 2). Both the Lost Shark                  had small ranges that might have increased their sensitivity to
(Carcharhinus obsoletus) and the Java Stingaree (Urolophus jav-                   extinction risk. Three local extinctions notably occurred in the
anicus) were estimated to have extinction probabilities pextinct of               northern Indian Ocean (Tentacled Butterfly Ray, Gymnura tenta-
0.77 and 0.84, meeting the threshold for CR(PE) (pextinct be-                    culata; Indian Sharpnose Ray, Telatrygon crozieri; and Ganges
tween 0.5 and 0.9). The Pondicherry Shark (Carcharhinus hemi-                     Shark, Glyphis gangeticus; Figure 2C). We have not included
odon), which has not been seen for 30 years, had a pextinct of                    further local extinctions that are more recently mapped and
0.464, which is just below the CR(PE) threshold and thus listed                   extensively documented for sawfishes and Northeast Atlantic
as CR.41–43 The Red Sea Torpedo (Torpedo suessi) was as-                          angel sharks. These eight species are locally and regionally
sessed as CR(PE) in 2017 prior to the development of the latest                   extinct, on average, from more than half of their former ranges47,48
criteria. These probabilities are in part based on a lack of sight-
ings for nearly a century despite considerable passive surveil-                   Overfishing is the key threat driven by use and trade
lance and recent directed surveys, but more directed surveys                      Of the 1,093 species, 99.6% were threatened by overfishing
are needed to definitively conclude extinction.39,40 The Java                     mainly due to unintentional catch (often referred to as bycatch).
Stingaree has not been recorded since 1868, the Red Sea Tor-                      Overfishing is the main threat for all 391 threatened species
pedo since 1898, and the lost shark since 1934.41,42,44,45 These                  (Figure 3A) and is the sole threat for two-thirds of species
CR(PE) species are poorly known to science with few confirmed                     (67.3%, n = 263; Figure 3A). Large-scale (industrial) fisheries
specimens collected from limited localities. Yet there are                        are the key threat, either on their own as a unique threat

4 Current Biology 31, 1–15, November 8, 2021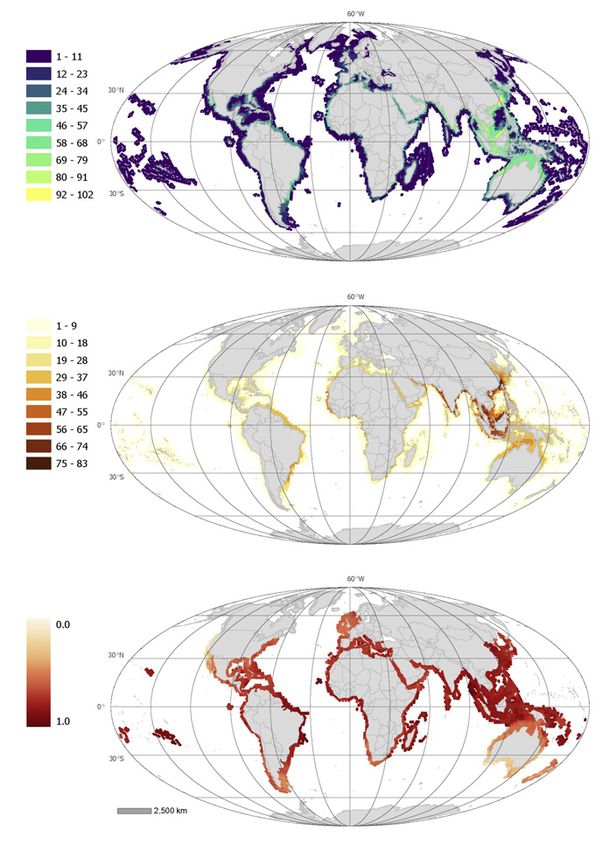
Please cite this article in press as: Dulvy et al., Overfishing drives over one-third of all sharks and rays toward a global extinction crisis, Current Biology
(2021), https://doi.org/10.1016/j.cub.2021.08.062

                                                                                                                                                    ll
Article                                                                                                                                       OPEN ACCESS

A                                                                                                           Figure 2. Global and local extinctions of
                                                                                                            sharks and rays
                                                                                                            (A) Two rays and one shark are now Critically En-
                                                                                                            dangered (Possibly Extinct) (CR(PE)). The probabil-
                                                                                                            ity that local threats are high and span the range of
                                                                                                            both the Lost Shark and Java Stingaree resulting in a
                                                                                                            high and relatively certain threat probability (y axis).
                                                                                                            However, the low level of passive surveillance and
                                                                                                            directed surveys mean the probability of extinction
                                                                                                            estimated using the record and survey model is
                                                                                                            lower and less certain (x axis). The Red Sea Torpedo
                                                                                                            was evaluated as CR(PE) in 2017 prior to the
                                                                                                            development of the guidance on the application of
                                                                                                            the Records & Survey Model and the Threats Model
                                                                                                            and does not have an extinction probability.
                                                                                                            (B) The former geographic range of the three CR(PE)
                                                                                                            species (scale bar, 1,000 km).
                                                                                                            (C) Former range of the CR Pondicherry Shark
                                                                                                            based on the Country of Occurrence (COO) classi-
                                                                                                            fication of ‘‘Possibly Extant.’’
                                                                                                            (D) Local extinctions of seven species based on the
      B                                                                                                     COO classification of ‘‘Possibly Extinct.’’ Images
                                                                                                            were drawn by Dr. Lindsay Gutteridge.

      C

      D

                                                                                                        Current Biology 31, 1–15, November 8, 2021 5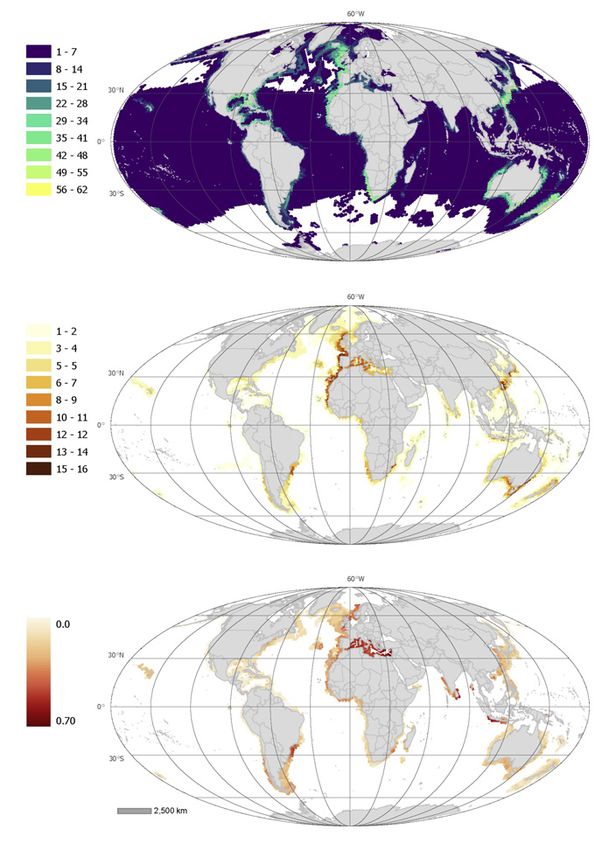
Please cite this article in press as: Dulvy et al., Overfishing drives over one-third of all sharks and rays toward a global extinction crisis, Current Biology
 (2021), https://doi.org/10.1016/j.cub.2021.08.062

           ll
     OPEN ACCESS                                                                                                                                   Article

A                                                                                                             Figure 3. Threats to chondrichthyans and
                                                                                                              the use and trade of the species threatened
                                                                                                              by overexploitation
                                                                                                              (A) An ‘‘upset plot’’ of species threats and threat
                                                                                                              combinations following the IUCN Red List threat
                                                                                                              classification scheme. The upper bar chart repre-
                                                                                                              sents the percentage of species for which each
                                                                                                              threat was reported. The bar chart on the right
                                                                                                              represents the number of species threatened only
                                                                                                              by exploitation (upper righthand bar) or combina-
                                                                                                              tion of threats (shown by the combination of
                                                                                                              colored circles and connecting lines in each row).
                                                                                                              The gray circles denote the threat is not included in
                                                                                                              the combination.
                                                                                                              (B) Interaction web of the uses and trade. The
                                                                                                              predominant use is food for human consumption,
                                                                                                              alone or in combination with others—as shown by
                                                                                                              connecting lines to other uses.
B                                                                                                             See also Table S1.

                                                                                                            Overfishing is compounded by
                                                                                                            habitat loss, climate change, and
                                                                                                            pollution
                                                                                                            Three additional main threats were
                                                                                                            identified that act in combination with
                                                                                                            exploitation. Habitat loss and degrada-
                                                                                                            tion compound overfishing for nearly
                                                                                                            one-fifth (18.7%, n = 73) of threatened
                                                                                                            species (Figure 3A). Habitat loss and
                                                                                                            degradation take the form of seven
                                                                                                            sub-threat classes dominated by resi-
                                                                                                            dential and commercial development
                                                                                                            (25.8%, n = 101), agriculture and aqua-
                                                                                                            culture operations (mainly mangrove
                                                                                                            loss and degradation, 9.5%, n = 37), nat-
                                                                                                            ural system modifications (4.6%, n = 18),
(36.5%; Table S1) or in combination with other fisheries (96% of                  human intrusions and disturbance (2.6%, n = 10), energy
species; Table S1). Large-scale fisheries are often compounded                    production and mining (1.5%, n = 6), invasive and other prob-
by incidental catch in small-scale fisheries (62.3%; Table S1).                   lematic species (0.8%, n = 3), and transportation and service
Almost all species of chondrichthyan are taken unintentionally                    corridors (0.8%, n = 3).
in fisheries (99%, 1,082 of 1,093; Table S1). While the catch                        Climate change is a rapidly emerging concern for threat-
may be incidental, chondrichthyans are, with few exceptions, re-                  ened chondrichthyans (10.2%, n = 40) and compounds the
tained for food and animal feed and indeed may be the unofficial                  effects of overfishing and habitat loss for 6.1% of species
target species in many fisheries.                                                 (n = 24; Figure 3A, row 3 horizontal barchart). Climate change
   Most fished species have multiple uses and are often fully uti-                threatens via two main pathways. First, the loss and degrada-
lized. Most threatened species are utilized (90.7%, 355 of 391);                  tion of habitat from the reduction of coral cover due to
the remainder are likely discarded, which still results in some mor-              bleaching and disease risks affecting the health of coral
tality. When retained, most threatened species are used for food                  reef-associated species, such as the walking sharks (Hemi-
consumption by humans (96.6%, n = 343 of the 355; Figure 3B).                     scylliidae).49 Second, some temperate species are declining
Half of threatened species are consumed only as food by humans                    at their equatorward boundary where rising water tempera-
(51.5%; Figure 3B). The remainder are also used for a range of                    ture makes their native habitat less suitable.50,51 For example,
purposes, including animal feeds (29%), and skins and other                       the Thorny Skate (Amblyraja radiata) population has declined
body parts are fashioned into apparel/accessories (15.5%).                        by more than 80% over the past three generations in the
Further, 16.3% of species, predominantly threatened deepwater                     southern parts of its North Atlantic range, yet is increasing
and coastal Squaliformes, are retained for their liver oil, which                 further north.52
is used in pharmaceuticals (e.g., health supplements and as                          Pollution is typically a non-lethal stressor affecting 6.9% (n =
vaccine adjuvant, 9.3%) and as biodiesel fuel (7%; Figure 3B).                    27) of threatened chondrichthyans. All four main threats,
Chondrichthyans are also removed from the wild for aquarium                       together, affect 2.8% (n = 11) of threatened species (Figure 3A,
use (8.5%) and scientific research (3.4%; Figure 3B).                             row 5).

6 Current Biology 31, 1–15, November 8, 2021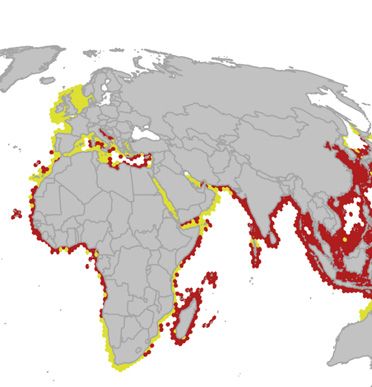
Please cite this article in press as: Dulvy et al., Overfishing drives over one-third of all sharks and rays toward a global extinction crisis, Current Biology
 (2021), https://doi.org/10.1016/j.cub.2021.08.062

                                                                                                                                                   ll
Article                                                                                                                                      OPEN ACCESS

Which species, habitats, and places are most                                      species is somewhat decoupled from the global richness pattern
threatened?                                                                       due to the patchiness of these fisheries. Deepwater richness is
The probability that a chondrichthyan species is threatened can                   greatest in subtropical boundaries, but with notable tropical rich-
be broadly predicted by body size and median depth. Larger-                       ness in the Caribbean and temperate richness in the Northeast
bodied species are more likely to be threatened than smaller                      and Eastern Central Atlantic Oceans, Japan, Taiwan, south-
species (Figures 4A and 4B). The level of threat to chon-                         eastern Australia, and New Zealand (Figure 6D). Deepwater
drichthyans is so high that even medium-sized species                             threat is disproportionately high in the Southwest Atlantic, North-
(>150 cm), such as the Yellownose Skate (Dipturus chilensis),                     east Atlantic Ocean and Mediterranean Sea, southern India and
have a high likelihood (probability > 0.5) of being threatened (Fig-              Sri Lanka, southern Java (Indonesia), and the Northwest Pacific
ure 4A). Species with a shallower median depth are more likely to                 (Figures 6E and 6F). Richness and threat of pelagic and mesope-
be threatened than deeper-dwelling species (Figures 4A and 4B).                   lagic species are similar and centered on the tropical and sub-
For example, Broadnose Skate (Bathyraja brachyurops) has a                        tropical oceans with greatest concentration along the continen-
median depth of 316 m and is NT, whereas Spotback Skate                           tal and insular shelf breaks (Figures 6G and 6H). The Atlantic
(Atlantoraja castelnaui) has a median depth of 110 m and is CR                    Ocean has the greatest proportion of threatened pelagic and
(Figure 4A). This pattern holds across all species, and in sharks                 mesopelagic species, particularly in the Gulf of Mexico and along
and rays separately (Table S2). Geographic range has limited                      the east coast of the USA, and Northeast Atlantic Ocean and
explanatory power and there is little evidence that species with                  Mediterranean Sea (Figures 6H and 6I).
a larger range have relatively lower extinction risk (Table S3). In                   The combination of body size, depth refuge from fishing, and
fact, rays with larger geographic ranges are at greater risk than                 the high intensity of threat in the tropics and subtropical waters
those with smaller geographic ranges (Figure 4B). The categori-                   is reflected in the pattern of threat across families. Pelagic eagle
cal trait-based predictive models revealed that 15 of 141 DD                      rays and devil rays join the giant guitarfishes, sawfishes, wedge-
species could be threatened (all VU), yielding a total of 406                     fishes, hammerhead sharks, and angel sharks as the most
(34%) threatened species, comparable to the IUCN estimate of                      threatened families .47,48,56 Further, many highly threatened fam-
37.5% (Data S1; Figure S1). Our interpretation is that relatively                 ilies include some of the most speciose mainstays of tropical
larger-bodied species have lower maximum population growth                        coastal landing sites, where catches were historically dominated
rates and are less able to replace the numbers removed by                         by stingrays, requiem sharks, guitarfishes, eagle rays, and
overfishing, compared to smaller species.53–55 Further, unlike                    weasel sharks (Table S4). Finally, the high level of threat in the
shallow species, deeper-dwelling species have refuge from                         gulper shark reflects the expansion of deepwater fisheries (Table
mortality if a significant fraction of their depth range is beyond                S4).
the reach of fisheries.18,55
   The global spatial pattern of threatened species closely tracks                DISCUSSION
species richness, but areas of disproportionately high risk can be
identified throughout the tropical and subtropical coastal seas                   This first global reassessment of the Class Chondrichthyes
(Figure S2). Regions with higher richness have greater numbers                    yielded more than double the number of threatened species,
of threatened species (Figures 5A and 5B), with proportionally                    which means the conservation challenge is now at least twice
more threatened species in the tropics and subtropics (Fig-                       as great as previously thought in 2014. Accounting for the
ure 5C). The greatest richness occurs in the coastal shelf waters                 12.9% of DD species, the proportion threatened is now 37.5%
of the tropics and particularly at the boundary with subtropical                  based on IUCN criteria and is at least 34% based on the trait-
ecosystems, e.g., Brazil, South Africa, Australia, and Taiwan                     based model (Data S1; Figure S1). While it is difficult to under-
(Figure 6A). Threat is greatest in coastal shelf waters with                      stand the true level of genuine change since the first assessment,
75.7% (n = 296 of 391) of threatened species occurring there                      this will eventually become clearer when we calculate the Red
compared to deepwater (16.6%) and the pelagic ocean (5.9%;                        List Index (RLI) for all chondrichthyans, but RLIs for species sub-
Table 1). The greatest richness occurs in the coastal waters of                   sets already indicate very significant genuine change over
northeast Taiwan and the greatest threat is also found there,                     time.32,56,57 After the amphibians, chondrichthyans are the
with 105 threatened species in a single 23,322 km2 hexagonal                      most threatened vertebrate Class assessed to date.58 More
grid cell resulting from high levels of overfishing of both coastal               than 75% of species are threatened throughout tropical and sub-
and deepwater species (Figures 6A, 6B, 6D, and 6E). Coastal                       tropical coastal and pelagic waters, warning of widespread loss
threat is disproportionately high in the tropics and subtropics                   of ecological function and services.
where more than three-quarters of species are threatened,                            For the first time, three species are listed as CR(PE). These
particularly in the waters of the longest standing and most inten-                were formerly assessed as DD, suggesting a high likelihood
sive chondrichthyan fisheries in the world, including the northern                that species losses are going largely unnoticed or unreported.59
Indian Ocean and Western Central and Northwest Pacific                            Emerging large-scale local chondrichthyan extinctions and the
Oceans, from Pakistan to Japan and as far east as the Wallace                     three CR(PE) species forewarn that overfishing is sufficiently
Line (between Bali and Lombok; Figures 6B, 6C, and S2). This                      intense and widespread to cause significant irreversible biodi-
disproportionately high level of threat in the Indo-Pacific Ocean                 versity loss in tropical coastal seas, particularly off Mexico,
risks overshadowing high levels of threat throughout the coastal                  Brazil, and throughout the northern Indian and Western Central
waters of South America, particularly Brazil and Uruguay and the                  Pacific Oceans (Figure 2). At least four species are close to
Mediterranean Sea, as well as West and East Africa, including                     global extinction; extensive caveats are detailed in the Red
Madagascar (Figures 6B and 6C). The threat to deepwater                           List assessments. In the case of the Lost Shark, there are three

                                                                                                         Current Biology 31, 1–15, November 8, 2021 7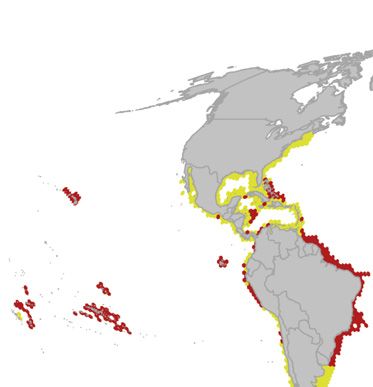
Please cite this article in press as: Dulvy et al., Overfishing drives over one-third of all sharks and rays toward a global extinction crisis, Current Biology
 (2021), https://doi.org/10.1016/j.cub.2021.08.062

           ll
     OPEN ACCESS                                                                                                                                   Article

A                                                                                                            Figure 4. Global trait models of chon-
                                                                                                             drichthyan extinction risk
                                                                                                             (A) The effects of maximum body size, median
                                                                                                             depth, and geographic range size on the probability
                                                                                                             that a data-sufficient chondrichthyan (upper row),
                                                                                                             shark (middle row), or ray (lower row) is listed as
                                                                                                             either Critically Endangered (CR), Endangered (EN),
                                                                                                             Vulnerable (VU), Near Threatened (NT), or Least
                                                                                                             Concern (LC) based on cumulative link mixed-ef-
                                                                                                             fects models. The black/gray vertical arrows indi-
                                                                                                             cate the probability that a skate was categorized as
                                                                                                             threatened (i.e., VU, EN, or CR). South American
                                                                                                             skates offer a range of depths and body sizes
                                                                                                             matched for phylogeny and geography. We contrast
                                                                                                             the small-bodied Spotted Legskate (29 cm total
                                                                                                             length, TL) with the large-bodied Yellownose Skate
                                                                                                             (158 cm TL, upper left panel), and the shallow
                                                                                                             dwelling Spotback Skate (110 m median depth) with
                                                                                                             the deep-dwelling Broadnose Skate (315 m median
                                                                                                             depth, upper right panel). Maximum size was
                                                                                                             measured as maximum linear dimension for chon-
                                                                                                             drichthyans (i.e., TL or disc width, DW), whereas
                                                                                                             maximum size for sharks and some rays was
                                                                                                             defined as maximum TL and as DW for some rays.
                                                                                                             Median depth (m) was calculated as the midpoint
                                                                                                             between upper and lower depth as documented in
                                                                                                             the Red List assessment (Figures S1 and S2; Tables
                                                                                                             S3–S5).
                                                                                                             (B) Standardized effect sizes (with standard error) of
                                                                                                             trait-based models of extinction risk of data-suffi-
                                                                                                             cient chondrichthyans (n = 1,178 species), sharks
                                                                                                             (n = 528), and rays (n = 598).
                                                                                                             See also Table S2 and Data S1.

B

8 Current Biology 31, 1–15, November 8, 2021
Please cite this article in press as: Dulvy et al., Overfishing drives over one-third of all sharks and rays toward a global extinction crisis, Current Biology
(2021), https://doi.org/10.1016/j.cub.2021.08.062
ll
Article OPEN ACCESS
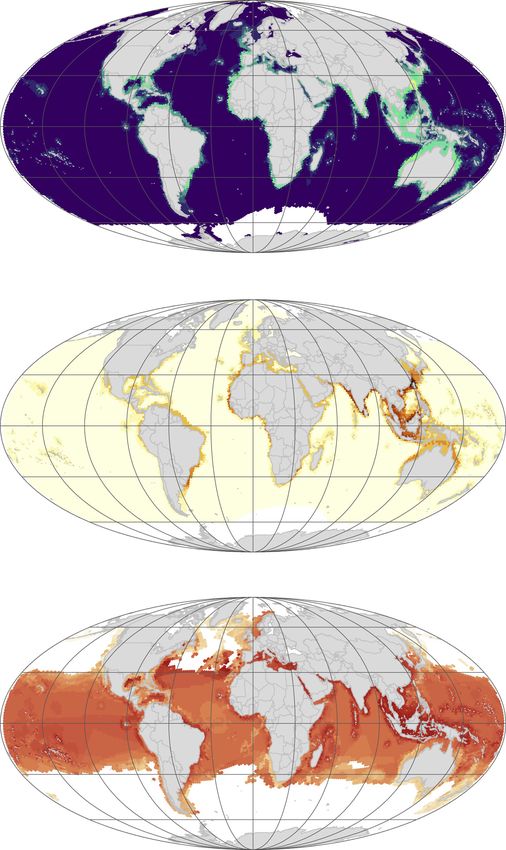
Figure 5. Global chondrichthyan richness
and threat
(A) Species richness as the number of species per
hexagonal cell.
(B) Number of threatened species per cell.
(C) Proportion of species that are threatened only
for cells with more than 10 species (see Figure S2
for disproportionate threat). Scale bar, 2,500 km.
See also Table S4.
remaining known range.62 Conse-
quently, this species was assessed
globally as CR in 2021.42 Even with
increased research on chondrichthyans
(Figure 1D), the likelihood of rediscov-
eries and downlisting is lower for the
three species assessed using the threat
modeling approach. Nevertheless, there
remains a dim possibility that further
searches will find additional specimens.
Furthermore, the increased number of
CR species suggests that this number
of CR(PE) will grow unless urgent action
is taken to dramatically reduce or elimi-
nate fishing mortality, possible through
strict species protection and large-scale
marine protected areas.
Notwithstanding these caveats, which
would also apply to terrestrial CR(PE)
species, we provide the first chon-
drichthyan extinction rate of potentially
25 extinctions per million species years
(E/MSY), assuming three of 1,199 spe-
cies have been driven toward extinction
in the past 100 years. This rate is similar
to that of terrestrial vertebrates, which is
33.6 E/MSY based on 519 of 30,873
bird, mammal, reptile, and amphibian
species listed as Extinct, Extinct in the
Wild, or CR(PE) over the past 500 years.63
As with terrestrial vertebrates, the chon-
drichthyan extinction rate exceeds the
proposed target rate of less than 10 E/
MSY over the next century.63 Even if
lines of evidence in support of extinction and here we summa- only two species were CR(PE), this yields 16.7 E/MSY, which is
rize the three against extinction: (1) it does not have any 17–170 times greater than the background extinction rate in
ecological specialization that might predispose it to extinction the fossil record (0.1–1 E/MSY).
(though both rays may well have had small geographic ranges), The urgent challenge is to halt and reverse population declines
(2) as a small requiem shark it can be difficult to differentiate and minimize extinction risk in order to bend back the marine
from other similar species and could go unnoticed among biodiversity loss curve.64 This requires immediate policy actions
catches of other carcharhinids, and (3) the recent rediscovery bolstered by targeted enforcement and educational programs.
of two other ‘‘lost’’ carcharhinid species cautions that further The killing and landing of chondrichthyans listed as CR or EN
specimens of the lost shark might be found in the future with (collectively referred to as endangered) should be strictly pro-
more directed surveys.41,60,61 As a further cautionary note, hibited wherever possible. In some cases, countries have
the Tentacled Butterfly Ray was regionally assessed as already pledged and/or have treaty obligations to do this, but
CR(PE) in the 2017 Arabian Sea and adjacent waters. More enforcement remains inadequate.23 However, in others, espe-
recent surveys revealed the existence of this species in Iranian cially developing countries throughout the global tropics where
waters despite no records for several decades across its small-scale and subsistence fisheries are common, these
Current Biology 31, 1–15, November 8, 2021 9Please cite this article in press as: Dulvy et al., Overfishing drives over one-third of all sharks and rays toward a global extinction crisis, Current Biology
(2021), https://doi.org/10.1016/j.cub.2021.08.062
ll
OPEN ACCESS Article
A D G
B E H
C F I
Figure 6. Global chondrichthyan species richness, threat, and proportion threatened by habitat
(A, D, and G) Chondrichthyans species richness by habitat.
(D, E, and H) Number of threatened chondrichthyans by habitat.
(C, F, and I) Threatened species as proportion of total richness (for cells with >10 species) by habitat.
(A–C) Coastal species (200 depth), and (G–I) pelagic and mesopelagic species found in the open ocean. Scale bar,
2,500 km.
species play important roles in food security and livelihoods that chondrichthyan populations to the point where they contribute
make strict protections difficult to implement and enforce.65 In to the global extinction risk of wide-ranging species, such as
these situations, novel management approaches that transform angel sharks, sawfishes, and many rhino rays.47,48,56
markets and providing alternate livelihood options may provide a Governments worldwide have committed to address these
way forward that takes account of the needs of fishing commu- threats repeatedly over several decades through the FAO
nities.66 Other approaches, such as effective marine protected Code of Conduct for Responsible Fisheries and the International
areas,67,68 conservation engineering,69 trade regulations (e.g., Plan of Action for Conservation and Management of Sharks, as
appendix listings on the Convention on International Trade in En- well as numerous international biodiversity and fishery treaties
dangered Species of Flora and Fauna),22 and initiatives that and UN Sustainable Development Goals (e.g., Fischer et al.73).
reduce the incentives of retaining catches,70 are among a range The high and rising chondrichthyan extinction risk shows that
of tools that can be implemented to reduce mortality of endan- management measures undertaken to date have been seriously
gered species, arresting declines, and enabling recovery. insufficient, have low compliance rates, and/or have not been
To prevent VU, NT, and LC species from becoming endan- implemented and are thus failing to reverse the decline for
gered, fisheries must be managed for sustainability through fish- almost all species.23,24 Some of the most recent policy actions
ing limits based on scientific advice and/or the precautionary may not have had sufficient time to stem declines, taking into ac-
principle. The issue of incidental capture is central to chon- count the generally low reproductive rates of this taxon.23,54
drichthyan conservation, but definitions and perceptions vary Fisheries management measures, primarily catch limits, have
quite widely, from catch that is discarded to that which is re- succeeded in the rebuilding and sustainable exploitation of
tained for consumption and sale, alongside the focal or target several chondrichthyan populations and species in the USA,
species of the fishery.20,71 IUCN data reflect whether catch is Canada, Europe, Australia, and New Zealand,21 and the
intentional or unintentional, but in reality, this aspect is difficult improvement of two Endangered species (Barndoor Skate and
to ascertain and can change from day to day, depending on Smooth Skate). It is important to note that many developed
availability and markets. Too often, bycatch is incorrectly countries have some form of chondrichthyan catch limit for
perceived as unavoidable and labeling catch as such can inhibit both endangered and target species and extending these suc-
management attention. Depleted species may be exceptionally cesses to countries with lower fisheries management capacity
valuable and welcomed as catch, but simply insufficiently plenti- and food security crises is a key challenge.65,66 Considerable
ful to be a true target of fishing operations and management effort has already been deployed to address this challenge,74
attention.72 Ultimately, it is the mortality that matters, regardless but much remains to be done given the diversity of species at
of fishers’ intentionality. Excessive fishing mortality has resulted risk and the wide range of socio-economic conditions in which
in the serial depletion and local extinction of numerous the fisheries that catch sharks operate.
10 Current Biology 31, 1–15, November 8, 2021Please cite this article in press as: Dulvy et al., Overfishing drives over one-third of all sharks and rays toward a global extinction crisis, Current Biology
(2021), https://doi.org/10.1016/j.cub.2021.08.062
ll
Article OPEN ACCESS
A brighter future for chondrichthyans depends urgently on en- ACKNOWLEDGMENTS
acting effective fisheries regulations that focus on reducing
We thank all members of the IUCN Species Survival Commission Shark
catches to sustainable levels and, wherever possible, strictly
Specialist Group and invited national, regional, and international experts who at-
protecting endangered species. These actions should be tended SSG Red List workshops, as well as all the experts who contributed data
bolstered by well-enforced measures to minimize incidental and their expertise in-person or by correspondence. We thank additional Global
mortality, including bycatch mitigation technologies, best prac- Shark Trends project staff, an IUCN SSG Program Officer, Regional Vice-Chairs,
tices for handling and release, and effective marine protected local organizers, and volunteers: Martin Clark, Zoe Crysler, Peter M. Kyne, Helen
areas that can provide species with refuge from fishing Yan, Lucy Harrison, Ahmed Ali, Carlos Bustamante, Mika Diop, Mario Espinoza,
Fahmi, Ed Farrell, Vicente Faria, David Kulka, Chris Lowe, Alec Moore, Mabel
throughout a meaningful fraction of their range. The increasing
Manjaji-Matsumoto, Alexei Orlov, Melita Samoilys, Fabrizio Serena, Alen Soldo,
likelihood of extinction in the marine realm suggests that chon-
Oscar Sosa-Nishikawa, Atsuoko Yamaguchi, Ed Brooks, Andrew Chin, Matt
drichthyans may face a future similar to that of biodiversity on Gollock, Heather Koldewey, Shawn Larson, Peter Last, Cecilia Mancusi, Paola
land, where human pressures have led to the loss of numerous s Navia, Angus Paterson, Sebastián Pardo, Sally Schramm,
Meı́ja-Falla, Andre
species and possibly triggered a sixth mass extinction.7,59,75 Im- Eric Schneider, and Brendan Talwar. We thank IUCN Staff and Species Survival
mediate, global implementation of sound fisheries management Commission officers: Resit Akçakaya, David Allen, Ariadne Angulo, Tom
measures is also an adaptation to climate change and is essen- Brookes, Stuart Butchart, Kent Carpenter, Will Darwall, Marina Garcia, Mike
Hoffmann, James Kemp, Jennifer Luedtke, Nicholas MacFarlane, Ana Nieto,
tial to avoiding this fate and allowing for sustainable chon-
Mia Comeros-Raynal, Catherine Sayer, Simon Stuart, Jean-Christophe Vie ,
drichthyan fishing over the long term. Amanda Vincent, and Bruce Young. This work would not have been possible
without the support of Amie Bra €utigam, Paula Carlson, Ben Collen, Andy Cor-
nish, Lindsay Davidson, Jim Ellis, Sarah Fowler, Lindsay Gutteridge, Ali Hood,
STAR+METHODS Holly Kindsvater, Cheri McCarty, Chris Mull, Yvonne Sadovy de Mitcheson,
Glenn Sant, Richard Sherley, Luke Warwick, Tonya Wiley, Henning Winker,
Detailed methods are provided in the online version of this paper and Jamie Sibley Yin. This project was funded by the Shark Conservation
Fund, a philanthropic collaborative pooling expertise and resources to meet
and include the following:
the threats facing the world’s sharks and rays. We thank Georgia Aquarium
and Al Dove for supporting K.B.H. D.A.E. was also supported by Save Our
d KEY RESOURCES TABLE
Seas Foundation, Wildlife Conservation Society, and the Shark Conservation
d RESOURCE AVAILABILITY Fund, and N.K.D. was supported by Natural Science and Engineering Research
B Lead contact Council, Canada and Canada Research Chairs program (see Tables S5 and S6
B Materials availability and Data S2 for more detail). The scientific results and conclusions, as well as
B Data and code availability any views or opinions expressed herein, are those of the author(s) and do not
d EXPERIMENTAL MODEL AND SUBJECT DETAILS necessarily reflect those of institutions or data providers.
d METHOD DETAILS
AUTHOR CONTRIBUTIONS
B Collating information and the assessment process
B Taxonomic scope
N.K.D. and C.A.S. conceived the idea and coordinated the Global Shark
B Geographic scope Trends Project. C.L.R., R.A.P., R.W.J., D.A.E., B.F., C.S.S., W.J.V., J.M.L.,
B Training and application of the IUCN red list categories R.H.L.W., J.K.C., P.C., K.K.B., D.F., N.K.D., and C.A.S. planned and coordi-
and criteria nated workshops and collected the Red List data. C.M.P. and C.H.-T. trained
B Transfer of category and changing status since the first key staff and reviewed the Red List data. K.B.H., D.H.D., G.M.R., and J.C.
collected and quality controlled the map data. C.L.R., B.F., J.K.C., C.S.S.,
assessment
N.K.D., and C.A.S. classified habitat data and collected traits. C.A.S.,
B Assessments of not evaluated species
W.J.V., and N.K.D. collected and analyzed the scientific publication data.
B Generation lengths N.P., R.H.L.W., J.H.M., J.C., C.M.P., and N.K.D. analyzed the Red List and
B Estimating population reduction using time-series map data. N.K.D. and C.A.S. led the writing of the manuscript and all authors
methods contributed critically to the drafting.
B Estimating population reduction using space-for-time
substitution DECLARATION OF INTERESTS
B Attitude to risk and classification of uncertainty
The authors declare no competing interests. Most authors are or have been
B Major threats and species habitat classifications
volunteer members of an International Union for the Conservation of Nature
B Distribution mapping Species Survival Commission Specialist Group.
d QUANTIFICATION AND STATISTICAL ANALYSIS
B Increase in peer-reviewed chondrichthyan science INCLUSION AND DIVERSITY
1970–2020
B Global mapping analysis One or more of the authors of this paper self-identifies as an underrepresented
ethnic minority in science. While citing references scientifically relevant for this
B Biological and ecological trait-based threat modeling
work, we also actively worked to promote gender balance in our reference list.
B Predicting the status of Data Deficient species using The author list of this paper includes contributors from the location where the
trait-based and IUCN methods research was conducted who participated in the data collection, design, anal-
ysis, and/or interpretation of the work.
SUPPLEMENTAL INFORMATION Received: July 26, 2021
Revised: August 23, 2021
Supplemental information can be found online at https://doi.org/10.1016/j. Accepted: August 25, 2021
cub.2021.08.062. Published: September 6, 2021
Current Biology 31, 1–15, November 8, 2021 11Please cite this article in press as: Dulvy et al., Overfishing drives over one-third of all sharks and rays toward a global extinction crisis, Current Biology
(2021), https://doi.org/10.1016/j.cub.2021.08.062
ll
OPEN ACCESS Article
REFERENCES 21. Simpfendorfer, C.A., and Dulvy, N.K. (2017). Bright spots of sustainable
shark fishing. Curr. Biol. 27, R97–R98.
1. Jackson, J.B.C. (1997). Reefs since Columbus. Coral Reefs 16, S23–S32. 22. Friedman, K., Gabriel, S., Abe, O., Adnan Nuruddin, A., Ali, A., Bidin Raja
2. Lotze, H.K., Lenihan, H.S., Bourque, B.J., Bradbury, R.H., Cooke, R.G., Hassan, R., Cadrin, S., Cornish, A., De Meulenaer, T., and Huu Tuan Anh,
Kay, M.C., Kidwell, S.M., Kirby, M.X., Peterson, C.H., and Jackson, L. (2018). Examining the impact of CITES listing of sharks and rays in
J.B.C. (2006). Depletion, degradation, and recovery potential of estuaries Southeast Asian fisheries. Fish Fish. 19, 662–676.
and coastal seas. Science 312, 1806–1809. 23. Lawson, J.M., and Fordham, S.V. (2018). Sharks Ahead: Realizing the
3. Pauly, D., and Zeller, D. (2016). Catch reconstructions reveal that global Potential of the Convention on Migratory Species to Conserve
marine fisheries catches are higher than reported and declining. Nat. Elasmobranchs (Shark Advocates International, The Ocean Foundation).
Commun. 7, 10244. 24. Davidson, L.N.K., Krawchuk, M.A., and Dulvy, N.K. (2016). Why have
4. Lewis, S.L., and Maslin, M.A. (2015). Defining the anthropocene. Nature global shark and ray landings declined: improved management or overf-
519, 171–180. ishing? Fish Fish. 17, 438–458.
5. Barnosky, A.D., Matzke, N., Tomiya, S., Wogan, G.O.U., Swartz, B., 25. Brooks, T.M., Butchart, S.H.M., Cox, N.A., Heath, M., Hilton-Taylor, C.,
Quental, T.B., Marshall, C., McGuire, J.L., Lindsey, E.L., Maguire, K.C., Hoffmann, M., Kingston, N., Rodrı́guez, J.P., Stuart, S.N., and Smart,
et al. (2011). Has the Earth’s sixth mass extinction already arrived? J. (2015). Harnessing biodiversity and conservation knowledge products
Nature 471, 51–57. to track the Aichi Targets and Sustainable Development Goals.
6. Lotze, H.K., and Worm, B. (2009). Historical baselines for large marine Biodiversity (Nepean) 16, 157–174.
animals. Trends Ecol. Evol. 24, 254–262. 26. IUCN Standards and Petitions Subcommittee (2016). Guidelines for us-
7. McCauley, D.J., Pinsky, M.L., Palumbi, S.R., Estes, J.A., Joyce, F.H., and ing the IUCN Red List Categories and Criteria (IUCN Species Survival
Warner, R.R. (2015). Marine defaunation: animal loss in the global ocean. Commission).
Science 347, 1255641. 27. Davidson, L.N.K., and Dulvy, N.K. (2017). Global marine protected areas
8. Maxwell, S.L., Fuller, R.A., Brooks, T.M., and Watson, J.E.M. (2016). to prevent extinctions. Nat. Ecol. Evol. 1, 40.
Biodiversity: the ravages of guns, nets and bulldozers. Nature 536, 28. Derrick, D.H., Cheok, J., and Dulvy, N.K. (2020). Spatially congruent sites
143–145. of importance for global shark and ray biodiversity. PLoS ONE 15,
e0235559.
9. Cinner, J.E., Zamborain-Mason, J., Gurney, G.G., Graham, N.A.J.,
MacNeil, M.A., Hoey, A.S., Mora, C., Ville ger, S., Maire, E., 29. Ebert, D.A., Fowler, S.L., Compagno, L.J., and Dando, M. (2013). Sharks
McClanahan, T.R., et al. (2020). Meeting fisheries, ecosystem function, of the World: A Fully Illustrated Guide (Wild Nature Press).
and biodiversity goals in a human-dominated world. Science 368, ret, B., White, W., Stehmann, M., and de Carvalho,
30. Last, P., Naylor, G., Se
307–311. M. (2016). Rays of the World (CSIRO Publishing).
10. MacNeil, M.A., Graham, N.A., Cinner, J.E., Wilson, S.K., Williams, I.D., 31. Kindsvater, H.K., Mull, C.G., Pardo, S.A., Pacoureau, N., and Dulvy, N.K.
Maina, J., Newman, S., Friedlander, A.M., Jupiter, S., Polunin, N.V., (2020). Sharkipedia: Elasmobranch Traits and Trends Global Database.
and McClanahan, T.R. (2015). Recovery potential of the world’s coral https://www.sharkipedia.org/.
reef fishes. Nature 520, 341–344.
32. Pacoureau, N., Rigby, C.L., Kyne, P.M., Sherley, R.B., Winker, H.,
11. Hilborn, R., Amoroso, R.O., Anderson, C.M., Baum, J.K., Branch, T.A., Carlson, J.K., Fordham, S.V., Barreto, R., Fernando, D., Francis, M.P.,
Costello, C., de Moor, C.L., Faraj, A., Hively, D., Jensen, O.P., et al. et al. (2021). Half a century of global decline in oceanic sharks and
(2020). Effective fisheries management instrumental in improving fish rays. Nature 589, 567–571.
stock status. Proc. Natl. Acad. Sci. USA 117, 2218–2224.
33. Sherley, R.B., Winker, H., Rigby, C.L., Kyne, P.M., Pacoureau, N.,
12. Costello, C., Ovando, D., Hilborn, R., Gaines, S.D., Deschenes, O., and Carlson, J.K., Pollom, R., Yin, J.S., Kindsvater, H.K., and Dulvy, N.K.
Lester, S.E. (2012). Status and solutions for the world’s unassessed fish- (2019). Estimating IUCN Red List population reduction: JARA – a deci-
eries. Science 338, 517–520. sion-support tool applied to pelagic sharks. Con. Letts. 20, e12688.
13. Stein, R.W., Mull, C.G., Kuhn, T.S., Aschliman, N.C., Davidson, L.N.K., 34. Winker, H., Pacoureau, N., and Sherley, R.B. (2020). JARA: ‘just another
Joy, J.B., Smith, G.J., Dulvy, N.K., and Mooers, A.Ø. (2018). Global prior- Red list assessment’. bioRxiv. https://doi.org/10.1101/672899.
ities for conserving the evolutionary history of sharks, rays and chi- 35. MacNeil, M.A., Chapman, D.D., Heupel, M., Simpfendorfer, C.A.,
maeras. Nat. Ecol. Evol. 2, 288–298. Heithaus, M., Meekan, M., Harvey, E., Goetze, J., Kiszka, J., Bond,
14. Cappetta, H. (1987). Extinctions and faunic renewals on post-Jurassic M.E., et al. (2020). Global status and conservation potential of reef
Selachians. Mem. Soc. Geol. Fr. 150, 113–131. sharks. Nature 583, 801–806.
15. Sibert, E.C., and Rubin, L.D. (2021). An early Miocene extinction in 36. Finucci, B., and Kyne, P.M. (2018). Dipturus innominatus (The IUCN Red
pelagic sharks. Science 372, 1105–1107. List of Threatened Species).
16. Heithaus, M.R., Wirsing, A.J., and Dill, L.M. (2012). The ecological impor- 37. Kulka, D.W., Anderson, B., Cotton, C.F., Derrick, D., Pacoureau, N., and
tance of intact top-predator populations: a synthesis of 15 years of Dulvy, N.K. (2020). Dipturus laevis (The IUCN Red List of Threatened
research in a seagrass ecosystem. Mar. Freshw. Res. 63, 1039–1050. Species).
17. Ferretti, F., Worm, B., Britten, G.L., Heithaus, M.R., and Lotze, H.K. 38. Kulka, D.W., Anderson, B., Cotton, C.F., Derrick, D., Pacoureau, N., and
(2010). Patterns and ecosystem consequences of shark declines in the Dulvy, N.K. (2020). Malacoraja senta (IUCN Red List of Threatened
ocean. Ecol. Lett. 13, 1055–1071. Species).
18. Dulvy, N.K., Fowler, S.L., Musick, J.A., Cavanagh, R.D., Kyne, P.M., 39. Akçakaya, H.R., Keith, D.A., Burgman, M., Butchart, S.H.M., Hoffmann,
Harrison, L.R., Carlson, J.K., Davidson, L.N.K., Fordham, S.V., Francis, M., Regan, H.M., Harrison, I., and Boakes, E. (2017). Inferring extinctions
M.P., et al. (2014). Extinction risk and conservation of the world’s sharks III: a cost-benefit framework for listing extinct species. Biol. Conserv.
and rays. eLife 3, e00590. 214, 336–342.
19. Vincent, A.C.J., Sadovy de Mitcheson, Y.J., Fowler, S.L., and Lieberman, 40. Standards, I.U.C.N.; Petitions Subcommittee (2019). Guidelines for Using
S. (2014). The role of CITES in the conservation of marine fishes subject the IUCN Red List Categories and Criteria (Standards and Petitions
to international trade. Fish Fish. 15, 563–592. Subcommittee, IUCN Species Survival Commission).
20. Oliver, S., Braccini, M., Newman, S.J., and Harvey, E.S. (2015). Global 41. Dulvy, N.K., Kyne, P.M., Finucci, B., and White, W.T. (2020).
patterns in the bycatch of sharks and rays. Mar. Policy 54, 86–97. Carcharhinus obsoletus (The IUCN Red List of Threatened Species).
12 Current Biology 31, 1–15, November 8, 2021You can also read