OUTLOOK 2021 UPDATE ASIAN DEVELOPMENT - Theme Chapter: Transforming Agriculture in Asia - Asian ...
←
→
Page content transcription
If your browser does not render page correctly, please read the page content below

ASIAN DEVELOPMENT
 OUTLOOK 2021
 UPDATE
  Theme Chapter: Transforming Agriculture in Asia
  SEPTEMBER 2021

ASIAN DEVELOPMENT BANK


Transforming
agriculture in Asia
In the last 50 years, agriculture has played a critical role in Asia
and the Pacific’s development and structural transformation.
In the 1960s, most economies in the region were low-income,
primarily agrarian, and struggling to feed their growing
populations. The green revolution technologies that were adopted
from the 1960s onward led to a sharp rise in yields and incomes,
and helped to greatly reduce hunger and malnutrition in the
region (ADB 2020a). By raising agricultural productivity, it also
freed up labor, which enabled the rapid structural transformation
of many economies and facilitated the emergence of the region’s
vibrant manufacturing and services sectors.
     Even today, Asian agriculture is crucial to the region’s
development. One-third of developing Asia’s workers are
still employed in agriculture. But the sector is beset by low
productivity and incomes. As a result, an estimated four of five
people living below the international poverty line live in rural
areas. This means that raising productivity in the sector is critical
to making further inroads into poverty reduction and advancing
the region’s economic transformation. Agriculture also plays a
central role in safeguarding the region’s food supply and achieving
the second Sustainable Development Goal of ending hunger,
achieving food security and improved nutrition, and promoting
sustainable agriculture.
     But agriculture in developing Asia faces challenges from
three ongoing shifts—in consumer demand, demographics,
and a changing and fragile environment. As Asian economies
become richer and more urbanized, food demand is increasing
and shifting in composition, including toward animal products
that are much more resource intensive. And despite the region’s
growing prosperity, malnourishment persists in various forms.
Meanwhile, agricultural production is challenged by rural
populations that are shrinking, as many people migrate to cities,
leaving older workers and women on the farm. And agriculture is
exposed to risks from a changing climate and from farm practices
that are not environmentally sustainable.

This chapter was written by Takashi Yamano (lead), Manisha Pradhananga (co-lead),
Jindra Samson, Ruth Francisco, Reneli Gloria, and Daryll Naval. It draws on the
background papers listed at the end of the chapter. Inputs from Shingo Kimura and
Aiko Kikkawa Takenaka are gratefully acknowledged. Other contributions are listed
in the Acknowledgments section.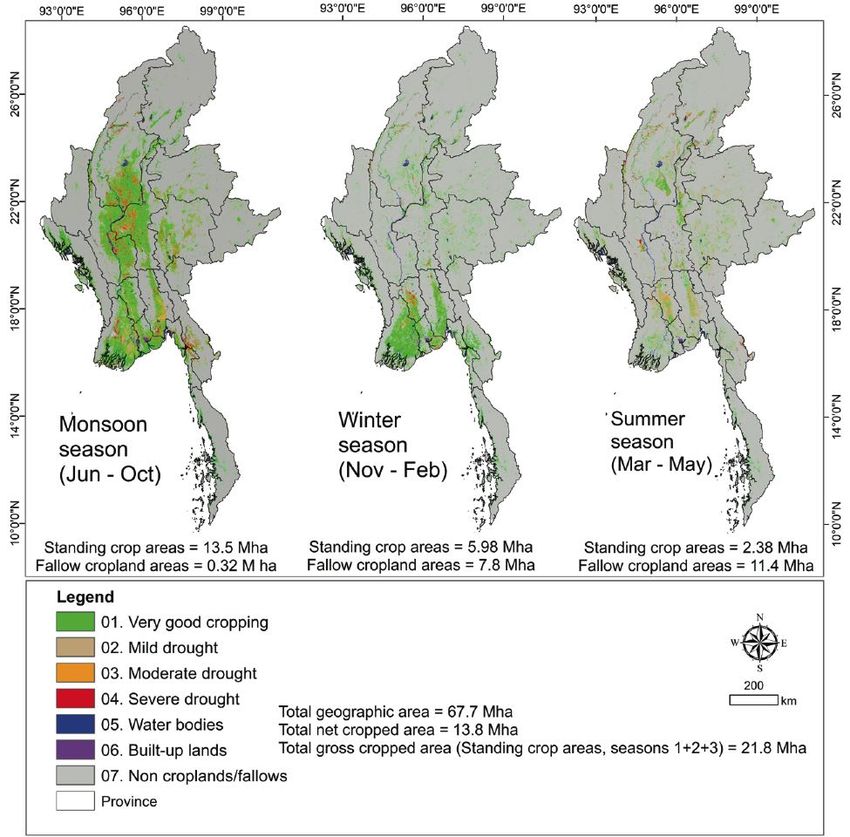
4   Asian Development Outlook 2021 Update

     This chapter takes stock of the various challenges currently
facing agriculture in developing Asia and examines possible
solutions. The next section lays out the challenges in detail.
Some challenges like changing consumer demand come from
outside the sector; others such as unsustainable farming
practices come from within. Many of the challenges and their
possible solutions are interrelated. For example, one response to
consumers’ increased demand for seafood products—increased
aquaculture production—comes with environmental challenges
of its own. And some solutions, such as diversification into
high-value crops, address more than one challenge. It is thus
not easy to compartmentalize the various ways that policy makers
and the private sector can respond. This chapter categorizes
solutions into two groups, although the split is by no means
clean. Section 2.2 lays out solutions whose impact is primarily
at the place of production itself. These include innovations that
help smallholder farmers benefit from greater mechanization;
practices like organic farming and volumetric water pricing
that help farmers produce more without overusing chemicals or
water; and regulations that ensure sustainable agriculture and
aquaculture practices. Section 2.3 then looks at support systems
that help farmers beyond the place of production, some of which
need to be implemented at the macro level. These include early
warning systems and crop insurance schemes; the expansion
of agriculture value chains and use of contract farming; and
the adoption of digital technologies to help farmers and traders
reach new markets. Section 2.4 concludes by discussing how
government policies toward agriculture should focus less on
traditional production support and, instead, encourage market-
oriented innovation.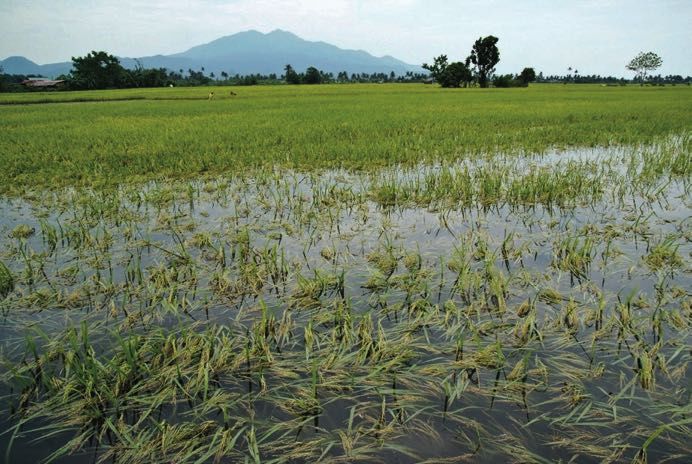
Transforming agriculture in Asia   5

2.1 A
     griculture in Asia
    faces multiple challenges

Agriculture in developing Asia is at a critical juncture, facing
several challenges in its ability to provide nutritious and
diverse food, while ensuring a sustainable and resilient future.
On the consumption side, rising income and urbanization
have shifted food preferences toward meat, fish, eggs, dairy,
fruit, and vegetables. This change in food preference requires
more resource-intensive production, which has implications
for land and water use, as well as for climate change.
Improved access to nutritious food has allowed developing Asia
to make significant progress in the past 2 decades in its fight
against hunger, lifting more than 200 million people from
undernourishment. Despite this progress, undernourishment
persists while the prevalence of obesity is rising in many parts
of the region. On the production side, agriculture in the region
faces multiple challenges. As higher-paying jobs in urban
areas draw out workers, population in rural areas is shrinking
and aging. Extreme weather events, which are increasing
in frequency and intensity, expose many people and vast
agricultural areas in Asia and the Pacific to climate-related
disasters. And overuse of chemical inputs and water threatens
long-term sustainability of agriculture.

2.1.1 Rising incomes and urbanization are
       transforming food consumption
Food consumption in developing Asia continues to grow,
alongside changes in dietary preferences that reflect
rising household income and rapid urbanization.
The region is currently home to more than half of the world
population, which is projected to reach 8.5 billion in 2030.
While a slowdown is forecast for global population growth,
two regions—Africa and South Asia—are expected to persist
in showing significant increases. By 2030, the population
of developing Asia is expected to reach 4.3 billion, while
gross domestic product (GDP) per capita is forecast to reach
$14,000 in purchasing power parity terms, more than double
its value in 2015 (ADB 2019a). The number of people living
in urban areas in developing Asia increased from 375 million
in 1970 to 1.84 billion in 2017. By 2030, some 55% of the
population in the region will dwell in urban areas (ADB 2019a).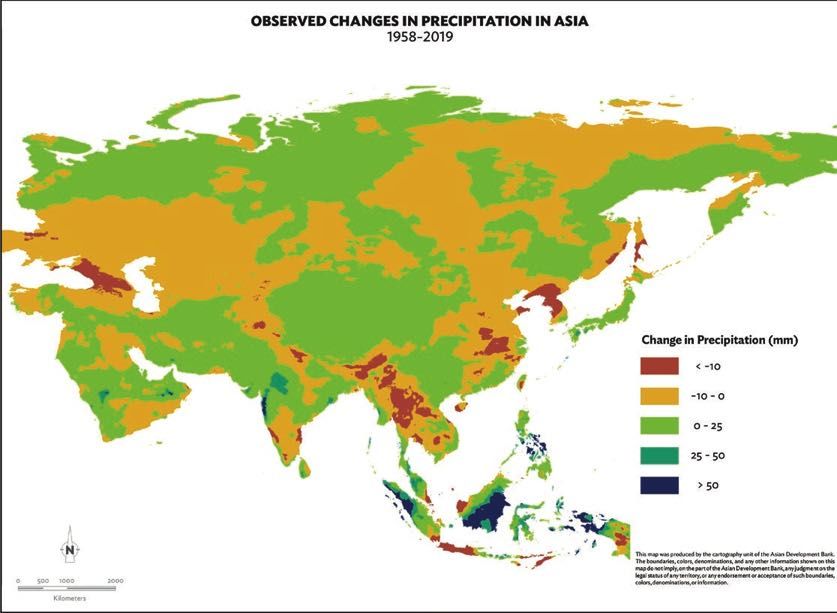
6       Asian Development Outlook 2021 Update

These demographic changes are expected to increase food
demand and shift food preferences away from food staples
toward more diverse diets with higher shares of animal-
sourced meat, seafood, eggs, and dairy products, as well as
more fruit and vegetables.
    Caloric intake in developing Asia has been increasing
quickly but remains below that of high-income economies.
The increase in income has helped developing economies
put more food on the table and reach or even surpass the
recommended daily dietary intake of 2,000 kilocalories (kCal)
in 1961 to 3,206 kCal in 2018 (Figure 2.1.1a).
    Meat consumption in the region is increasing but remains
significantly lower than in advanced economies outside of Asia.
In 2018, protein intake in developing Asia from meat stood at
10.0 grams per capita per day, and in Japan at 17.3 grams, both
well below the 34.6 grams average in advanced economies
outside of the region. In the People’s Republic of China (PRC),
daily protein intake per capita from meat increased almost
twentyfold from 1.1 grams in 1961 to 19.7 grams in 2018.
In India, meanwhile, meat consumption was stagnant at
1.4 grams over the same period, despite a sixfold increase in
income (Figure 2.1.1b).

Figure 2.1.1 Income and food preference
Rising income levels in Asia and the Pacific have been accompanied by higher caloric intake and higher consumption of meat and seafood.

    IND                             SAM
    KAZ                             JPN
    NEP                             ROK
    PHI                             Advanced economies outside of Asia
    PRC

 a. Total dietary calories
                                                                                                                                            ROK
Kilocalories per capita per day                                     PRC                                                                     2011
                                          SAM                       2018
3,250                                                                                     KAZ
                                          2017                                            2018
            NEP
            2018
                                                                                                                             Advanced economies
                                                                                                                                   1972
2,750                                                KAZ
                                                     1999
                                        PHI                                                                                                JPN
                                       2018                                                                                                1977
                                                                                JPN
                              IND                                               1961
                              2018
2,250
                             ROK
                             1961
                      IND
                      1976
1,750
                      PHI
                     1962

              PRC
              1961
1,250
        0                         4,000                     8,000                      12,000                    16,000      20,000                 24,000
                                                                    GDP per capita in constant 2010 US dollars
                                                                                                                                      continued on next page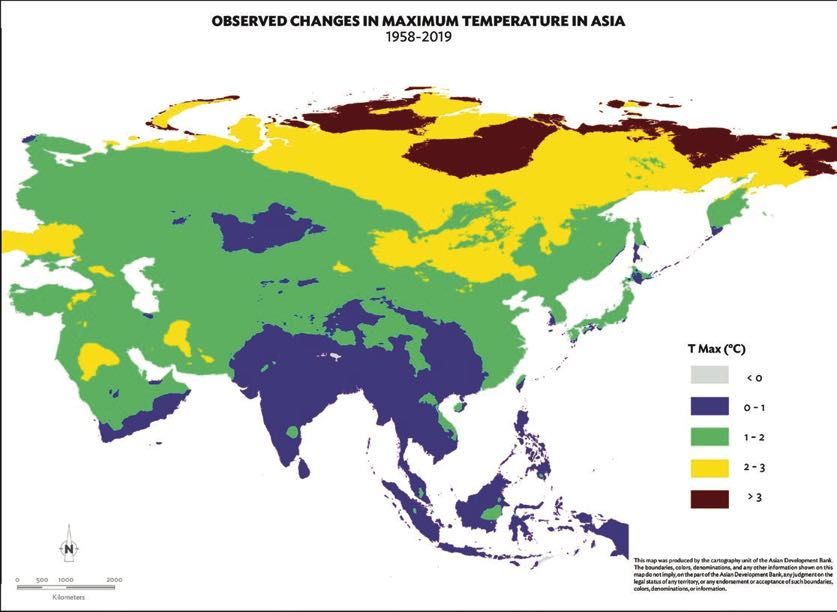
Transforming agriculture in Asia                    7

Figure 2.1.1 Continued

 b. Animal meata

Grams per capita per day
40

35                                                                                                                                     Advanced
                                                                                                                                       economies
                                          SAM                                                                                            1972
                                          2018
30

25
                                                                                 KAZ
                                                                                 2018
                               SAM                                                                                                                         ROK
20                             1973                     PRC                                                                                                2011
                                                        2018

15
         PRC                                  KAZ
         1961                PHI              1999
10                          2018

                                                                          JPN
                                                                          1961                                                                  JPN
 5                                                                                                                                              1977
            IND, 1961
                                 IND, 2018
 0
     0                         4,000                 8,000                       12,000                     16,000               20,000                    24,000
                                                               GDP per capita in constant 2010 US dollars

 c. Seafoodb

Grams per capita per day                                                                                                                               JPN
                                                                                                                                                       1977
25

20

                                                        JPN
                                                        1961
          SAM                          SAM
15        1982                         2018                                                                                                         ROK
                                                                                                                                                    2011

10
                                                        PRC
          PHI                                           2018
         1962
                                PHI
                               2018
 5
                        IND
                        2018           KAZ                                        KAZ                                                      Advanced
                                       1999                                       2018                                                     economies
                                                                                                                                             1972
                NEP, 2018
 0
     0                         4,000                 8,000                       12,000                     16,000                20,000                   24,000
                                                               GDP per capita in constant 2010 US dollars

GDP = gross domestic product, IND = India, JPN = Japan, KAZ = Kazakhstan, NEP = Nepal, PHI = Philippines, PRC = People’s Republic of China, ROK = Republic of
Korea, SAM = Samoa.
Notes: Consumption per capita is deduced from country average consumption as derived from FAOSTAT food balance sheets. Advanced economies outside of
Asia and the Pacific are Australia, Austria, Canada, Denmark, Finland, France, Germany, Ireland, the Netherlands, Norway, Sweden, the United Kingdom, and the
United States.
a
  Animal meat comes from pigs, sheep, goats, poultry, and other land livestock.
b
  Seafood fish includes freshwater fish, demersal fish, pelagic fish, marine fish, crustaceans, cephalopods, and mollusks.
Sources: Dietary calories from FAO. FAOSTAT Food Balance Sheets. http://www.fao.org/faostat/en/#data/FBS (accessed 12 April 2021); GDP per capita from
World Bank. World Development Indicators. https://databank.worldbank.org/source/world-development-indicators (accessed 12 April 2021).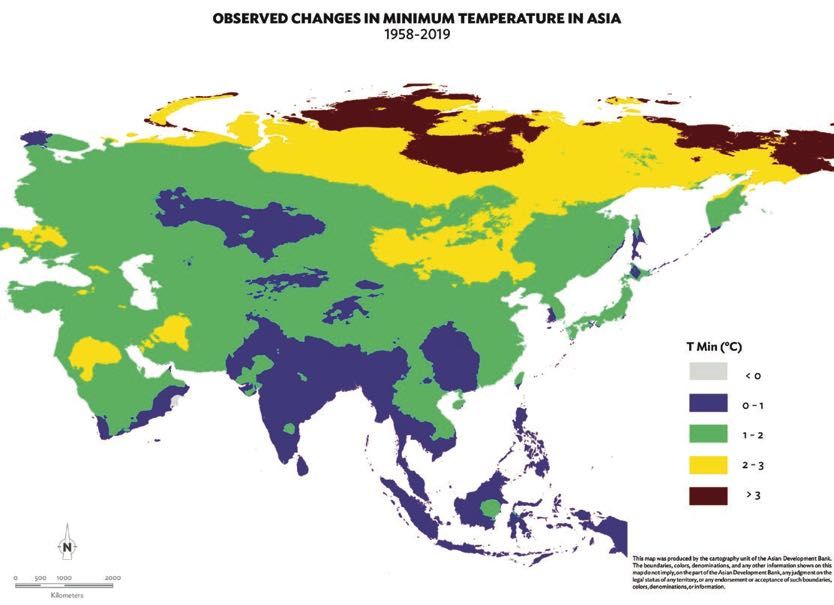
8        Asian Development Outlook 2021 Update

     In contrast, daily protein intake from fish in
developing Asia slightly has surpassed the average in
advanced economies outside of the region. Fish consumption
is increasing in India, but not as quickly as elsewhere in the
region (Figure 2.1.1c). Aquaculture in Asia has responded to
the increase in fish demand and has witnessed rapid growth.
Asia now accounts for 88% of world aquaculture production.
     These trends are expected to continue in the future, with
daily energy supply from food intake expected to increase
until 2030 in all regions (FAO 2018a).1 High-income economies
will reach saturation at 3,400 kCal/day early, beyond which no
further food consumption is regarded as necessary or desirable,
while low-income economies will reach 2,860 kCal/day by
2030. In developing Asia, daily energy consumption per capita
is expected to reach 2,844 kCal by 2030. Over the same
period, the share of cereals in food intake will decrease by
2.7 percentage points, while the share of animal products will
increase by 1.0 percentage point, and of fruit and vegetables by
0.5 percentage point. Figure 2.1.2 shows that these trends are
more pronounced in East and Southeast Asia.

Figure 2.1.2 D
              ifference in daily energy supply by food group,
             from 2012 to 2030
Asian consumption is shifting away from cereals toward animal products, fruit, and vegetables.

        Cereals
        Animal products
        Fruit and vegetables
        Vegetable oil
        Other food

Difference, percentage points
    6                                                                                                0.5
               0.5                                                               0.5
    4                                                     0.3                                      0.2
               1.4                  0.7                     0.5              0.3
    2                               0.7                       0.6                           1.0
               2.5                  1.6                                0.8
    0                                                                                       1.0
                                                   –1.4               –1.6
–2                                 –3.3                                                     –2.7
              –4.7
–4

–6
            East Asia          Southeast Asia   Central Asia        South Asia         Developing Asia
Note: East Asia is represented by Mongolia and the People’s Republic of China; Central Asia by
Armenia, Azerbaijan, Georgia, Kazakhstan, the Kyrgyz Republic, Tajikistan, Turkmenistan, and
Uzbekistan; South Asia by Afghanistan, Bangladesh, India, Nepal, Pakistan, and Sri Lanka; and
Southeast Asia by Cambodia, Indonesia, the Lao People’s Democratic Republic, Malaysia, Myanmar,
the Philippines, Thailand, and Viet Nam.
Source: ADB estimates using data from FAO. 2018. The Future of Food and Agriculture—Alternative
Pathways to 2050. Food and Agriculture Organization of the United Nations.

1
        Estimates assume a business-as-usual scenario in which the global
        community fails to address many challenges of food access and
        sustainable food production.
Transforming agriculture in Asia                          9

    This shift in food preference away from staples toward
animal‑based products requires more resource-intensive production.
As shown in Figure 2.1.3a, animal-based products consume
more resources and produce higher emissions than plant‑based
products. This has significant implications for the environment.

Figure 2.1.3 Resource use and environmental impacts from plant-based versus animal-based products
Animal-based products consume more land and water resources than do plant-based products, and they generate more greenhouse gas emissions.

         Cropland
         Water use
         Greenhouse gas emissions

 a. Per million kilocalories consumed

Hectares of land or 1,000 cubic meters of water                                                                                            Tons of carbon dioxide equivalent
12                                                                                                                                                                      250

10                                         Plant-based                                                                      Animal-based                                200
 8
                                                                                                                                                                        150
 6
                                                                                                                                                                        100
 4

 2                                                                                                                                                                       50

 0                                                                                                                                                                         0
          Sugar Roots and Maize     Palm oil     Wheat      Rice   Soybean     Fruits   Pulses     Pork     Eggs     Fish      Poultry     Dairy    Sheep     Beef
                 tubers                                               oil       and                                                                and goat
                                                                             vegetables
Notes: Data presented are global means. Plant entries are ordered left to right by the amount of land used. Indicators for animal-based foods include resources used
to produce feed, including pasture. Tons of harvested products were converted to quantities of calories and protein using the global average edible calorie and protein
contents of food types. Fish include all aquatic animal products. Freshwater use for farmed fish products is shown as rainwater and irrigation combined. Estimates of
land use and greenhouse gas emissions are based on marginal analysis, calculating additional agricultural land use and emissions per additional million calories or tons
of protein consumed. In line with the approach taken by the European Union for estimating emissions from land-use change for biofuels, land-use change impacts are
amortized over a period of 20 years and then shown as annual impacts. Land use and greenhouse gas emission estimates for beef production are based on dedicated
beef production, not beef that is a coproduct of dairy. Dairy figures are lower in GlobAgri than some other models because GlobAgri assumes that beef produced by
dairy systems displaces beef produced by dedicated beef-production systems.
Source: T. Searchinger et al. 2019. World Resources Report: Creating a Sustainable Food Future (Final Report). World Resources Institute.

 b. Average per capita consumption in developing Asia

Square meters of land or cubic meters of water                                                                                             Tons of carbon dioxide equivalent
350                                                                                                                                                                     1.8
                                          Plant-based                                                                      Animal-based                                 1.6
300
                                                                                                                                                                        1.4
250
                                                                                                                                                                        1.2
200                                                                                                                                                                     1.0
150                                                                                                                                                                     0.8
                                                                                                                                                                        0.6
100
                                                                                                                                                                        0.4
 50                                                                                                                                                                     0.2
     0                                                                                                                                                                  0.0
            Sugar   Roots and Maize     Wheat        Rice     Soybean     Fruits   Pulses        Pork     Eggs      Fish      Poultry     Dairy     Sheep      Beef
                     tubers                                      oil       and                                                                     and goat
                                                                        vegetables
Notes: The figure was created by multiplying data on global means for cropland use, water use, and greenhouse gas emissions by data on average daily consumption
per capita in developing Asia. The resulting product was then multiplied by 365 days to yield annual data. See Searchinger et al. (2019) for more information about the
assumptions used to generate the original calculations. Consumption is deduced from country average consumption as derived from FAOSTAT food balance sheets.
The countries covered are Afghanistan, Armenia, Azerbaijan, Bangladesh, Cambodia, the People’s Republic of China, Fiji, Georgia, India, Indonesia, Kazakhstan, the
Kyrgyz Republic, the Lao People’s Democratic Republic, Malaysia, Maldives, Mongolia, Myanmar, Nepal, Pakistan, the Philippines, Samoa, Solomon Islands, Sri Lanka,
Tajikistan, Thailand, Uzbekistan, Vanuatu, and Viet Nam.
Sources: Cropland use, water use, and greenhouse gas emissions from T. Searchinger et al. 2019. Creating a Sustainable Food Future (Final Report). World Resources
Institute; dietary consumption from FAO. FAOSTAT Food Balance. http://www.fao.org/faostat/en/#data/FBS (accessed 12 August 2021).
10     Asian Development Outlook 2021 Update

Beef generates the most greenhouse gas (GHG) emissions
per million kilocalories consumed, at 226.5 tons of carbon
dioxide equivalent (tCO2e), and has the biggest water
footprint, at 9,850 cubic meters (m3), compared with plant-
based GHG emissions at 7 tCO2e and water use at 1,300 m3.
A slightly different picture emerges from calculating resource
use and environmental impacts based on current average
consumption per capita in developing Asia (Figure 2.1.3b).
Beef still dominates in terms of GHG emissions, at 1.67 tCO2e
per capita, followed by dairy at 1.2 tCO2e. However, higher
average consumption of rice per capita in the region makes
GHG emissions per capita from rice significant at 0.68 tCO2e.
Rice and wheat also use a lot of water per capita, closely
following fish. In terms of land footprint, pork has the highest
utilization per capita, at 297 m 2, followed by wheat and rice.
    It is important to move toward sustainable and healthy
diets that are also socially acceptable and economically
accessible for all. Searchinger et al. (2019) estimate that a
30% shift from meat derived from ruminants such as cows,
sheep, and goats, to plant-based proteins by 2050 could close
half of the GHG mitigation gap and nearly all of the combined
land-use gap.2 Some ways to achieve this are to promote mostly
plant-based diets, reduce red meat consumption, promote fish
obtained from sustainable stocks, and reduce food loss and
waste throughout the supply chain.
    Reducing food loss and waste provides another way
to reduce the environmental impact. 3 Food loss and waste
contribute 8% of annual GHG emissions and consume a
quarter of all water used in agriculture (World Resources
Institute 2019). The Food and Agriculture Organization of
the United Nations (FAO) food loss index for 2019 showed
14% of the world’s food lost in postharvest and wholesale.
A further 17% of global food production, 931 million tons,
is wasted further down the supply chain (UNEP 2021).
Households are the primary wasters of food at 61%, followed
by food service at 26% and retail at 13%. According to some
estimates, the COVID-19 pandemic has worsened consumer
food waste by 12% (Aldaco et al. 2020).

2
     Land-use gap is the difference between the projected area of land
     needed to produce all the food the world will need at a specified future
     time and the amount of agricultural land in use in a given reference year.
     The GHG mitigation gap is the difference between agriculture-related
     GHG emissions projected at a specified future time and a target for
     emissions from agriculture and related land-use change for that future
     time that is deemed necessary to arrest global warming at an acceptable
     temperature difference.
3
     Food loss is the quantity or quality diminished because of decisions and
     actions in postharvest and food wholesaling, and food waste in food
     retailing, food service provision, and consumption.
Transforming agriculture in Asia 11
2.1.2 D
espite the region’s growing prosperity,
malnourishment persists
In the past 2 decades, developing Asia has made significant
progress in its fight against hunger, lifting more than 200 million
people from undernourishment. Table 2.1.1 shows that, from 2001
to 2019, the prevalence of undernourishment in the region fell
steadily from 15.3% to 8.7% (FAO 2021a).4 Similarly, the region
has reduced the prevalence of stunting in children under 5 years
from 38.7% in 2000 to 23.2% in 2020.5 East Asia achieved the
steepest reduction, pushing the prevalence of stunting down to
4.6%, and Central Asia followed at 10.4%.
Table 2.1.1 Malnutrition in Developing Asia
Developing Asia has made progress against its fight against malnutrition, but significant challenges remain.
Prevalence Prevalence of
Number of Prevalence of Prevalence of of Wasting in Obesity in Children
Undernourished Undernourishment Stunting in Children Children under and Adolescents
(million) (%) under 5 Years (%) 5 Years (%) 5–19 Years (%)
Subregion 2001 2019 2001 2019 2000 2020 2019 2000 2016
Central Asia 9.1 1.1 13.9 3.3 27.7 10.4 2.8 1.8 4.6
East Asia 134.1 0.9 9.7 2.5 19.5 4.6 1.9 2.2 11.6
South Asia 269.0 264.9 19.0 14.5 49.4 31.8 15.4 0.4 2.2
Southeast Asia 106.3 46.7 20.1 7.1 38.0 27.4 9.1 1.5 5.7
The Pacific 2.1 2.7 22.0 21.6 36.3 42.1 4.2 3.9 10.2
Developing Asia 520.6 316.3 15.3 8.7 38.7 23.2 10.3 1.2 5.4
World 817.8 650.3 13.1 8.4 33.1 22.0 6.8 2.9 6.7
Note: Small samples in the Pacific mean that stunting figures for this subregion should be viewed with caution.
Sources: For prevalence of undernourishment and the number of undernourished from FAO. FAOSTAT Suite of Food Security Indicators. http://www.fao.org/
faostat/en/#data/FS (accessed 10 August 2021); for prevalence of obesity in children and adolescents from WHO. The Global Health Observatory.
https://www.who.int/data/gho/data/indicators (accessed 10 August 2021); for prevalence of stunting and wasting from UNICEF, WHO, and World Bank. 2021.
Joint Child Malnutrition Estimates. https://data.unicef.org/topic/nutrition/malnutrition (accessed 12 July 2021).
Despite this progress, the number of children in the
region under age 5 who still suffer stunting remained
significant at 74.7 million in 2020. South Asia accounted for
a majority of them at 53.8 million followed by Southeast Asia
at 15.3 million. In the past, child stunting was more prevalent
in rural areas. With a rise in urban poverty, however,
child stunting is no longer just a rural phenomenon.
4
Hunger is caused by insufficient consumption of dietary energy. It becomes
chronic when a person does not consume sufficient calories regularly
to have a normal, active, and healthy life. FAO uses the prevalence of
undernourishment as an indicator to monitor hunger globally and regionally.
5
Stunting is defined as low height-for-age. It is a result of chronic or recurrent
undernutrition, usually associated with poverty, poor maternal health and
nutrition, frequent illness, and/or inappropriate feeding and care in early life.12 Asian Development Outlook 2021 Update
Figure 2.1.4 Stunting among children under 5 years in developing Asia, 2019
Child stunting persists in developing Asia, as more than half of the countries in the region still suffer prevalence above 20%, with significant shares in
both rural areas and urban centers.
Rural
Urban
Total
%
60
50
40
30
20
10
–
Timor-Leste
Afghanistan
Pakistan
Papua New Guinea
Marshall Islands
India
Lao PDR
Cambodia
Solomon Islands
Nepal
Indonesia
Philippines
Vanuatu
Bangladesh
Myanmar
Viet Nam
Malaysia
Azerbaijan
Tajikistan
Sri Lanka
Maldives
Kiribati
Thailand
Kyrgyz Republic
Uzbekistan
Mongolia
Armenia
Kazakhstan
Samoa
Turkmenistan
Georgia
PRC
Tonga
Lao PDR = Lao People’s Democratic Republic, PRC = People’s Republic of China.
Notes: Stunting is defined as low height for age, affecting those falling 2 standard deviations or more below the median in the child growth standards of the
World Health Organization. Stunting figures here are the latest year available from 2013 to 2019. Urban–rural stunting estimates are based on an earlier year
than overall stunting prevalence where the latest estimate does not disaggregate urban–rural: in Malaysia 2016 for urban–rural, 2019 for stunting overall,
and in the PRC 2013 for urban–rural, 2017 for stunting overall. Papua New Guinea, the Philippines, and Viet Nam lack disaggregated urban–rural stunting
estimates.
Sources: UNICEF, WHO, and World Bank. 2021. UNICEF-WHO-World Bank Joint Child Malnutrition Estimates. United Nations Children’s Fund, World Health
Organization, and World Bank; UNICEF. 2021. Malnutrition in Children. https://data.unicef.org/topic/nutrition/malnutrition/ (accessed 7 May 2021).
Figure 2.1.4 shows that more than half of the economies in
developing Asia still suffered stunting prevalence above 20%
in 2019, with significant shares of stunted children in both
rural areas and urban centers.
Child wasting is another condition of undernutrition that
can cause prolonged illness and higher risk of death when left
untreated. Wasting is defined as low weight for height and
occurs when a child has not had food of adequate quality and
quantity. In developing Asia, child wasting prevalence in 2019
was 10.3%, much higher than the world average of 6.8% and the
Sustainable Development Goal target of less than 5% by 2025.
Progress has been slow and mixed. Laggard subregions in
meeting this target are South Asia at 15.4% and Southeast Asia
at 9.1%, while Central Asia has reduced child wasting to 2.8%
and East Asia to 1.9%.Transforming agriculture in Asia 13
Figure 2.1.5 Prevalence of anemia in children under 5 and women aged 15–49, 2000 and 2019
The prevalence of anemia among women and children remains high, especially in South Asia.
Women 2000
Women 2019
Children 2000
Children 2019
Prevalence of anemia, %
70
60
50
40
30
20
10
0
South Asia Central Asia The Pacific Southeast Asia East Asia Developing Asia World
Sources: Data on country prevalence from the World Health Organization. The Global Health Observatory. https://www.who.int/data/gho/data/
indicators (accessed 12 August 2021); for population weighting, United Nations. 2019 Revision of World Population Prospects. https://population.
un.org/wpp/ (accessed 31 August 2021).
Developing Asia has made some progress in reducing the
prevalence of anemia, though rates are still high. Iron deficiency
is the most common micronutrient deficiency in the world,
affecting 570.8 million women aged 15–49 and 269.4 million
children under the age of 5 (WHO 2021). As its health impacts are
not always visible, micronutrient deficiency is sometimes called
“hidden hunger” and may persist even in economies that have
achieved high calorie intake per capita. Figure 2.1.5 shows that the
prevalence of anemia among children under 5 is still high at 51.7%
in South Asia and 44.8% in the Pacific. More than one in three
women in the region aged 15–49 faces anemia, with the prevalence
in South Asia stubbornly high at 49.4%. Poor maternal nutrition
has direct and lasting effects on child development, as chronic
malnutrition in early childhood can affect physical and cognitive
development (Grantham-McGregor et al. 2007). This can reduce
an individual’s potential for economic productivity and, in the
long run, diminish the quality of human capital (Hickson and
Julian 2018; Madjdian et al. 2018).
The prevalence of obesity is a growing problem in
the region. In 2016, over 163 million adults in developing Asia
were obese, almost 3.2 times higher than in 2000. Adult obesity
prevalence averages 5.8% in the whole region but reaches 23.5%
in the Pacific and 18.3% in Central Asia. Obesity can cause
noncommunicable diseases such as diabetes and cardiovascular
diseases. Ten Pacific economies have rates of adult obesity
among the highest in the world, and the Pacific has 4 of the 10
economies in the world with the highest prevalence of diabetes
among those aged 20–79 (International Diabetes Federation 2019).14 Asian Development Outlook 2021 Update
Figure 2.1.6 Obesity in children 5–19 years old and GDP per capita, 2016
The prevalence of obesity among children and adolescents is high in several Pacific countries.
Pacific island economies
Other developing Asian economies
Regional and global averages
Prevalence of obesity in children 5–19 years old
35
NAU
COO
PAL
30
TUV
TON
RMI
25
KIR SAM
20 FSM
15
BRU
FIJ MAL
PRC
10 PNG THA LAC
MAL ROK
VAN Dev Asia SIN
KAZ
5 SOL
World
SSA AZE
IND
0
6.00 6.50 7.00 7.50 8.00 8.50 9.00 9.50 10.00 10.50 11.00
Natural log of GDP per capita in constant 2015 US dollars
AZE = Azerbaijan, BRU = Brunei Darussalam, COO = Cook Islands, FIJ = Fiji, FSM = Federated States of Micronesia, GDP = gross domestic product, IND = India,
KAZ = Kazakhstan, KIR = Kiribati, LAC = Latin America and the Caribbean, MAL = Malaysia, NAU = Nauru, PAL = Palau, PNG = Papua New Guinea, PRC = People’s
Republic of China, RMI = Marshall Islands, ROK = Republic of Korea, SAM = Samoa, SIN = Singapore, SOL = Solomon Islands, SSA = Sub-Saharan Africa,
THA = Thailand, TON = Tonga, TUV = Tuvalu, VAN = Vanuatu.
Note: Computation of regional, developing Asia, and world GDP per capita averages includes only countries with data on obesity prevalence for children and
adolescents aged 5–19 years.
Sources: For country obesity prevalence, World Health Organization. The Global Health Observatory. https://www.who.int/data/gho/data/indicators (accessed
10 August 2021); for population 5–19 years old, UN DESA. World Population Prospects 2019. https://population.un.org/wpp/Download/Standard/Interpolated
(accessed 10 August 2021); for constant 2015 US dollars, United Nations. UNdata. http://data.un.org/Explorer.aspx (accessed 10 August 2021).
Figure 2.1.6 shows a trend for child obesity. Obesity prevalence
among children and adolescents in the Pacific is at 10.2%, and
in East Asia, at 11.6%, double the regional average of 5.4%.
Though Southeast Asia has lower obesity prevalence at 5.7%,
Brunei Darussalam, Malaysia, and Thailand registered the
largest increases from 2000 to 2016, by about 8 percentage
points. According to WHO (2014), obesity in childhood is linked
to higher risk of incurring noncommunicable diseases in adulthood
such as type 2 diabetes, asthma and other respiratory problems,
high blood pressure, and liver disease, which can cause disability
and premature death.
Increased physical inactivity and consumption of processed
food are contributing to developing Asia’s obesity problem.
While urbanization correlates with economic growth and improved
standards of living, it is also associated with lifestyle changes that
often reduce physical activity and encourage poor food preferences.Transforming agriculture in Asia 15
About 25% of developing Asia’s population is physically inactive,
which is defined as not doing weekly at least 150 minutes of
moderately intense physical activity, 75 minutes of vigorous
activity, or an equivalent combination of the two. Partly because
time-poor urban dwellers work longer hours, they have shifted
to ultra-processed food that is convenient but often higher
in salt, fat, and sugar (Popkin 2001). Poverty and inequality
in urban and peri-urban areas also impede access to healthy
food. In the Pacific, sharp increases in obesity associated with
noncommunicable diseases are attributed to heavy reliance on
imported processed foods high in sugar, salt, and animal fat—
and to increasingly sedentary lifestyles (World Bank 2016).
More importantly, the region has been moving away from the
production of healthy agricultural produce, a development
strongly linked to a lack of arable land (Taylor, McGregor, and
Dawson 2016). Recommendations to reduce the prevalence of
obesity aim to change consumer behavior and promote healthy
diets by imposing mandatory labeling of trans fat, raising taxes
on sugar-sweetened beverages, and restricting the marketing
to children of food high in calories and low in nutrients
(FAO 2021a).
2.1.3 A
sia’s rural communities are rapidly
shrinking, feminizing, and aging
Rapid structural transformation has led to a steady decline in
the share of rural population. A rapid and enormous structural
transformation has characterized Asian development since
the 1970s (ADB 2020a). This has dramatically reduced the
economic share of agriculture in terms of both output and
employment. The decline in agriculture’s share of GDP has
been especially steep in the PRC, where it dropped from 32%
in the 1970s to 7% in 2019, and in India, where the decline
was from 40% to 16%. Although agriculture remains a major
employer in many developing economies in Asia, the overall
share has declined over the years. Higher-paying jobs in
manufacturing and services in urban areas have attracted
workers out of rural areas, causing a steady decline in
the share of the rural population of developing Asia from
80% in 1970 to 52% in 2020. The rural population started
to shrink in the 2000s, despite a steady increase in total
population. The rural share is expected to decline further
to 38% by 2050, and the absolute number to drop below
600 million (Figure 2.1.7). In East Asia, the rural population
share is already below 40% and is expected to sink to less than
25% by 2050. In Southeast Asia, the rural population share is
seen contracting from about 50% in 2021 to below 40% by 2050.
South Asia currently has over 60% of its population in rural
areas, but this share is likewise declining rapidly.16 Asian Development Outlook 2021 Update
Figure 2.1.7 Urban and rural population in developing Asia, 1970–2050
The share of rural population has declined as people moved to cities in search of
better economic opportunities.
Total population
Rural population
Rural share (%)
Billion %
5 100
4 80
Projection
3 60
2 40
1 20
0 0
1970 1980 1990 2000 2010 2020 2030 2040 2050
Source: United Nations. World Urbanization Prospects 2018. https://population.un.org/wup/
Download/ (accessed 18 August 2021).
As the outmigration of male workers continues, Asia’s
agriculture is increasingly reliant on women and elderly
to provide labor. This trend is particularly pronounced in
Bangladesh, Cambodia, and Nepal, three economies with
high labor migration (Figure 2.1.8). Bangladesh saw the
share of female workers in agriculture rise by 9.3 percentage
points from 2010 to 2019, and Nepal by 7.7 points.
Figure 2.1.8 Share of women in agricultural employment, 2010 and 2019
Asian agriculture relies increasingly on women...
2019, %
70
Nepal
60
Cambodia
50 World
Bangladesh Lao PDR
PRC
40 Bhutan
Indonesia
Thailand
30 Myanmar
Philippines
20 India
10
0
0 10 20 30 40 50 60 70
2010, %
Lao PDR = Lao People’s Democratic Republic, PRC = People’s Republic of China.
Source: ADB estimates based on ILO. ILOSTAT. https://ilostat.ilo.org/data/ (accessed 10 August 2021).Transforming agriculture in Asia 17
In Cambodia and the Lao People’s Democratic Republic
(Lao PDR), where male migration is also high, the share of
females employed in agriculture remained above 50% in the
same period. Such aggregated data may not capture changes
in actual work responsibilities and the hours women devote to
agricultural activity. In labor surveys, farm households may
simply list male members as engaged in agriculture and neglect
to report that female family members work their own fields or
tend domestic animals.
Women’s role and degree of involvement in agriculture
vary within and across economies, regions, communities, and
cropping systems. They are guided by norms and formal and
informal rules that define gender roles and the division of labor,
as well as by socioeconomic characteristics such as caste, class,
and ethnicity. In South Asia, men take the lead in seedbed and
land preparation, crop management, machine operation, and
marketing, while women are mainly responsible for postharvest
activities, as well as assisting men with seedbed and nursery
preparation (Ahmed et al. 2013). In Southeast Asia, men similarly
take the lead in seedbed and land preparation, as well as
pesticide and fertilizer application. Aside from postharvest
activities, women in Southeast Asia are likewise involved in
crop establishment, weeding, manual harvesting, and marketing
(Akter et al. 2017; Akter et al. 2016). Women in Southeast Asia
are more visible than their counterparts in South Asia and
exercise more decision-making power and autonomy. Likewise,
compared with women in South Asia, those in Southeast Asia
face less of a gender gap in access to agricultural extension
services and control over farm income and resources (Akter et al.
2017; Akter et al. 2016; Malapit et al. 2020). In Central Asia, the
Kyrgyz Republic and Tajikistan rely heavily on remittances from
international migrants, who are mostly men. One recent study
in Tajikistan found that about half of surveyed rural households
had at least one person working abroad, leaving women to take
up more responsibility for irrigation management and agriculture
production (ADB 2020b). Women in many Asian economies are
also responsible for safeguarding seed stores and traditional
knowledge of seed varieties, including those that are drought
resistant. Women’s active participation in community seed banks
has been vital in preserving biological diversity, which will be
increasingly important under climate change.
Women face discrimination in access to land, capital,
inputs, information, and training. Despite their active role in
agriculture and their invaluable contribution to global food
security, women have limited access to resources, especially
land. Evidence of gender inequality in access to land is
compelling across all developing regions. Most inheritance
systems disadvantage women, who are also vulnerable to loss
of land when their household structure changes, especially
if the husband dies or leaves (FAO 2011; Doss et al. 2018).18 Asian Development Outlook 2021 Update
Ensuring women’s access to land and other resources is
increasingly important in the context of feminization of
agriculture in many Asian economies.
The share of older farmworkers has increased over time,
especially in economies with low birth rates and rapid rural–
urban migration (Figure 2.1.9). In the Republic of Korea, a low
birth rate and rapid rural–urban migration has left almost 70%
of the agricultural workforce aged 60 or older. In Sri Lanka and
Thailand, the share of agricultural workers aged 50 or older
rose from only a third in the mid-2000s to almost half in the
past few years. The average age of farmworkers was 69.8 years
in the Republic of Korea in 2020, 51.0 in Sri Lanka in 2017, and
49.7 in Thailand in 2018. In other economies in Figure 2.1.9,
the average age of farmworkers is over 40. It is noteworthy that
older farmworkers tend to work fewer hours than do workers
in their prime. More than half of agricultural workers in the
selected Asian economies aged 60 or older work less than 40
hours per week.
Figure 2.1.9 Age distribution of agricultural workers
…and on older workers.
60+
50–59
40–49
30–39
15–30
Bangladesh 2016 12.2 23.7
Viet Nam 2016 14.4 20.8
Philippines 2017 14.9 26.3
Indonesia 2017 17.3 17.2
Thailand 2018 20.5 14.7
Sri Lanka 2017 22.5 10.0
Republic of Korea 2020 68.9 1.8
0 20 40 60 80 100
%
Sources: Labor force surveys of various countries.Transforming agriculture in Asia 19
As people age, their physical strength and fitness
deteriorate, affecting balance, agility, muscle strength, hand
precision, and body coordination (Trombetti et al. 2016;
Verhaegen and Salthouse 1997). Although older workers tend
to be less productive at more physically demanding tasks,
such as manual farmwork onsite, they usually have more farm
experience and knowledge. An aging workforce requires more
intensive agricultural mechanization and adoption of other
labor-saving technologies. This may ease labor burdens and
improve labor productivity, especially among older farmers and
farmworkers.
Some high-income economies have responded to the
declining availability of local labor by inviting international
migrants to fill seasonal farm jobs. According to the Database
on Immigrants in OECD Countries, the number of Asian
migrant workers in agricultural jobs in the OECD grew fivefold
from 68,000 in 2001 to 328,000 in 2016. About 70% of them
were from South or Southeast Asia. In the fiscal year ending
in 2016, 2.3% of migrant farmworkers in Australia and New
Zealand were from the Pacific and 2.4% from South Asia.
Since 2012, Australia’s Seasonal Worker Programme has
provided more than 40,000 seasonal jobs to workers from
the Pacific and Timor-Leste (Clarke and Dercon 2016). While
addressing workforce shortages in Australia, the programs
provide opportunities for Pacific and Timorese workers to
gain experience, earn income, and send remittances home to
support their families and communities. Similarly, New Zealand
allows overseas workers from the Pacific in horticulture
and viticulture, through its Recognized Seasonal Employer
(RSE) scheme. From less than 5,000 placements in 2008, the
number of visas under the RSE scheme had more than doubled
to over 12,000 in 2019, before it declined in 2020 due to the
COVID-19 pandemic. Most RSE workers are from Vanuatu,
followed by Samoa and Tonga. Most workers in the past years
have been men, reflecting a strong gender bias in recruitment
(Bedford 2020).
Some middle-income economies in Asia and the Pacific
also host Asian migrants, mostly to fill low-skilled farm
jobs. Malaysia, for instance, is a large employer of overseas
migrant workers. In the 1980s, the Government of Malaysia
allowed increasingly large numbers of migrants to work in
jobs vacated by locals, especially in agriculture (Kaur 2010).
Malaysia and Indonesia signed in 1984 the Medan Agreement,
which allowed male workers from Indonesia to work on
Malaysian plantations (Abubakar 2002). Malaysia subsequently
signed similar agreements with Bangladesh and Thailand.
For decades, Indonesian migrants provided labor for planting
and harvesting, but the mounting success of Indonesia’s own
plantations has stemmed this labor flow, with fewer Indonesians
choosing to migrate to work on Malaysian plantations.20 Asian Development Outlook 2021 Update
Figure 2.1.10 Foreign workers on Malaysian plantations
Many migrants, mostly from Indonesia, are employed on Malaysian plantations.
Bangladesh
India
Indonesia
Others
Workers, '000
500
400
300
200
89.7%
100 78.1% 79.5% 77.9% 72.6%
92.9% 87.4% 73.4%
71.1%
0
2000 2005 2010 2015 2016 2017 2018 2019 2020
Source: ADB estimates using data from the Ministry of Primary Industries and the Immigration Department cited in P. Wickramasekara. 2020. Malaysia: Review of
Admission and Recruitment Practices of Indonesian Workers in the Plantation and Domestic Work Sectors and Related Recommendations. International Labour Organization.
Malaysian Palm Oil Board data show that 86% of plantation
workers, mostly field and general workers, are foreign migrants
(Wickramasekara 2020). According to the Ministry of Primary
Industries and the Immigration Department, most plantation
migrant workers are Indonesian. However, the Indonesian
share declined from almost 93% in 2000 to 71% in 2020 as
more workers arrived from other Asian economies, mainly
Bangladesh and India (Figure 2.1.10).
The COVID-19 pandemic has highlighted the vital role
that migrants play in agricultural supply chains. Many Asian
migrant workers have returned to their home countries,
notably Cambodia, India, the Lao PDR, and Timor-Leste.
As the pandemic evolves, concerns emerge about shortages
of migrant workers for planting and harvesting (FAO 2020a).
International travel restrictions and the quarantine
requirements of subnational states and territories are
significantly delaying new recruitment under the Pacific
Labour Scheme. From March and October 2020, no Tongan
workers entered or left Australia because of complete border
closure. In Malaysia, the pandemic is exacerbating labor
shortage in its palm oil industry. Thousands of migrant
workers have left plantations to head home as borders closed.
A foreign labor shortage induced by COVID-19 was expected to
disrupt food production, processing, and distribution.Transforming agriculture in Asia 21
2.1.4 C
limate change poses ever greater
challenges to agriculture in Asia
Given its reliance on weather and climate, agriculture is
especially vulnerable to risks posed by climate change. Changes
in temperature and rainfall patterns, and extreme weather events,
which are increasing in frequency and intensity due to climate
change, cause significant damage and losses to Asian crop and
livestock production, as well as fisheries. Aside from the negative
agricultural production impacts of these events over the short and
medium term, these events have negative long-term impacts as
they damage natural resources and the ecosystem services of land
and water that sustain agriculture.6 Figure 2.1.11 illustrates the
impact of climate change on agriculture and food security.
Figure 2.1.11 Impact of climate change on agriculture and food security
Agriculture is vulnerable to climate change and extreme weather.
– Food security
issues
– Higher prices for
Extreme Low agricultural
Climate change Production loss raw material
weather events productivity
– Higher GHG
emissions and
resource use
Long-term change in Increase in the frequency • Extreme temperatures, • Lower crop yield • Lower food supply
average weather patterns and intensity of extreme water stress, and • Lower livestock and • Lower supply of
• Rising temperatures weather events water scarcity limiting fishery production raw materials
• Increased precipitation • Droughts growth and reproduction • Higher food production
• More variable temperature • Floods of crops cost, such as for livestock
• Storms • Extreme temperatures • Higher GHG emissions
• Heat and cold waves causing livestock and per calorie
fishery losses
GHG = greenhouse gas.
Note: The classification adopted draws on the EM-DAT CRED Guidelines.
Source: ADB illustration.
Crop growth and yields are highly sensitive to significant
changes in temperature and precipitation. In the past 6 decades,
Asia experienced significant changes in precipitation. Many parts
of East, South, and Southeast Asia have experienced declines
in precipitation, while precipitation increased in other parts of
the region (Figure 2.1.12). As the average temperature continues
to rise, the risk of precipitation extremes will further increase
over Asia and the rest of the world (Ge et al. 2019; Guo et al. 2016;
Li, Zhou, and Chen 2018). Climate change studies predict that, as
global warming continues, most of the monsoon area in East and
Southeast Asia will experience large increases in precipitation.
6
Climate change may benefit some areas, such as Mongolia, with expected
increases in temperature.22 Asian Development Outlook 2021 Update
Figure 2.1.12 Observed changes in precipitation and temperatures in Asia, 1958–2019
Asia has experienced changes in precipitation and maximum and minimum temperatures.
a. Precipitation change (millimeters)
50
b. Maximum temperature change (°C)
3
continued on next pageTransforming agriculture in Asia 23
Figure 2.1.12 Continued
c. Minimum temperature change (°C)
3
Source: Gumma (2021) based on climate data from J. T. Abatzoglou et al. 2018. Terraclimate, a high-resolution global dataset of monthly climate
and climatic water balance from 1958–2015, Scientific Data. Data available at TerraClimate. Climatology Lab. http://www.climatologylab.org/
terraclimate.html (accessed 26 March 2021).
Under the worst-case scenario of high GHG emissions—
designated representative concentration pathway (RCP) 8.5—
by 2050 South Asia will experience an average increase in
monsoon precipitation by 6.4% (Mani et al. 2018). Extreme
precipitation and floods are also seen increasing in certain
areas in Southeast Asia and Central Asia (McKinsey &
Company 2020; IPCC 2018; Huang et al. 2014; Jie et al. 2019).
Climate change studies predict higher frequency and
intensity of drought as warming accelerates (Sheffield and
Wood 2008; Dai 2010). With accelerated warming, studies
expect increased water stress and drought in Asia and the
Pacific (Kraaijenbrink et al. 2017; Liu et al. 2018; Gao et al.
2018; Wang et al. 2021; Naumann et al. 2018; Cook et al. 2020).
Higher drought frequency and intensity are expected in
East and Southeast Asia (Amnuaylojaroen and Chanvichit
2019; Zhai et al. 2020). In some areas of West and South Asia,
periods of drought are likely to lengthen and occur 5–10 times
more frequently (Naumann et al. 2018). For instance, worsening
drought severity and frequency are expected across the central,
northern, and western parts of India (Gupta and Jain 2018;
Shrestha et al. 2020).24 Asian Development Outlook 2021 Update
Extreme heat stress during the reproductive stage of crop
growth can diminish yields in certain crops, notably rice and
corn (Wang et al. 2019; Shi et al. 2017; Deryng et al. 2014).
Changes in maximum and minimum temperatures accurately
describe climate variability over larger areas. They give a
frame of reference that allows meaningful comparisons of
locations and provide reliable calculations of temperature
trends. One study found past drought and extreme heat
significantly reducing global grain production by 9%–10%
(Lesk, Rowhani, and Ramankutty 2016). While there is less
research on the impact on agriculture from heat waves in
Asia and the Pacific, evidence hints at their negative impacts
on both crop production and human health in the region.
Agricultural workers are expected to be the worst affected as
their work capacity and productivity are compromised by heat
stress, considering that they expend physical effort usually
while working outdoors. According to ILO (2019), agriculture
is projected to account for 60% of global working hours lost to
heat stress in 2030. Pregnant women and people aged over 50
face especially high health risks from heat exposure. Under a
scenario of high GHG emissions such as RCP 8.5, at least 600
million and perhaps 1 billion people in Asia will by 2050 be
living in areas at risk of lethal heat waves—ones that exceed the
human survivability threshold (McKinsey & Company 2020).
More frequent and more intense extreme weather events
have caused significant damage and losses to crop and livestock
production, as well as fisheries. In developing economies,
agriculture absorbs 63% of the damage and loss caused by
climate-related disasters across all economic sectors, or 26%
of all damage and loss (FAO 2021b). These effects include
physical damage from disasters to agricultural infrastructure
and assets such as standing crops, farm tools and equipment,
postproduction infrastructure, irrigation systems, livestock
shelters, and fishing boats, as well as losses from lower crop
production, lower income from livestock products, higher input
prices, reduced agricultural revenue, higher operational costs,
and increased unexpected expenditure to meet immediate
needs in the aftermath of a disaster. Damage and loss cascade
through the food value chain and other industries such as
manufacturing that have backward linkages to agriculture.
Crops absorb 49% of all damage and loss from disasters
triggered by natural hazards (FAO 2017). By causing water
shortage and heat stress, drought directly affects crop and
livestock yields. Recurring or prolonged drought have persistent
ecosystem impacts that affect agricultural productivity over the
long term. Drought caused by far the most damage and loss in
livestock from 2008 to 2018, at 86%. It accounted for 14.6% of
damage and loss in crops, albeit far less than 57.7% from floods
and 25.4% from storms. Fisheries were damaged mostly by
tsunamis, at 68.9%, and storms, at 18.1%.Transforming agriculture in Asia 25
Extreme weather events have exposed many people and
vast agricultural areas in Asia to climate-related disasters
(FAO 2015a). Six of the world’s 10 climate-related disasters
most damaging to agriculture from 2003 to 2013 were in Asia
(FAO 2017). They include floods in Pakistan in 2010 and 2011
from extraordinary rainfall that caused $5.3 billion in
agricultural damage and loss in one year and $1.9 billion
the next. These disasters are followed in ranking by floods in
Thailand in 2011 costing $1.9 billion, Typhoon Haiyan in 2013
in the Philippines costing $1.4 billion, a tsunami in 2004 in
Indonesia costing $0.9 billion, and Cyclones Ondoy and Pepeng
in 2009 in the Philippines costing $0.8 billion (Figure 2.1.13).
Figure 2.1.13 C
limate-related disasters that most severely damaged
Asian agriculture
Extreme weather has periodically damaged Asian agriculture, causing billions of dollars in losses.
2010 Floods in Pakistan
2011 Floods in Pakistan
2011 Floods in Thailand
2013 Typhoon Haiyan in the Philippines
2009 Cyclones Ondoy and Pepeng in the Philippines
2015 Floods in Myanmar
0 2 4 6
$ billion
Note: Figures include damage and loss from climate-related disasters, including floods, drought, and
tropical storms, based on 2015 and 2017 estimates from the Food and Agriculture Organization (FAO).
The classification of disasters adopted by FAO draws on guidelines from the Emergency Events Database
(EM-DAT) of the Centre for Research on the Epidemiology of Disasters (CRED) and aligns with United
Nations Office for Disaster Risk Reduction definitions and terminology.
Background photo: Drowned harvest. This rice field in the Philippines was flooded by Cyclone Ondoy
(photo from the image collection of the International Rice Research Institute. www.irri.org; CC BY-NC-SA 2.0).
From 2008 to 2018, Asia and the Pacific suffered $207 billion in
crop and livestock production losses to disasters, or 74% of the
global total (FAO 2021b).7 Of this amount, the PRC accounted
for over $153 billion, or 55% of the global agricultural loss,
7
This equals 283 calories per capita per day, or 11% of the recommended
daily allowance.26 Asian Development Outlook 2021 Update
while developing economies including low and lower-middle
income economies in Southeast Asia accounted for $21 billion
and in South Asia for $25 billion. The frequency and scale of
such events and the damage they cause are rising under climate
change and threaten to reverse the economic gains of past
decades and worsen poverty, especially in Asia and the Pacific.
2.1.5 A
griculture faces environmental
challenges of its own making
The green revolution succeeded in part through heavy use of
chemical fertilizers and pesticides, subsidized by governments.
To stimulate agricultural production and achieve food self-
sufficiency, many Asian governments launched production
support programs. These government subsidies lowered
the price of fertilizers and encouraged their overuse, which
not only burdened national fiscal positions but also caused
environmental degradation. Indonesia, for example, began
subsidizing fertilizer in 1971, as did the Philippines in 1973,
to encourage its use with high-yielding modern rice varieties
and reduce rice production cost (Esguerra 1981; Hedley and
Tabor 1989). In both Indonesia and the Philippines, average
nitrogen fertilizer use per hectare of cropland in 2010–2019
was more than double average use in 1970–1989 (Figure 2.1.14).
Nitrogen use likewise intensified in other Southeast Asian
economies—most notably Thailand and Viet Nam—and in
South Asia, especially Bangladesh, India, and Pakistan.
Figure 2.1.14 Nitrogen fertilizer use in selected Asian economies, 1971–2018
The use of nitrogen fertilizer has intensified in developing countries in Asia.
1970–1989
1990–2009
2010–2019
Kilograms per hectare
250
200
150
100
50
0
ROK Japan PRC Sri Lanka World Viet Nam Indonesia Bangladesh Malaysia Pakistan Philippines India Thailand
PRC = People’s Republic of China, ROK = Republic of Korea.
Source: FAO. FAOSTAT. http://www.fao.org/faostat/en/#data (accessed 21 June 2021).Transforming agriculture in Asia 27
Fertilizer subsidies have placed a fiscal burden on Asian
governments. While intensified fertilizer use contributed to past
improvement in agricultural production and food security, their
fiscal and environmental costs have outweighed their benefits.
Fertilizer subsidies absorbed 1.6% of the national budget in
Bangladesh in fiscal 2019, for example, and 1.2% in Indonesia
(FPMU 2020; Suryana 2019; Kementerian Keuangan 2019).
Further, the primary beneficiaries of fertilizer subsidies have been
generally larger, better-off farmers. In Indonesia, for instance,
60% of fertilizer subsidies benefit 40% of the largest farmers
(Osorio et al. 2011). Because fertilizer subsidies have consumed
a considerable share of government expenditure, phasing out
fertilizer subsidy programs offers significant fiscal savings.
In the PRC, for instance, the government phased out fertilizer
subsidies and invested in nitrogen and waste management
(Searchinger et al. 2020).
Fertilizer overuse has caused unwanted phosphorus
deficiency, increased water pollution, and led to greater GHG
emissions. Fertilizer accounts for 12% of the GHG emissions from
agriculture. The manufacture of synthetic nitrogen fertilizer
generates significant GHG emissions, while its application is a
significant contributor to direct nitrous oxide (N2O) emissions
from agricultural soils. In the PRC, for instance, GHG emissions
associated with the manufacture of synthetic nitrogen fertilizers
in 2015–2017 were 41.4 metric tCO2e for wheat and 59.7 metric
tCO2e for maize. In the same period, annual direct N2O emissions
from 12.63 tons/year of synthetic nitrogen application were
estimated at 35.82 gigagrams of N2O for wheat and 69.44 for
maize (Chai et al. 2019).
Chemical pesticides are also extensively used in modern
agriculture. The success of green revolution encouraged
widespread production of only a few varieties of rice, which made
production more susceptible to pests and increased the need for
pesticides. Farmers started overusing them in the belief that more
was better, though studies later found that the use of pesticide
during early plant growth was unnecessary, as leaf-feeding
insects seldom affected yield (Heong, Escalada, and Mai 1994).
Further, pesticides pose threats to farmers’ health and food
safety (Gomes et al. 2020; Zhang, Zeiss, and Geng 2015; Pingali,
Marquez, and Palis 1994).
Water shortages affect a large share of rural population in
Asia. FAO (2020a) estimated that 500 million rural people globally
are subject to very high water stress in the case of irrigated
areas, or very high drought frequency affecting rainfed cropland
and pasture. Among them, 453 million people, or 91%, are in
Asia, though only 21% of the affected agricultural land is in this
region (Figure 2.1.15a). In Asia, 77% of affected areas and 87%
of affected rural populations are in only four economies: India,
Indonesia, Pakistan, and the PRC. Climate change is expected to
further exacerbate water shortages by changing rainfall patterns.You can also read