Optimized Umkehr profile algorithm for ozone trend analyses
←
→
Page content transcription
If your browser does not render page correctly, please read the page content below
Atmos. Meas. Tech., 15, 1849–1870, 2022
https://doi.org/10.5194/amt-15-1849-2022
© Author(s) 2022. This work is distributed under
the Creative Commons Attribution 4.0 License.

Optimized Umkehr profile algorithm for ozone trend analyses
Irina Petropavlovskikh1,2 , Koji Miyagawa2 , Audra McClure-Beegle1,2 , Bryan Johnson2 , Jeannette Wild3,4 ,
Susan Strahan5,6 , Krzysztof Wargan6,7 , Richard Querel8 , Lawrence Flynn9 , Eric Beach10 , Gerard Ancellet11 , and
Sophie Godin-Beekmann11
1 CIRES,  University of Colorado, Boulder, CO, USA
2 NOAA,   Global Monitoring Lab, Boulder, CO, USA
3 CISESS, University of Maryland, College Park, MD, USA
4 NOAA/NWS/NCEP/CPC, College Park, MD, USA
5 USRA, Columbia, MD, USA
6 NASA GSFC, Greenbelt, MD, USA
7 Science Systems and Applications, Inc., Lanham, MD, USA
8 The National Institute of Water and Atmospheric Research Ltd., Lauder, New Zealand
9 NOAA Center for Satellite Applications and Research, STAR, College Park, MD, USA
10 IMSG, College Park, MD, USA
11 LATMOS Sorbonne Université, UVSQ, CNRS, Paris, France

Correspondence: Irina Petropavlovskikh (irina.petro@noaa.gov)

Received: 12 July 2021 – Discussion started: 23 September 2021
Revised: 14 January 2022 – Accepted: 20 January 2022 – Published: 28 March 2022

Abstract. The long-term record of Umkehr measurements            and assesses the impact of the instrumental changes on the
from four NOAA Dobson spectrophotometers was repro-              stability of the Umkehr ozone profile record. This paper de-
cessed after updates to the instrument calibration procedures.   scribes a method designed to correct biases and discontinu-
In addition, a new data quality-control tool was developed       ities in the retrieved Umkehr profile that originate from the
for the Dobson automation software (WinDobson). This pa-         Dobson calibration process, repair, or optical realignment of
per presents a comparison of Dobson Umkehr ozone profiles        the instrument. The Modern-Era Retrospective analysis for
from NOAA ozone network stations – Boulder, the Haute-           Research and Applications version 2 (MERRA-2) Global
Provence Observatory (OHP), the Mauna Loa Observatory            Modeling Initiative (M2GMI) and NASA Global Modeling
(MLO), Lauder – against several satellite records, including     Initiative chemistry transport model (GMI CTM) ozone pro-
Aura Microwave Limb Sounder (MLS; ver. 4.2), and com-            file model output matched to station location and date of ob-
bined solar backscatter ultraviolet (SBUV) and Ozone Map-        servation is used to evaluate instrumental step changes in
ping and Profiler Suite (OMPS) records (NASA aggregated          the Umkehr record. Homogenization of the Umkehr record
and NOAA cohesive datasets). A subset of satellite data is se-   and discussion of the apparent stray light error in retrieved
lected to match Dobson Umkehr observations at each station       ozone profiles are the focus of this paper. Homogenization
spatially (distance less than 200 km) and temporally (within     of ground-based records is of great importance for studies of
24 h). Umkehr Averaging kernels (AKs) are applied to ver-        long-term ozone trends and climate change.
tically smooth all overpass satellite profiles prior to com-
parisons. The station Umkehr record consists of several in-
strumental records, which have different optical characteri-
zations, and thus instrument-specific stray light contributes    1   Introduction
to the data processing errors and creates step changes in the
record. This work evaluates the overall quality of Umkehr        The success of 30 years of international collaborations since
long-term measurements at NOAA ground-based stations             the implementation of the Montreal Protocol and its amend-
                                                                 ments were celebrated at the Symposium for the 30th An-

Published by Copernicus Publications on behalf of the European Geosciences Union.
1850                              I. Petropavlovskikh et al.: Optimized Umkehr profile algorithm for ozone trend analyses

niversary of the Montreal Protocol (http://www.montreal30.          namical transport rely on the development of climate chem-
io3c.org/, last access: 21 February 2022), bringing together        istry models (CCMs, Morgenstein et al., 2017). However,
leading scientists, policymakers, and the public at the French      the long-standing differences between the model reconstruc-
Academy of Sciences in Paris, France (Godin-Beekmann et             tion of the past ozone variability and observations suggest
al., 2018) on 22–23 September 2017. The emphases were on            the need for improvement of simulations of the seasonal to
future scientific and public policy challenges for efficiently      subseasonal processes. Continuous verification of modeling
guiding ozone recovery processes (Newman, 2018). Confir-            results with the ongoing long-term measurements will help
mation of stratospheric ozone recovery was reported in re-          with understanding the processes that determine ozone re-
cently published literature (Steinbrecht et al., 2017; Ball et      covery. Dobson Umkehr time series beginning in the 1950s
al., 2019; Petropavlovskikh et al., 2019). The current state        are one of a few long-term historical ozone observational
of stratospheric ozone recovery was summarized in the 2018          records. Continuous Umkehr datasets provide a reference
WMO/UNEP ozone assessment (WMO, 2018), where trend                  for testing consistency among shorter satellite and remote
uncertainties for combined observational records have been          sensing methods and are used to validate combined records
used to describe confidence in detected trends. Uncertainty of      (Petropavlovskikh et al., 2005a; Kramarova et al., 2013).
trend detection did not include full information about ozone           The Umkehr method is based on measuring the difference
measurement uncertainty. The difference in trends derived           in zenith-sky intensities selected from two spectral regions
from satellite combined observational records suggests that         (centered on 311.5 and 332.4 nm, so-called C-pair spec-
further work needs to be done to assure good practices for          tral channels) over a range of solar zenith angles (SZAs).
the homogenization of long-term ozone records. Ground-              The longest records are those from Dobson and Brewer
based records are often used to verify the stability of satellite   spectrophotometers. The logs of the ratio of the observed
records (Fioletov et al., 2006; Krzycin and Rajewska-Wich,          radiances (also called N values) increase with increasing
2007; Nair et al., 2011, 2012; Flynn et al., 2014; Hubert et        SZA, and at about 86◦ SZA reverses and starts to de-
al., 2016; Bernet et al., 2019, 2021; Wang et al., 2020). In        crease up to 90◦ SZA, which grants the observation its name
order to provide the reference, ground-based observations re-       since “Umkehr” means reversal or change in German. Us-
quire careful and continuing examination of past calibration        ing the Umkehr effect for calculating vertical ozone distri-
records, changes in instrumentation, and assessment of mea-         bution was first described by Götz et al. (1934). The ear-
surement uncertainties. Changes in the frequency of mea-            liest Umkehr measurements were performed in the 1930s
surements can create complications in interpretation of rel-        in Arosa, Switzerland (Staehelin et al., 2018). The method
ative stability of records and the resulting impact on the          helped to determine the altitude of the maximum in the ozone
derived ozone trends (Sofieva et al., 2014; Damadeo et al.,         layer and was applied around the world to study seasonal and
2014).                                                              interannual cycles in ozone distribution. Several algorithms
   Multiple studies show statistically significant positive         were developed to improve the Umkehr method, and with an
trends in ozone in upper stratospheric levels in tropical and       advance in computers, the processing algorithm was devel-
northern midlatitudes, and nearly significant positive trends       oped by Mateer (1965). He investigated the impacts of the a
in the Southern Hemisphere. The statistical and analytical ap-      priori and vertical smoothing to assess the vertical resolution
proaches to quantify ozone recovery are complicated by the          in the retrieved profile. The algorithm used Vigroux ozone
natural year-to-year variability which is detected in the ob-       absorption cross sections (Vigroux, 1953). Carl Mateer ap-
served ozone records. Moreover, stratospheric ozone recov-          plied his experience with the Umkehr method in developing
ery rates are expected to be slower than the decline of strato-     the first algorithm for satellite ozone retrieval (Mateer, 1971).
spheric ozone during the 1980s due to the long lifetime of          After Bass and Paur (1985) published a new absorption cross
the ozone-depleting substances. While ozone recovery in the         section and its temperature dependence, Mateer and DeLuisi
upper stratosphere is mostly determined by halogen levels,          updated the Umkehr algorithm (Mateer and DeLuisi, 1992).
temperature plays an important role in ozone recovery, in-          DeLuisi (1979) and DeLuisi et al. (1989) studied the effects
cluding so-called “super recovery”, where ozone abundances          of volcanic aerosol interferences and found that stratospheric
exceed 1980 levels due to greenhouse-gas-induced strato-            aerosols from the Agung and El Chichón eruptions produced
spheric cooling. At the same time, in the lower stratosphere,       large errors in Umkehr-retrieved ozone profiles.
atmospheric composition and ozone levels are driven by the             Despite short-term impacts from stratospheric aerosols
climate-impacted changes in the Brewer–Dobson circula-              on Umkehr ozone retrievals, the length and stability of the
tion and by seasonal-to-decadal variability in stratosphere–        record were considered as an advantage for satellite vali-
troposphere exchange. These processes are difficult to dis-         dation. Newchurch et al. (1987) provided reference to the
cern and predict based solely on ozone or other atmospheric         Stratospheric Aerosol and Gas Experiment (SAGE) I ozone
composition observations (Ball et al., 2019, 2020; Abalos et        data processing to assist with the correction of its altitude
al., 2019; Orbe et al., 2017; Strahan et al., 2020; Dietmüller      registration. The analysis helped to homogenize SAGE I
et al., 2021). Analyses of the processes that are responsible       and SAGE II records for trend analyses. Comparisons of
for ozone changes through atmospheric chemistry and dy-             Umkehr profiles with multiple Solar Backscatter Ultravi-

Atmos. Meas. Tech., 15, 1849–1870, 2022                                              https://doi.org/10.5194/amt-15-1849-2022

I. Petropavlovskikh et al.: Optimized Umkehr profile algorithm for ozone trend analyses                                         1851

olet Radiometer 2 (SBUV(/2)) ozone records (Bhartia et                  NOAA Dobson ozone observations are positioned to con-
al., 2013) aided in assessment of offsets between individual        tinue monitoring stratospheric ozone recovery for the next
SBUV(/2) instrumental records due to satellite drifting orbit       30 years. In addition to the six NOAA Dobson stations
(Kramarova et al., 2013). Because of its long-term measure-         (Table 1) and four NOAA Brewer stations, Umkehr obser-
ment record, Umkehr data are regularly used for scientific as-      vations are regularly performed by several Dobson (three)
sessments of ozone depletion (Harris et al., 1998). They were       and Brewer spectrometers (six) that are distributed glob-
first used in the early 1980s (Reinsel et al., 1984) to estimate    ally. Stratospheric ozone recovery rates will differ between
changes in stratospheric ozone depletion over long-term sta-        tropics, middle latitudes, and high latitudes (WMO, 2018).
tions in the US, India, Australia, Canada, and Europe.              Umkehr stations are located at multiple locations around
   Some global locations that host a Dobson instrument have         the world and will hence provide important information for
been providing routine, morning and afternoon, Umkehr ob-           tracking ozone recovery.
servations to the World Ozone and UV Radiation Center                   The current operational Umkehr profile algorithm pro-
(WOUDC) database, including a number of stations hosting            duces data that have relatively large uncertainty (∼ 5 % in
Umkehr time series that start in the late 1950s. This renders       the stratosphere, Hassler et al., 2014; also see Fig. 2 in
the Umkehr ozone profiles the longest ozone profile time se-        Petropavlovskikh et al., 2005b), which precludes our abil-
ries (Bojkov et al., 2002) and is central in validating other       ity to detect small changes in stratospheric ozone. The re-
observational methods (Petropavlovskikh et al., 2005a), as          finement of the processing software is required to resolve the
well as numerical models that simulate and forecast ozone           instrument-related offsets in ozone profile retrievals. It is also
content changes (Zanis et al., 2006). These profiles do not         important to remove offsets between satellite and ground-
come as a replacement to other ground-based observations            based ozone profiles to further improve the satellite ozone
of the ozone profile but rather serve to complement them.           profile validation process. The main objective of this paper is
Ozonesonde observations provide a much finer vertical res-          to reduce noise in the existing Umkehr records and therefore
olution profile; however, the measurements typically stop at        improve its suitability for detection of relatively small trends
the balloon-burst altitude of 30 km (Deshler et al., 2008), and     (e.g., 1 %–3 % over the 2000–2016 period, Petropavlovskikh
the launches are typically performed once a week or less            et al., 2019). In addition, continuous improvement of the
(with the exception of two stations in Europe where sam-            satellite retrieval algorithms requires ground-based observa-
pling is done three times a week). The issue of relatively          tions of high accuracy and stability, which the optimized
short time records also applies to lidar (Jiang et al., 2007)       Umkehr record aims to provide.
and microwave (Moreira et al., 2017) observations.                      In this paper, we discuss optimization approach to homog-
   The Umkehr retrieval algorithm relies on the “self-              enize long-term Umkehr ozone profile records. In Sect. 2,
calibration” technique that applies normalization of a set of       we describe several long-term ozone-observing records and
morning or afternoon measurements to a single measure-              model simulations of stratospheric ozone variability selected
ment selected at the smallest SZA. This process removes the         for this study. We also discuss a matching criterion for
majority of the instrumental artifacts and homogenizes time         comparisons of these records with ground-based observa-
series. The vertical distribution of ozone is retrieved in 10       tions. In Sect. 3, we present methods developed for iden-
ozone layers between surface and ∼ 45 km. However, rou-             tification of vertical and temporal offsets between opera-
tine (operational) data processing is still not optimized to        tional Umkehr and other ozone-observing systems. Then,
account for an out-of-band (i.e., known as stray) light that        we describe the approach for removing offsets to homog-
affects measurements at the high SZAs (Petropavlovskikh et          enize Umkehr record. Finally, in Sect. 4, we demonstrate
al., 2005b; Evans et al., 2009). Optimization of stray light        the consistency between optimized Umkehr and other ozone
correction is a unique process to each Dobson instrument as         records.
it depends on its bandpass and optical alignment that are not
always known from the historical calibration records. Recent
attempts to measure the bandpasses of several Dobson instru-        2     Data
ments in the optical lab with lasers (Köhler et al., 2018) led to
an investigation of instrumental uncertainties in Dobson total      2.1    NOAA Dobson total ozone and Umkehr ozone
ozone retrieval. The band-pass adjustment for some instru-                 profiles
ments lead to several percent change in derived total column
ozone. However, not many instruments have been optically            Dobson total column ozone records are regularly used in
characterized so far. The Dobson Umkehr algorithm thus re-          satellite record validation (Bai et al., 2015; Koukoulil et al.,
quires an extensive verification of stray light levels in mul-      2016; Boynard et al., 2018) and development of the global
tiple instruments used to create long-term records. Change          combined ozone data records (Fioletov, 2008; Hassler et
of the instrument can introduce step changes in the vertical        al., 2008). In 2017, NOAA long-term Dobson total column
distribution of retrieved ozone profiles and thus affect the sta-   ozone records at 15 stations were homogenized to account
bility of the long-term record.                                     for inconsistencies in the past calibration records, data pro-

https://doi.org/10.5194/amt-15-1849-2022                                              Atmos. Meas. Tech., 15, 1849–1870, 2022
1852                             I. Petropavlovskikh et al.: Optimized Umkehr profile algorithm for ozone trend analyses

Table 1. NOAA Dobson Umkehr data information: Name of the station, WMO code, dates of the record (month and year), and geolocation
of the ground-based stations.

                     Location                  Site    Data record          Latitude    Longitude    Elevation
                                               code    (mm/yyyy)                                          (m)
                     Fairbanks, Alaska         FBK     03/1984–10/2020      64.86◦ N    147.85◦ W          133
                     Haute-Provence, France    OHP     09/1983–12/2020      43.93◦ N    5.71◦ E            685
                     Boulder, Colorado         BDR     02/1978–12/2020      40.02◦ N    105.25◦ W         1634
                     Mauna Loa, Hawaii         MLO     05/1982–12/2020      19.53◦ N    155.58◦ W         3400
                     Perth, Australia          PTH     03/1969–07/2016      31.92◦ S    115.96◦ E            2
                     Lauder, New Zealand       LDR     02/1987–12/2020      45.04◦ S    169.68◦ E          370

cessing methods, and selection of representative data. The           tion and season and can vary between a few (e.g., at Boulder
updated total ozone records are used in Umkehr ozone profile         in spring due to seasonal increase in clouds) and up to 60
retrievals. Descriptions of three Dobson stations used in this       (e.g., at MLO when counting both morning and afternoon
paper analysis, instrumentation, and total ozone data changes        retrievals in winter), but on average Umkehr stations ob-
can be found in Evans et al. (2017).                                 serve 15 profiles per month or more (∼ 30 profiles at MLO).
   The ozone profile data at NOAA are collected by Dob-              NOAA Dobson Umkehr operational ozone profile data are
son instruments with Umkehr method deployed only at six              posted on the GML archive https://gml.noaa.gov/aftp/data/
ground-based stations: Fairbanks, AK, USA; the Haute-                ozwv/Dobson/AC4/Umkehr/ (last access: 21 May 2021). The
Provence Observatory (OHP), France; Boulder, CO, US;                 Umkehr observations are archived at the WOUDC (https:
Mauna Loa, Hawaii, US; Perth, Australia; and Lauder, New             //www.woudc.org, last access: 18 October 2018), operated
Zealand (Table 1). Observations at all Umkehr stations are           by the Environment Climate Change Canada, where the cen-
ongoing except at Perth where the Dobson stopped collect-            tralized data processing is done by Python-based version of
ing data in 2016. In this paper, we focus our discussion of          the UMK04 processing software (https://github.com/woudc/
changes in Umkehr record at Boulder, CO. Section S1 in               woudc-umkehr, last access: 18 October 2018). The content
the Supplement shows summary results for the OHP (mid-               of the files at the NOAA and WOUDC archives is the same
dle northern latitude), the Mauna Loa Observatory (MLO)              as that for the operational Umkehr ozone profile record, but
(tropical latitude) and Lauder (Southern Hemisphere middle           the format differs.
latitude) stations, while results for Fairbanks (high northern
latitudes) and Perth (middle southern latitudes) are similar to      2.2   Ozonesonde data
other stations and therefore are not shown.
   The Umkehr data collection is automated by the NOAA               The ozonesonde instrument has been launched on the me-
WinDobson operational software (Evans et al., 2017) that             teorological balloons since the 1980s at 10 NOAA sta-
schedules zenith-sky observations at C-pair spectral chan-           tions. Evolving instrumentation has created discontinuities
nels during the morning and afternoon hours. During the au-          and gaps leading to inhomogeneous data records. NOAA
tomation, the observational process (i.e., frequency of ob-          and the international community developed homogenization
servations, signal-to-noise ratio, cloud clearance, etc.) is         methods for ozonesondes that were applied to NOAA and
changed. The software uses the near-IR cloud detector to             Southern Hemisphere Additional Ozonesondes (SHADOZ)
screen the Umkehr data for clear-sky conditions, interpo-            networks (Sterling et al., 2018; Witte et al., 2018). The er-
lates screened observations to 12 nominal SZAs, adds total           ror budget for each profile is calculated and included in the
column ozone information, processes data, and checks re-             archived files (Sterling et al., 2018). Modern ozonesonde in-
trieved ozone profiles for quality flags and against station         struments sample ozone at the high vertical resolution, on the
climatological variability (±2 standard deviations). This pro-       order of 100–200 m. The sondes constitute an essential com-
cess results in the improved quality assurance of observa-           ponent of satellite calibration and cross calibration (Hubert et
tions and reduces cloud-induced anomalies in the Umkehr              al., 2016) and are used for verification and improvement of
data. The quality check of the retrieved ozone profile in-           climate chemistry, chemistry transport models, and reanaly-
cludes assessment of the number of iterations (fewer than            ses (Stone et al., 2016; Miyazaki and Bowman, 2017; War-
four is considered a good profile) and the condition that the        gan et al., 2018; Stauffer et al., 2019). The ozonesonde profile
difference between observed and retrieved Umkehr observa-            records provide key measurements for the middle and lower
tions at all SZAs remains within measurement uncertainty             stratospheric, and tropospheric ozone trend calculations and
(Petropavlovskikh et al., 2005b). The number of accepted             are a benchmark network for stratospheric ozone profile
Umkehr profiles per month depends on the station geoloca-            observations (Steinbrecht et al., 2017; Petropavlovskikh et
                                                                     al., 2019; WMO, 2018). Data for ozonesonde records are

Atmos. Meas. Tech., 15, 1849–1870, 2022                                                https://doi.org/10.5194/amt-15-1849-2022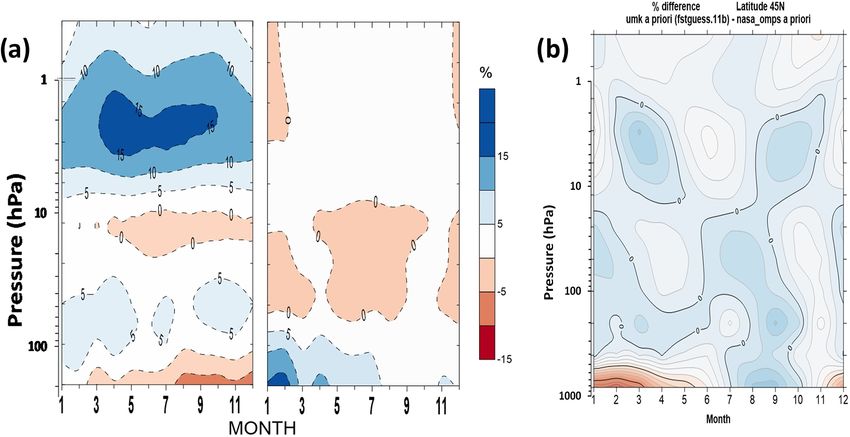
I. Petropavlovskikh et al.: Optimized Umkehr profile algorithm for ozone trend analyses                                   1853

publicly available from the NOAA Global Monitoring Lab           ther referred to as OMPS) sensor that collects high spec-
(GML) at https://gml.noaa.gov/aftp/ozwv/Ozonesonde/ (last        trally resolved solar backscattered radiance in the sunlit part
access: 10 March 2021), from the WOUDC at https://www.           of the globe (Seftor et al., 2014). OMPS makes measure-
woudc.org (last access: 18 October 2021), from the Net-          ments from 250 to 310 nm with a 1.1 nm resolution. It has
work for the Detection of Atmospheric Composition Change         a 16.6◦ cross-track FOV and 0.26◦ along-track slit width,
(NDACC) at https://www.ndacc.org (last access: 8 July            but several spectrums are combined to cover a footprint
2021), and from the NOAA National Centre for Environmen-         of 250 × 250 km. The ozone profile retrieval is very sim-
tal Information (NCEI) archive at https://data.nodc.noaa.gov/    ilar to the Rodgers optimal statistical method deployed in
cgi-bin/iso?id=gov.noaa.ncdc:C01562 (last access: 3 Octo-        the SBUV and Umkehr retrieval techniques. Validation of
ber 2021). In this paper, we are using ozonesonde data from      the NOAA operational OMPS ozone profile products is de-
Boulder, USA; Hilo, USA; and Lauder, New Zealand. The            scribed in Flynn et al. (2014). Evaluation of the OMPS
data for the first two stations are taken from the NOAA          NASA V8.6 algorithm products for trend analyses is de-
GML archive and are homogenized versions (Sterling et al.,       scribed in McPeters et al. (2019).
2018). The Lauder ozonesonde data prior to 2018 were pro-           In this paper, we used two satellite combined records.
vided by Richard Querel of NIWA, New Zealand, for the use        The first record is the NASA aggregated dataset (further re-
in the LOTUS report (Petropavlovskikh et al., 2019). This        ferred to as AGG), which is comprised of SBUV, SBUV/2,
dataset is not homogenized, and the data are the same as         and OMPS profiles from all (Nimbus 4 through NOAA 19)
those archived at NDACC (http://www.ndaccdemo.org/, last         overlapping satellites and using the NASA version 8.6 pro-
access: 8 July 2021). We extended Lauder ozonesonde data         cessing (McPeters et al., 2013). The AGG station over-
with the unhomogenized 2018–2020 data downloaded from            pass data are selected from all daily records that are found
the NDACC archive (last accessed in April 2021). The OHP         within the ±2◦ latitude, ±20◦ longitude box centered on
ozonesonde data were homogenized in 2020. The data are           the station location and averaged using 1 / distance weight-
available from the NDACC archive (Gaudel et al., 2015).          ing to the station location. The dataset for Boulder station is
However, the NDACC version at the time of data analyses          available at https://acd-ext.gsfc.nasa.gov/anonftp/toms/sbuv/
contained some small errors associated with the telemetry        AGGREGATED/sbuv_aggregated_boulder.co_067.txt (last
noise in the recent measurement period. Therefore, we used       access: 10 March 2021). The AGG overpass records for other
the latest version provided by Gerard Ancellet and Sophie        Umkehr stations can be found in the same directory. Some-
Godin-Beekmann of Latmos, France (Gerard Ancellet and            times, there are two or three satellite overpass data found for
Sophie Godin-Beekmann, personal communications, 15 June          a single day. For the purpose of comparisons with Umkehr
2021), which is also now archived at NDACC.                      data, all daily records are averaged.
                                                                    The second record is the NOAA COHesive (COH) dataset
2.3     Satellite ozone profile data                             that combines records data from the SBUV/2 and OMPS
                                                                 (NOAA processing, further referred to as OMPS_NOAA)
Several satellite records are used for monitoring ozone glob-    instruments on the many satellites using correlation-based
ally and vertically. In this paper, we are using daily NOAA      adjustments providing an overall bias adjustment plus an
and NASA long-term records that are sampled for the              ozone-dependent factor (Petropavlovskikh et al., 2019). The
Umkehr station overpass conditions and also matched in time      resulting profile product is a set of daily or monthly zonal
with Umkehr profiles.                                            means, has been used in climate reviews (Weber et al., 2018;
                                                                 Steinbrecht et al., 2017), and is publicly available at http:
2.3.1    SBUV and OMPS ozone profile records                     //ftp.cpc.ncep.noaa.gov/SBUV_CDR/ (last access: 10 March
                                                                 2021).
NASA and NOAA have produced satellite measurements of               In order to create the station overpass data, each SBUV/2
ozone profiles through the SBUV and related instruments          and OMPS satellite record is sampled separately to find all
(Nimbus 4 and 7) providing nearly 40 years of continuous         daily records from ±2/20◦ latitude/longitude box centered on
data (1978–present). The use of the common-design single-        the station. The collected profiles are 1 / distance weighted
instrument dataset eliminates many homogeneity issues in-        to the station location and averaged. This is a similar pro-
cluding varying vertical resolution or instrumentation differ-   cess to the AGG overpass record but does not combine daily
ences. Version 8.6 SBUV data incorporate additional cali-        data from different satellites. The overpass data from each
bration adjustments beyond the version 8 release (McPeters       satellite are adjusted using the SBUV COH technique devel-
et al., 2013; Bhartia et al., 2013). Small but evident biases    oped for zonal average data. The SBUV/2 and OMPS COH
remain (Kramarova et al., 2013).                                 station overpass data (further referred to as COH) are avail-
   The Suomi National Polar-orbiting Partnership (S-NPP)         able on the NOAA website at http://ftp.cpc.ncep.noaa.gov/
satellite of the Joint Polar Satellite System (JPSS) was         SBUV_CDR/overpass (last access: 18 June 2021).
launched in October 2011 (Flynn et al., 2006). It carries
the Ozone Mapping and Profiler Suite nadir profiler (fur-

https://doi.org/10.5194/amt-15-1849-2022                                          Atmos. Meas. Tech., 15, 1849–1870, 2022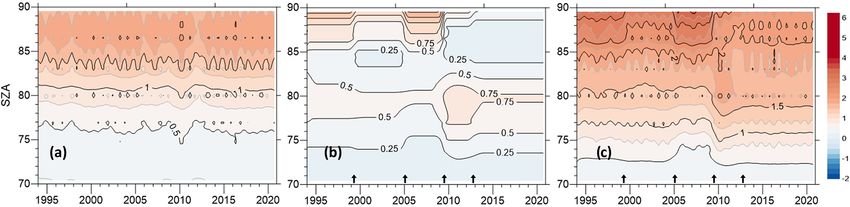
1854                              I. Petropavlovskikh et al.: Optimized Umkehr profile algorithm for ozone trend analyses

2.3.2   Aura MLS profiles                                           ±2◦ in latitude. The SAGE II ozone V7 data are avail-
                                                                    able as number density profiles at pressure levels from this
The Microwave Limb Sounder (MLS) measured ozone pro-                directory: https://doi.org/10.5067/ERBS/SAGEII/SOLAR_
files from the Upper Atmosphere Research Satellite (UARS)           BINARY_L2-V7.0 (NASA/LARC/SD/ASDC, 2012). The
and Aura satellite platforms (Waters et al., 1999). We use          number density profile is converted to ozone partial pres-
Aura MLS version 4.2 data (Livesey et al., 2020) for com-           sure and to DU (1 DU is 2.69 × 10²⁰ molecules m−1 ) using
parisons with Umkehr observations during the 2005–2020              pressure and temperature profiles provided in the files which
period. MLS version 5.1 was not available at the time of            are based on MERRA. The high-resolution SAGE II profile
analysis; the ozone product is not expected to differ signif-       is smoothed with AKs from the respective Umkehr profile
icantly between the two versions (Livesey et al., 2020). Re-        found by temporal and spatial matching as described above.
trieved ozone values are computed for 12 levels per decade
change in pressure. That is, 12 levels are selected between         2.4   GMI CTM and M2GMI simulated ozone profiles
1 and 10 hPa; another 12 levels are selected between 10 and
100 hPa, and also between 100 and 1000 hPa. The spacing             The NASA Global Modeling Initiative chemistry transport
is linear in log pressure. The vertical resolution of the MLS       model (GMI CTM), an offline model driven by MERRA-2
averaging kernel (AK) is about 2.6 km in the middle strato-         meteorological reanalysis (Gelaro et al., 2017), is used to as-
sphere and increases to ∼ 3.5 km at 1 hPa pressure level. The       sess the impact of various natural and anthropogenic pertur-
MLS mixing ratio profiles are converted to layers in DU us-         bations of atmospheric composition and chemistry (Strahan
ing pressure and temperature profiles provided in the files         et al., 2007, 2013). Strahan et al. (2016) uses the excellent
as also measured by MLS. The Umkehr AKs are applied to              agreement between simulated and observed seasonal evolu-
smooth MLS gridded profiles prior to comparisons. The fre-          tion of Arctic N2 O to demonstrate the simulation’s value in
quency of MLS observations in space and time (3500 profiles         quantitatively separating chemical from dynamical changes
daily between 82◦ N and 82◦ S latitudes) provides match-            in polar ozone depletion during the Aura period (2004–
ing overpasses within ±5◦ latitude and ±5◦ longitude of the         2015). Douglass et al. (2017) compared a GMI CTM sim-
Umkehr station location. Validation of the accuracy of MLS          ulation with midlatitude NDACC column measurements of
ozone profiles and their stability is described in Livesey et       long-lived reservoir species HNO3 and HCl to verify the re-
al. (2020). The MLS ozone profiles are assimilated in the           alism of MERRA-2 transport in both hemispheres from 2004
Modern-Era Retrospective analysis for Research and Ap-              to the present and to demonstrate the value of GMI CTM sim-
plications version 2 (MERRA-2) reanalyses (Wargan et al.,           ulations to explain how sparse sampling impacts interpreta-
2017 and references therein). Section 2.4 discusses MERRA-          tion of trends in the observations. Strahan et al. (2015) ana-
2 data used in the global NASA chemistry transport models           lyzed MLS N2 O data to show that the quasi-biennial oscilla-
used for Umkehr homogenization.                                     tion (QBO) had a profound and far-reaching impact on Cly
                                                                    variability in the Southern Hemisphere. The QBO modulates
2.3.3   SAGE II ozone record                                        the extratropical mean age (and hence N2 O and Cly ) each
                                                                    winter, and the impacts are then transported to the Antarctic
SAGE is an ongoing series of solar occultation instruments          lower stratosphere on a 1-year timescale. The QBO adds un-
spanning several decades providing high-precision vertical          expected interannual variability to equivalent effective strato-
profiles of ozone from the troposphere to the mesosphere            spheric chlorine (EESC) in the southern extratropical strato-
with ∼ 1 km vertical resolution. Providing the longest single-      sphere.
instrument record of stratospheric ozone, SAGE II (Mauldin             The CTM is integrated at 1◦ horizontal resolution on
et al., 1986) was operational aboard the Earth Radiation Bud-       72 vertical levels from the surface to 0.01 hPa and uses
get Satellite between October 1984 and August 2005. In              MERRA-2 meteorological fields as input. The output from
this paper, we use the 1985–2000 period to avoid the re-            the GMI CTM simulation is available for 1985–present
duced sampling after 2000. In mid-inclination orbit (57◦ ),         (https://portal.nccs.nasa.gov/datashare/dirac/gmidata2/
the instrument observed upwards of 31 solar occultation             users/mrdamon/Hindcast-Family/HindcastMR2V2/,               last
measurements per day (∼ 15 sunrises and ∼ 15 sunsets as             access: 23 February 2021). The CTM’s tropospheric physi-
viewed from orbit). The sampling is such that, for each event       cal processes include convection, boundary layer turbulent
type, successive observations are evenly spaced in longi-           transport, wet scavenging in convective updrafts, wet and dry
tude (i.e., ∼ 24◦ between each) and slowly moving in lati-          deposition, lightning NOx production, and anthropogenic,
tude, collectively providing uniform sampling over two sepa-        natural, and biogenic emissions. The chemical mechanism
rate latitude bands of different meridional extents (i.e., larger   uses JPL-2015 rates and currently has 119 species and more
near the tropics and narrower at midlatitudes) in any given         than 400 kinetic and photolytic reactions; it is an updated
day that slowly shifts from day to day. Because of the in-          version of the mechanism described in Duncan et al. (2008).
frequent sampling, the matching criteria for the SAGE II               Customized GMI CTM simulation outputs were created
ozone satellite data are relaxed to ±20◦ in longitude and           for the three NOAA Dobson Umkehr stations for 1979–

Atmos. Meas. Tech., 15, 1849–1870, 2022                                              https://doi.org/10.5194/amt-15-1849-2022
I. Petropavlovskikh et al.: Optimized Umkehr profile algorithm for ozone trend analyses                                       1855

2017 to assist in the assessment of the instrumental offsets       evaluation of ozone variability represented by two modeling
and to develop instrument-specific corrections to homoge-          records.
nize the Umkehr record. GMI CTM data at the NDACC                     The M2GMI ozone profile output is subsampled for the
sites (including six NOAA Umkehr sites) are available at           Boulder, OHP, MLO (or Hilo), and Lauder Dobson station
https://www.ndacc.org (last access: 8 July 2021). The files        geolocations (selected from the grid closest to the station lo-
contain vertical profiles of O3 , NO2 , H2 O, temperature, pres-   cation) and is matched within 30 min to the Umkehr obser-
sure, potential temperature, and potential vorticity on a geo-     vation (local time for the averaged Sun elevation between
metric altitude grid with hourly time resolution. Model out-       70 and 90◦ SZA). The ozone profiles are provided on the
put is generated on geometric altitude, geopotential height, or    constant pressure levels that are converted to Dobson units
pressure-level grids as needed for comparisons with Umkehr         (DUs) and smoothed with Umkehr AKs to created Umkehr-
that is derived as pressure-level gridded layer data. Daily        like layers. This is the version of data that is used as a refer-
global ozone, trace gas, and meteorological fields are also        ence dataset for Umkehr optimization. The M2GMI ozone
available as needed for synoptic-scale interpretation of Dob-      and temperature profiles are available for the 1980–2019
son and ozonesonde data.                                           time period (https://www.esrl.noaa.gov/gmd/aftp/data/ozwv/
   We use another simulation M2GMI (Orbe et al., 2017;             Dobson/AC4/, last access: 21 May 2021). In addition, the
Wargan et al., 2018) that is available for Umkehr step-change      temperatures are used to adjust ozone absorption cross sec-
analyses. It is called MERRA-2 GMI (M2GMI). M2GMI is               tions in the radiative transfer modeling of Umkehr curves to
the full GEOS general circulation model (GCM) with the             account for the diurnal, daily, and seasonal ozone variability
GMI chemical mechanism and is driven by the MERRA-                 in the stratosphere (see Sect. S4).
2 horizontal winds, temperature, and surface pressure using
the “replay” methodology (Orbe et al., 2017). The MERRA-           2.5   FG11 and QBO a priori
2 assimilated meteorological fields are used by the model
to simulate meteorology that is continuously adjusted to the       FG11 (further referred to as fg11ap) is a climatological ozone
MERRA-2 winds, temperature, and surface pressure. Com-             dataset (McPeters and Labow, 2012) that describes typical
parisons of the M2GMI against MERRA-2, GMI CTM, and                ozone variability with latitude (5◦ zonal averages) and season
ozonesonde profiles have been recently described in Stauffer       (12 months). This is based on the Aura MLS and ozonesonde
et al. (2019).                                                     records measured between 2005 and 2010. Note that the
   The step change in the GMI CTM ozone record in                  ozone profile on any day of the year is the same in each
1998 was documented (Stauffer et al., 2019, and references         year of the record. Thus, ozone in each Umkehr layer only
therein). It was a result of the introduction of microwave ra-     changes seasonally.
diance observations from a series of Advanced Microwave               The QBO a priori (further referred to QBOap) is an ozone
Sounding Unit (AMSU) sensors into the MERRA-2 observ-              climatology developed for analyses of the SBUV records to
ing system (Gelaro et al., 2017). The 1998 change as well          improve soft calibrations for the MOD ozone record (Ziemke
as the addition of MLS temperature assimilation in the up-         et al., 2021). In addition to the seasonally and latitudi-
per stratosphere in 2004 strongly impacted the MERRA-2             nally dependent climatology, the method empirically mod-
dynamical fields (Gelaro et al., 2017; Long et al., 2017).         ifies ozone profiles based on the phase of the QBO cycle.
The MERRA-2 analysis increments alter the wind fields that         The QBOap is a zonally (36 5◦ latitude bins) and monthly
come from its GCM, pushing them toward the meteorologi-            averaged dataset available from 1970 to 2019.
cal observations. Where the GCM has biases, the increments            Both climatologies are matched with the dates and latitude
are large, driving unrealistic circulations that impact the GMI    location of the Umkehr observation at the Boulder station
CTM stratospheric ozone distributions in the tropics and sub-      (40.05◦ N) and are also AK smoothed.
tropics.
                                                                   2.6   Combined MLS and ozonesonde record
   There are differences between the GMI CTM and M2GMI
ozone simulations. Even though they both use the same full         The Aura MLS record (described in Sect. 2.3.2 above) is
GMI chemical mechanism, the meteorology used in the two            matched with ozonesonde profile by date (±12 h) and loca-
models is not identical. In the GMI CTM, the MERRA-                tion (±5◦ in longitude and ±5◦ in latitude). The approach to
2 meteorological product is used. M2GMI output is driven           the combining of MLS and ozonesonde record is described in
by a specified dynamics (SD) simulation. Instead of using          McPeters and Labow (2012). We use this method to extend
MERRA-2 meteorology, this SD uses a different method:              MLS station overpass ozone profile below 100 hPa with the
“replay” (see further description in Orbe et al., 2017). Be-       ozonesonde profiles. The time series of MLS–ozonesonde
cause the 1998 and 2005 discontinuity is smoothed in the           combined profiles between 2005 and 2020 is created for
M2GMI ozone record (Stauffer et al., 2019), we decided to          the Boulder station. The extended dataset is indicated by
use its ozone data as a reference for the Umkehr optimiza-         SND_MLS in the figures and is used in the homogenization
tion. In addition, we are using the GMI CTM output for as-         process.
sessment of changes in the optimized Umkehr record and for

https://doi.org/10.5194/amt-15-1849-2022                                             Atmos. Meas. Tech., 15, 1849–1870, 2022
1856 I. Petropavlovskikh et al.: Optimized Umkehr profile algorithm for ozone trend analyses
3 Optimization of Umkehr stray light corrections son 083 (Komhyr et al., 1993). The method restricted the
slit function to the core bandpass and did not provide infor-
3.1 Description of the Dobson measurement mation about out-of-band light rejection. Recent investiga-
uncertainties tions of the difference in the core bandpasses of three refer-
ence Dobson instruments (regional standard Dobson no. 064,
The Dobson consists of two monochromators and a slit plate Germany, no. 074, Czech Republic, and the world standard
for selecting two bands (pairs) of the UV solar spectrum no. 083, USA) were performed with a tuneable laser in a
approximately 20 nm apart. The Q levers indicate the posi- laboratory setting with support from the EMRP ENV 059
tion of the wavelength pairs (A, C, or D), which also de- project “Traceability for atmospheric total column ozone”
pends on the temperature inside of the instrument. The pho- (Köhler et al., 2018). Although some small deviations in the
tomultiplier tube registers the alternating signals from the bandpasses were found, the effective absorption cross sec-
short wavelength, which is absorbed by ozone, and the long tions derived using each Dobson slit function did not differ
wavelength attenuated by the optical wedge, resulting in the significantly and thus affected the derived total column ozone
measurable current (see Evans, 2008 for further details). It by less than 2 % (depending on the ozone cross section and
has been demonstrated (i.e., Moeini et al., 2019) that each wavelength pair). Unfortunately, the laboratory setting did
Dobson instrument has a unique optical system. Some of not allow assessment of the stray light contribution for the
the optical wedges are made from fused silica and others three Dobson instruments.
from quartz glass. Fused silica has higher UV transmission The non-laboratory-based methods can be used to discern
and is relatively even across the spectra used by the Dob- the level of the stray light when referenced against another in-
son. The transmission of quartz glass is several percent less strument with similar (Christodoulakis et al., 2015) or higher
and passes longer wavelengths more efficiently. The optical level of stray light rejection (Moeini et al., 2019). However,
wedges are also designed to have a logarithmic density curve, even with the knowledge of the instrument-specific bandpass
but wedge calibrations show that it is not uniform across the (shape and spectral alignment) and with the expected level
entire wedge, and some are inherently darker overall. An of stray light (between 10−4 to 10−5 ) a small but significant
error in poorly mapped wedge tend to increase toward the SZA-dependent bias remains unexplained in Umkehr obser-
darker portion of the wedge, which would have a greater ef- vations. Moreover, this bias propagates into the retrieved
fect on measurements made at large SZAs. The thickness Umkehr profiles and creates a 5 %–10 % bias relative to other
of the cobalt filters can make observations at longer wave- ozone-observing techniques (Petropavlovskikh et al., 2011).
lengths more susceptible to stray light. The next session demonstrates the standardized stray light
With time, the optical alignment in the instrument may corrections and changes in the Umkehr biases.
shift or the optical prisms may degrade. An operational in-
strument wavelength setting is regularly confirmed using the 3.2 Standardized stray light corrections
mercury lamp test. A standard lamp test is used to check the
stability of the extraterrestrial constant derived during the The impact of a stray-light-induced error in the Umkehr re-
station instrument calibration procedures against the refer- trieval is described in Petropavlovskikh et al. (2009) where
ence instrument (every 4–6 years). The characteristics of an Umkehr profiles in Boulder were compared against NOAA-
optical wedge are checked using two standard lamps (Dob- 11 and NOAA-16 SBUV/2 V8 satellite and ozonesonde
son, 1957; Evans, 2008). The identified changes are post- coincident profiles. It is further demonstrated in this pa-
corrected to homogenize the ozone record at the station. The per by comparing multi-year biases between operational
total ozone changes are typically corrected with a linear ad- Umkehr retrievals at three additional stations (Haute-
justment (step change or time-dependent increments based Provence, France; Mauna Loa, Hawaii; and Lauder, New
on comparison with the Dobson standard), but for Umkehr Zealand; see Table 1 for details) and several satellite records
measurements the changes are identified through the char- (Aura MLS, AGG, and COH; see details in Table 3). Prior
acterization of the optical wedge, which is then mapped to comparisons, all records with vertical resolution less than
into R–N tables that produce Umkehr N values (N value = 2 km (satellites and ozonesondes) are converted to DU, inter-
100 × log(Ilong /Ishort ), and I is the intensity of the UV light polated to 61 pressure levels (quarter of a standard Umkehr
observed through two spectral slits of the C-pair observa- pressure layer), and smoothed with the Umkehr AKs. Sub-
tions). The relation between R and N is not linear and thus sequently, the high-resolution profiles are integrated to the
can modify the shape of the Umkehr curve after the calibra- 10 standard Umkehr layers (see Table S1). Figure 1 shows
tions. This is a small change in N value but can result in comparisons for Umkehr profiles at Boulder, CO, processed
a significant (above uncertainty) step change in the Umkehr with (a) operational retrieval and (b) with application of stan-
ozone profile. dardized correction for stray light. Similar plots for Umkehr
The measurement of a Dobson slit function is not a sim- records at OHP, MLO, and Lauder appear in Sect. S1.
ple task. The original method used a model 783 McPherson Two panels in Fig. 1a summarize biases for operational
spectrophotometer to determine the slit functions for Dob- Umkehr profiles. Ozonesonde profiles are matched between
Atmos. Meas. Tech., 15, 1849–1870, 2022 https://doi.org/10.5194/amt-15-1849-2022I. Petropavlovskikh et al.: Optimized Umkehr profile algorithm for ozone trend analyses 1857 Figure 1. (a) Bias between station overpass data from satellite (AGG, COH, Aura MLS, and SAGE), model profile from grid closest to Boulder geolocation (GMI CTM and M2GMI), ozonesonde record from Boulder relative to operational (OPR) Umkehr profiles taken during 1994–2004 (left panel) and 2005–2020 (right panel). Mean profile and SD are calculated as an average (six sets of comparisons, excluding SAGE) of biases and averaged standard deviations. (b) The same as panel (a), but Umkehr retrieval includes standard stray light correction (SLC). (c–d) Standard deviations for the mean biases shown in panels (a) and (b). OPR is operational, and SLC is standard stray light correction. A solid line is for comparisons from 2005 to 2020, and a dotted line is for the 1994–2004 period. observations and models at the time of Umkehr observa- est bias except for the largest negative bias in layer 2 found tions in Boulder (±12 h) and space (± 50 km). Biases in in both time periods and an increased positive bias in layer eight Umkehr layers are averaged in two periods (before 5 in 2005–2020 period. The GMI CTM biases in layers 6– and after 2005). The left panel shows comparisons between 9 are similar in magnitude to the M2GMI biases, whereas Umkehr and GMI CTM, M2GMI, AGG, COH, SAGE II, and they grow larger in layers 3–5. Moreover, in the 2005–2020 ozonesondes. The right panel also includes comparisons with period (right panel), both M2GMI and GMI CTM biases in Aura MLS. AGG and COH results are nearly identical, sup- layers 3–5 increase relative to 1994–2004 (left panel) com- porting the consistency of the two different combination tac- parisons, and GMI CTM biases become the largest positive tics. The COH bias does not change significantly before and biases among all datasets. Ozonesondes have the lowest bias after 2005; it agrees well with operational Umkehr in lay- in layers 3 and 6, high bias in layers 4 and 5, and large neg- ers 2, 4, and 6, while it shows higher ozone in other layers ative bias in layer 2. The models have lower bias in layers with the largest positive bias (up to 15 %) in layer 8. The 6–8 as compared to observations (satellite and ozonesonde) biases in layers 3, 6, 7, and 8 are larger than 5 % that is and larger bias in layers 2–4. The mean offset is calculated Umkehr retrieval uncertainty for these layers. Layer 1 bias by averaging results from all datasets except SAGE II (six is also larger than 5 %, but Umkehr retrieval uncertainty in datasets before and after 2005), and horizontal bars represent this layer is ∼ 10 %–15 %. Results for layer 1 were not in- the standard deviation of the mean bias values. cluded in these comparisons because SAGE II or MLS satel- Figure 1b shows comparison of the same datasets, but lite records do not have consistent ozone information below Umkehr profiles are processed using standardized stray light 250 hPa, whereas vertical grid of the SBUV/OMPS profiles corrections (SLCs, Petropavlovskikh et al., 2011). It is found is coarse for interpolation. Ozonesonde and COH biases are that SLC reduces bias in layers 7, 8, and 9, increases biases similar for the two periods. Aura MLS bias is also like the in layers 4 and 3 (GMI bias in layer 3 becomes the largest COH bias. The M2GMI model comparisons show the small- https://doi.org/10.5194/amt-15-1849-2022 Atmos. Meas. Tech., 15, 1849–1870, 2022
1858                             I. Petropavlovskikh et al.: Optimized Umkehr profile algorithm for ozone trend analyses

among all layers), whereas biases in layers 5, 6, and 1 do not    are selected from look-up tables (LUTs) that are prepared
change significantly.                                             by the radiative transfer simulations of the Umkehr obser-
   Figure 1c and d summarize the uncertainty of the bias cal-     vations (Petropavlovskikh et al., 2005b, 2009) using a set of
culated for operational and SLC Umkehr profiles, respec-          climatological ozone profiles (McPeters et al., 1998). Correc-
tively. The solid (dashed) lines show results for the 2005–       tions are selected based on the station location (i.e., in low-,
2018 (1995–2004) comparison periods. There is no large dif-       middle-, or high-latitude regions) and adjusted to the total
ference found between standard deviations (SDs) in two time       ozone observed for the day. In the following step, the stan-
periods, and they are larger than 5 % in layers 2, 3 and 4. The   dardized stray light out-of-band corrections are selected from
largest SDs are found in comparisons between ozonesonde           LUT similarly developed to the scheme described above
and Umkehr. This could be related to a large vertical vari-       (Petropavlovskikh et al., 2011). This means that up to this
ability captured by ozonesondes and the limitations in the        point the Umkehr N values are simulated for a generic Dob-
Umkehr AK smoothing. However, the SD in layer 2 is still          son instrument. The assumption for out-of-band rejection (or
below 15 %, which is the estimated Umkehr retrieval uncer-        SLC) of the UV light in a typical Dobson instrument is on
tainty in the bottom layers. In summary, we demonstrated          the order of 2 × 10⁻⁵ (Evans et al., 2009; Petropavlovskikh
that the standardized stray light corrections do not fully re-    et al., 2011) but can vary between instruments (Moeini et al.,
duce the bias between Umkehr and other ozone-observing            2019) and therefore can vary between Dobson instruments
methods. Since the optical characterization of each Dobson        sequentially operated to create the long-term station record.
instrument is not yet possible, the optimization approach is         In order to test the representativeness of the M2GMI’s ver-
discussed next. In this paper, we discuss an empirical ap-        tical ozone distribution over Boulder, the above-described
proach to minimize simulated and observed Umkehr differ-          process is repeated by using several reference ozone records,
ences at large SZAs.                                              including Boulder overpass output from the GMI CTM and
                                                                  M2GMI models, FG11ap and QBOap climatology, and com-
3.3    Empirical correction methodology                           bined MLS and ozonesonde profiles (SND_MLS) matched
                                                                  to Umkehr station location and date of observation (see data
This section describes the new method developed for opti-         description in Sect. 2). Differences between simulated and
mization of Dobson ozone profile retrievals to account for        measured Umkehr N values are averaged over the time be-
the instrument-specific out-of-band stray light and other op-     tween two consecutive calibrations of the Dobson instrument
tical artifacts. This approach is used for homogenization of      at each nominal SZA to create an empirical correction for the
the long-term Umkehr records. The corrections for each in-        Umkehr curve simulated by the forward model. This unique
strumental record in the station time series are developed        correction is applied to reprocess each Umkehr measurement
to remove artificial steps in the NOAA Umkehr ozone pro-          (morning and afternoon separately) taken during the reana-
file records and to reduce the bias relative to other ozone-      lyzed time period, and the new ozone profile is called opti-
observing systems. To minimize instrumental artifacts in          mized. Note that optimized ozone retrieval includes both the
Umkehr observations (unknown instrumental optical degra-          standardized SLC and the new empirical instrumental cor-
dation or contribution of the background noise), the Umkehr       rection. The homogenized time series is created after all in-
retrieval forward model (simulation of the observation) is        dividual observational periods are reprocessed (see Sect. 4.2
forced to match the auxiliary or reference ozone profile. For     for further discussion).
example, the M2GMI ozone and temperature profiles sim-               Table 2 contains the dates and time periods selected to
ulated near the location of the Dobson station in Boulder         apply empirically derived adjustments to Dobson observa-
are assumed to represent atmospheric absorption and molec-        tions in Boulder, CO; OHP, France; Mauna Loa, Hawaii; and
ular scattering properties (assuming no aerosols in the atmo-     Lauder, New Zealand. These dates do not represent the entire
sphere) for the day (and time) of the Umkehr measurement.         calibration record of a station instrument. Not all calibration
The use of daily changing temperature profiles modifies the       activities create a step change in Umkehr records. Alterna-
ozone absorption cross section that allows an improvement         tively, the optimization method does not allow one to dis-
in the model fit to the day-to-day variability in N values at     cern changes that are less than measurement noise. Another
large SZAs (see Sect. S3 for further discussion).                 limitation of this method is that it requires at least 3 years
   The forward model of the Umkehr retrieval uses the refer-      of the record after the calibration to derive the correction.
ence ozone and temperature profiles to simulate the absorb-       Therefore, if calibration happens within the last 2 years of
ing and scattering properties of the UV zenith-sky radiation      the record, the optimization method is not able to detect the
observed by Dobson. It first calculates the single scattering     step change until a longer period becomes available.
zenith-sky intensities with high (0.1 nm) spectral resolution.       The decision to adjust Umkehr data is tested every time
The convolution of spectrally resolved zenith-sky radiances       the station instrument is replaced with a new instrument. The
and standardized band-pass functions (Komhyr et al., 1993)        change in observations can occur due to different levels of
is performed to create N values at 10 nominal SZAs. In the        out-of-band rejection unique to each Dobson instrument op-
next step, the multiple scattering and refraction corrections     tics system. Therefore, another reason to reprocess the data

Atmos. Meas. Tech., 15, 1849–1870, 2022                                            https://doi.org/10.5194/amt-15-1849-2022
I. Petropavlovskikh et al.: Optimized Umkehr profile algorithm for ozone trend analyses 1859
Table 2. Umkehr N-value-optimized corrections for each nominal solar zenith angle (70–90◦ SZAs) are shown for four Umkehr stations. All
corrections are normalized to 70◦ SZA (set to zero at 70◦ SZA). The correction period is between the dates indicated in the second column.
The last correction is through the end of 2020. The “updated WD” note on the right of the table identifies the WinDobson operating system
installation date for Dobson automation.
Boulder, CO
INS Start date SZA 70 74 77 80 83 85 86.5 88 89 90
61 1993 August 0.0 0.2 0.6 0.7 0.2 0.2 0.6 0.8 1.0 1.2
61 1999 April 0.0 0.3 0.5 0.6 0.1 0.1 0.4 0.5 0.7 0.9
61 2005 January 0.0 0.1 0.4 0.5 0.4 0.5 0.9 1.1 1.5 2.0
61 2009 June 0.0 0.4 0.8 1.0 0.4 0.1 0.2 0.2 0.6 1.0 Updated WD
61 2012 September 0.0 0.3 0.7 0.8 0.4 0.1 0.2 0.1 0.3 0.6
OHP, France
INS Start date SZA 70 74 77 80 83 85 86.5 88 89 90
85 1994 January 0.0 0.4 0.5 0.6 0.7 0.9 1.0 1.0 1.2 1.6
85 1996 February 0.0 0.5 0.8 0.7 −0.1 −0.3 −0.2 −0.1 0.4 1.1
85 2000 January 0.0 0.5 0.7 0.8 0.6 0.5 0.4 0.2 0.3 0.8
85 2007 April 0.0 0.6 0.9 1.0 0.7 0.5 0.2 −0.2 −0.3 0.1
85 2011 July 0.0 0.7 1.0 1.0 0.7 0.5 0.4 0.2 0.4 0.9
85 2014 April 0.0 0.4 0.7 0.9 0.8 0.7 0.6 0.5 0.8 1.2 Updated WD
Mauna Loa, Hawaii
INS Start date SZA 70 74 77 80 83 85 86.5 88 89 90
76 1994 January 0.0 0.5 1.0 1.2 0.5 −0.1 −0.6 −0.6 −0.2 0.6
76 1996 January 0.0 −0.1 −0.1 −0.3 −0.9 −0.9 −0.8 −0.3 0.2 0.8
76 2005 June 0.0 0.4 0.7 0.7 0.3 0.1 0.0 0.3 0.8 1.3
76 2010 June 0.0 0.7 1.0 1.4 1.3 1.2 0.8 0.7 0.8 1.0 Updated WD
Lauder, New Zealand
INS Start date SZA 70 74 77 80 83 85 86.5 88 89 90
72 1993 January 0.0 0.0 0.0 0.1 0.4 0.7 1.0 1.2 1.3 1.7
72 1996 January 0.0 0.0 0.0 0.0 0.2 0.4 0.5 0.6 0.6 0.8
72 1999 January 0.0 0.1 0.2 0.2 0.2 0.3 0.4 0.4 0.5 0.8
72 2006 February 0.0 0.0 0.1 0.2 0.1 0.2 0.4 0.6 0.8 1.0
72 2012 February 0.0 0.2 0.5 0.6 0.4 0.3 0.3 0.2 0.1 0.1 Updated WD
is after optical repair in order to determine whether it was systems (satellites, ozonesonde) and coincident with Dobson
caused by sudden physical damage (i.e., fall of the instru- observations.
ment) or long-term wear and tear due to exposure to the
weather elements (i.e., sea salt erosion). The instrument re- 3.4 Discussion of optimization results
pair can include replacement of the optical wedge, replace-
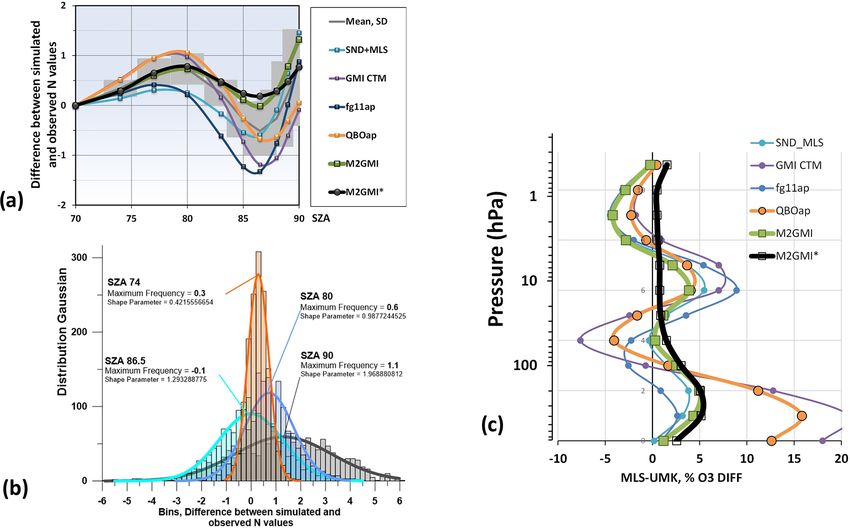
ment of the photocounter, or change of the center of the band- Figure 2a summarizes adjustments to the simulated N values
pass due to a new temperature setup for the Q levers. that are needed to match Umkehr observations in Boulder
The optimization method accounts for undetermined de- with other reference records between 2005 and 2018. Exam-
viations in the optical system that have not been captured ples of several N-value corrections are shown for Umkehr
at the time of the exchange or repair of the Dobson in- simulations where ozone profiles from several datasets were
struments. The changes may not be significant for accuracy used as the reference ozone profile information. The daily
of the total column ozone observations but may be large differences are averaged over the 2005–2018 period and plot-
enough to change Umkehr curve and create a step change ted at each Umkehr nominal SZA. The mean N-value cor-
in ozone record. To verify empirical adjustments and the rection and standard deviations are shown as gray boxes.
consistency of reprocessed Umkehr time series, in Sect. 5, The measurement uncertainty of typical Umkehr observa-
we present comparisons with independent ozone-observing tions ranges between 0.5 N value at 70◦ SZA and up to 1.2
N value at 90◦ SZA (i.e., standard deviations of the error co-
https://doi.org/10.5194/amt-15-1849-2022 Atmos. Meas. Tech., 15, 1849–1870, 2022You can also read