OPPORTUNITY DAY PRESENTATION Q2 2021
←
→
Page content transcription
If your browser does not render page correctly, please read the page content below

OPPORTUNITY DAY
    PRESENTATION Q2 2021

    SABINA PUBLIC COMPANY LIMITED
            www.sabina.co.th        1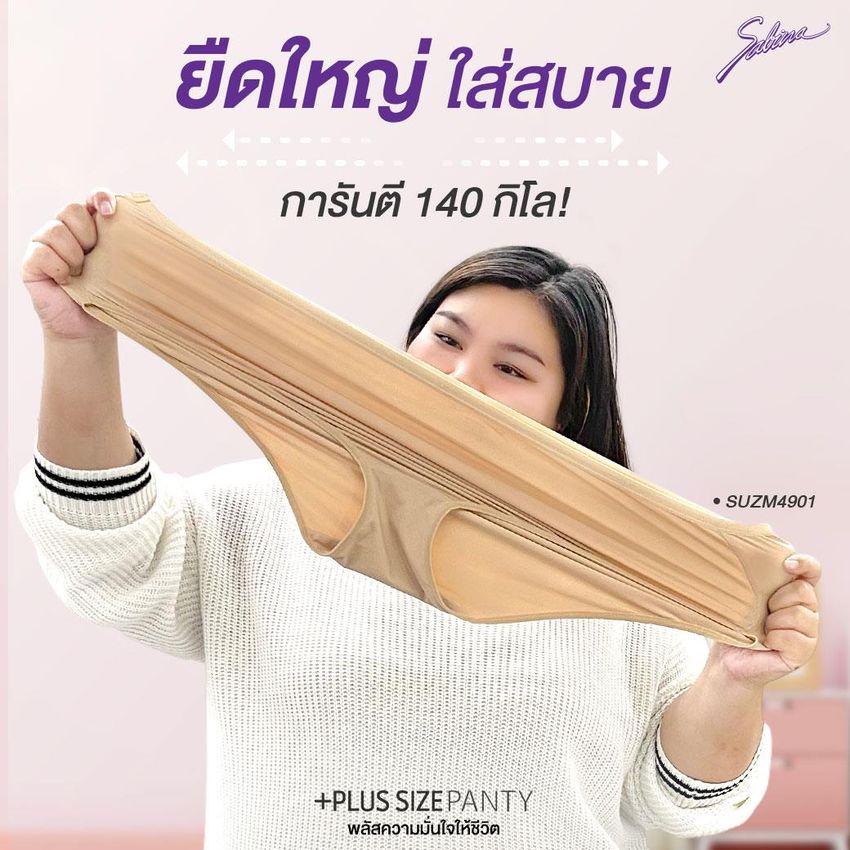
WHAT ARE WE IN Q2 2021        FINANCIAL HIGHLIGHT        BUSINESS UPDATE   APPENDIX

AGENDA
OPPORTUNITY DAY PRESENTATION

   Q2 2021

                              SABINA PUBLIC COMPANY LIMITED
                                      www.sabina.co.th                               2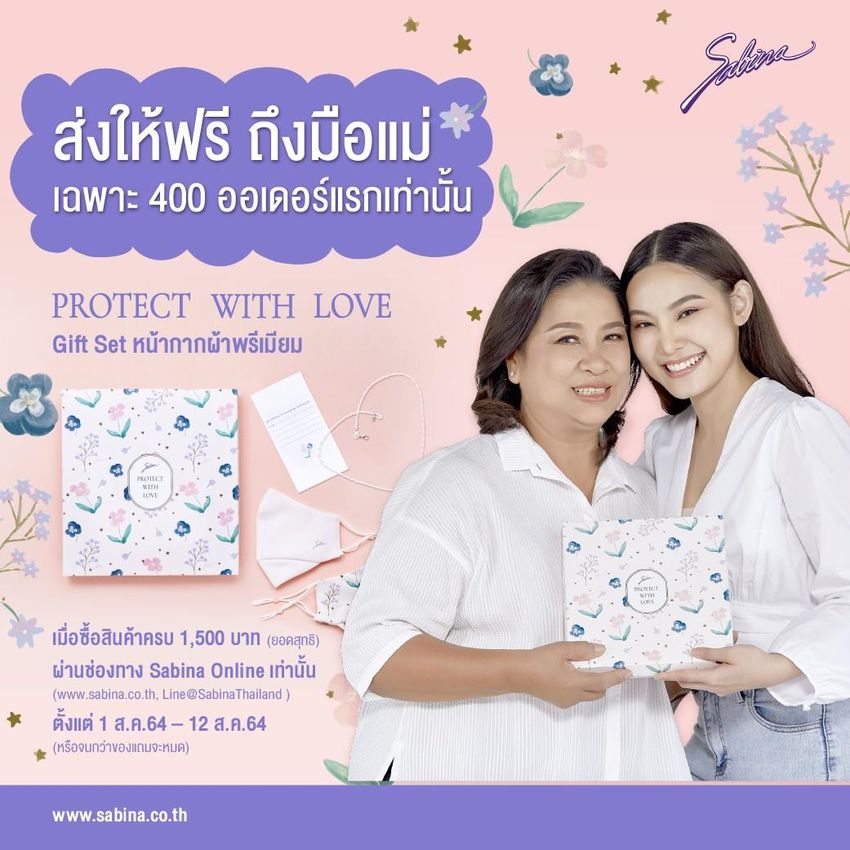
WHAT ARE WE IN Q2 2021   FINANCIAL HIGHLIGHT                          BUSINESS UPDATE                                APPENDIX

                                     Revenue
                                     THB mm

                                                            3,103    3,295
                                                                               2,914
                                                   2,679
                                          2,397

                                                                                                 1,340    1,305
                                           4%       12%     16%       6%      -12%
                                                                                                                            658      633

                                          2016     2017     2018     2019      2020              1H 20    1H 21           Q2 20    Q2 21

                                      •   Covid W3 has returned heavily again on mid of June although the situation seemed to be normal
                                          on April and May, Sabina has applied the following strategies,
                                      1. Introduce new budget price products to cope with the current situation.
                                      2. Increase more activities on both online marketplace and social commerce together with the TV
                                         shopping.
                                      3. More mobile pop up stores to the community market where there is high traffic.

Q2 2021                               4. More orders have been placed by CLMV distributors on April and May.

Sale Performance
                                                                                                                                        3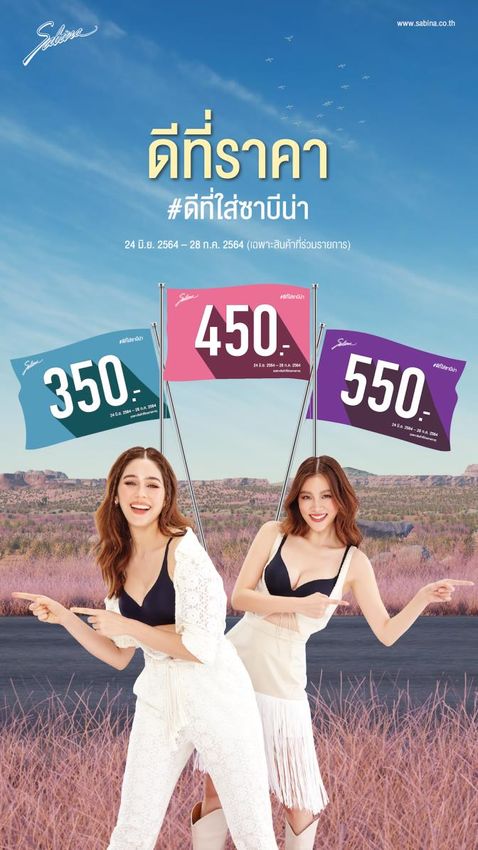
WHAT ARE WE IN Q2 2021                           FINANCIAL HIGHLIGHT                          BUSINESS UPDATE                                APPENDIX

  Gross Profit                                                                          Net Profit
                                                                      Gross Profit
                                                                                                                    12.5%
      52.8% 50.9% 51.6% 54.4%                                                                               11.7%                                 10.8%
                                    47.4%                48.5%                49.3%
                                                45.9%                                                                       9.5%                                             9.9%
                                                                      38.8%                          9.1%                                 9.0%
                                                                                              7.3%                                                                7.7%
                            1,786
                    1,595                                                                                            413
      1,258 1,356                   1,373                                                                    362
                                                                                                     243                     277
                                                  612    625                                  176                                                  141
                                                                                                                                           121
                                                                       256     309                                                                                  50        63
                                                                                              6%     38%    49%     14%     -33%

                                                                                              2016   2017   2018    2019    2020          1H 20   1H 21           Q2 20      Q2 21
      2016   2017   2018    2019    2020        1H 20 1H 21           Q2 20 Q2 21

                                                                                          •   +24.3% YOY, NPM increase from 7.7% to 9.9%
  •    GPM has sharply increased from 38.8% to 49.3% since Sabina did not
                                                                                          1. Higher efficiency of marketing budgets spent with social and online platform.
       produce low margin fabric mask anymore unlike the situation of last year when
       hygienic mask was short from the market, fabric mask took place in a sudden        2. Learning from the Covid situation last year the company has saved more expenses
       and were donated to several communities and hospitals.                                by combining some divisions, exercising more job rotation, renting lower sale
                                                                                             space, promoting more DTC sale, less traveling, etc.

Q2 2021
Sale Performance
                                                                                                                                                                                     4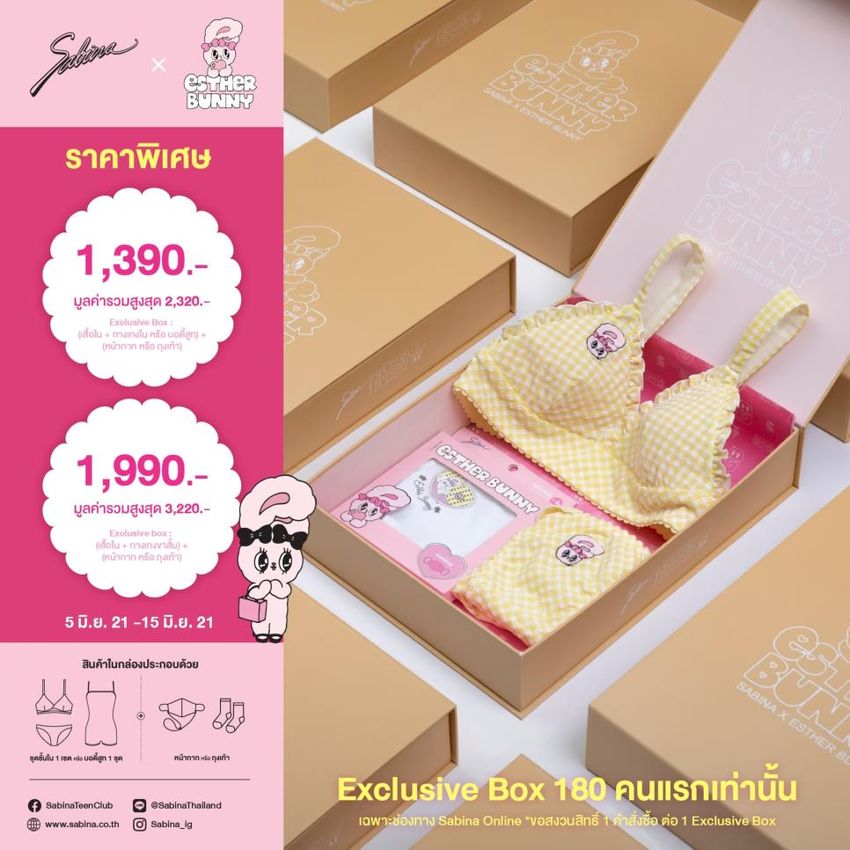
WHAT ARE WE IN Q2 2021                      FINANCIAL HIGHLIGHT                 BUSINESS UPDATE                         APPENDIX

 Sabina Revenue                                                                    Net Profit

  THB mm                                                                           THB mm

                                                                                                              2019     2020   2021

                                                 3,295 G 6.2%
                                 3,103 G 15.8%
                                                                2,914 G-11.6%                                             117
                   2,679 G 12%                                                                        105
      2,397 G 4%                                                                    95                                                  97
                                                                                                                                86
                                                                                               78
                                                                                          70                                                 70
                                                                                                                  63
                                                                                                             50

           2016       2017           2018            2019           2020                  Q1                Q2                  Q3           Q4

                                                                                                            1H 2020           1H 2021   % YoY

                                                                                         Net Profit          121                141      16.7%

Q2 2021
Performance Update
                                                                                                                                                   5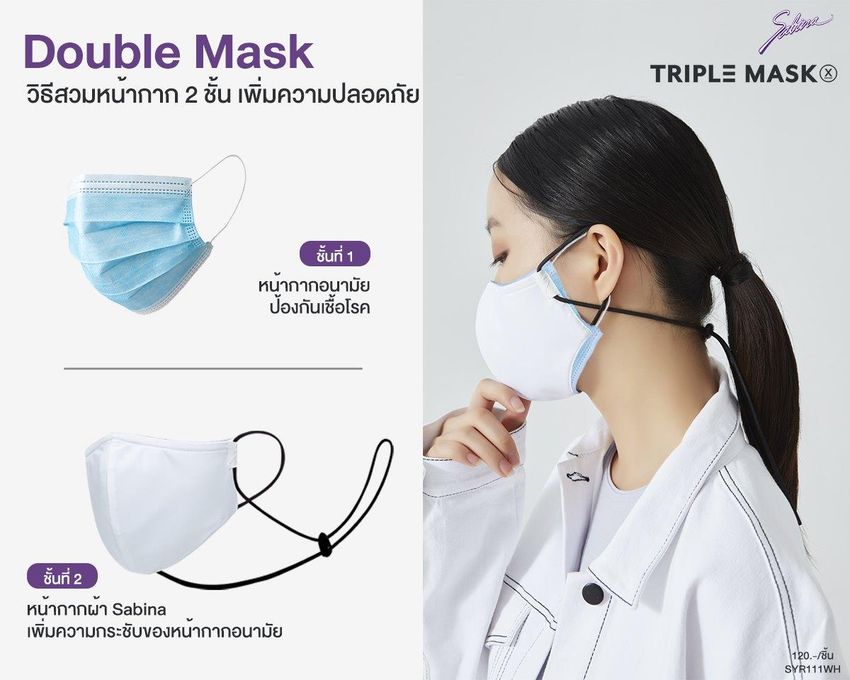
WHAT ARE WE IN Q2 2021                          FINANCIAL HIGHLIGHT                    BUSINESS UPDATE                                 APPENDIX

   1                                                                                      2
            SABINA BRAND                                                                            NON STORE RETAILING (NSR)
            REVENUE                                                                                 REVENUE
            64% (69% in 2020)                                                                        23% (19% in 2020)
                                                                           THB mm                                                                                           THB mm

                                                                                                                                554
                    2,489 2,581
     2,112 2,291                  2,006                                                                                 336
                                                                                                                                               284     295
                                                                                                                 254
                                                885    830                                                                                                            184
                                                                                                                                                                                149
                                                                     402      392                         96
      7%      8%    9%     4%     -22%
                                                                                                                164%    32%    65%
     2016    2017   2018   2019   2020        1H 20 1H 21          Q2 20 Q2 21                    2016   2017   2018   2019    2020           1H 20 1H 21            Q2 20 Q2 21

                                                                                                    • With the quick growth of +79% moving average since 2017, Nsr is still
       • With the ongoing of Covid wave2, more Mobile pop up stores have                              aiming to get 25-30% proportion of the total revenue by the end of this
         aimed to high traffic locations where there is the Government helping                        year although Nsr has got a hiccup on this quarter.
         vendor Campaign.                                                                           • The slow down of the economic due to the 1st and 2nd hit of Covid 19
       • Newness for Q2 collections such as Sabina x EstherBunny                                      has also caused the overall poor purchasing power and it was also
       • Focusing more O2O strategy through our Sabina@home program                                   because of the high growth of the on line sale at the same period.
         where the offline sales can also sell online.                                              • Real time marketing is still be our short-term strategy to adapt all sale
                                                                                                      and marketing plan to match with customer needs.

Q2 2021
Performance Update
Financial overview by segment                                                                                                                                               6
WHAT ARE WE IN Q2 2021                          FINANCIAL HIGHLIGHT                     BUSINESS UPDATE                           APPENDIX

   3                                                                                      4
             SABINA EXPORT                                                                           OEM
             REVENUE                                                                                 REVENUE
             3% (3% in 2020)                                                                            10% (9% in 2020)
                                                                           THB mm                                                                                     THB mm

                                                                                                                                            G -0.7%
                            76                                                                                    287   287    265
                                   70
      59             60                                                                           212      220
             52
                                                 35     40                                                                                 127        126
                                                                                                                 30.3% 0.1% -7.5%                                         73
                                                                                              -17.2% 3.9%                                                        65
                    17.4% 25.7% -7.9%                                          12
     -7.8% -12.7%                                                      8

                                                                                                  2016    2017   2018   2019   2020       1H 20 1H 21          Q2 20 Q2 21
     2016   2017    2018   2019   2020         1H 20 1H 21          Q2 20 Q2 21

                                                                                                    • The postponed shipment from March due to the Suez canal situation
      • Vietnam as one of the top secure from Covid country, the distributor                          has been combined together with the 2nd Quarter order to make the
        has placed more orders during April and May making the sale                                   sales increase 12.3%.
        increased to 43.5%.                                                                         • The recently weak Thai currency has caused the higher margin as
                                                                                                      well.

Q2 2021
Performance Update
Financial overview by segment                                                                                                                                         7
WHAT ARE WE IN Q2 2021    FINANCIAL HIGHLIGHT                   BUSINESS UPDATE                   APPENDIX

                                                             SABINA BRAND                         NSR
                                                               REVENUE                          REVENUE

      Q2 2021                                                    64%
                                                             (69% in 2020)
                                                                                                   23%
                                                                                               (19% in 2020)
      Performance
      Update

                                                        SABINA EXPORT                             OEM
                                                          REVENUE                               REVENUE

       Financial overview by segment
Sabina Brand              830.2 MB     64%                       3%                                10%
                                                             (3% in 2020)                       (9% in 2020)
Sabina NSR                294.5 MB     23%
Sabina Export              39.7 MB     3%
OEM                       126.4 MB     10%
                                                                                                                    8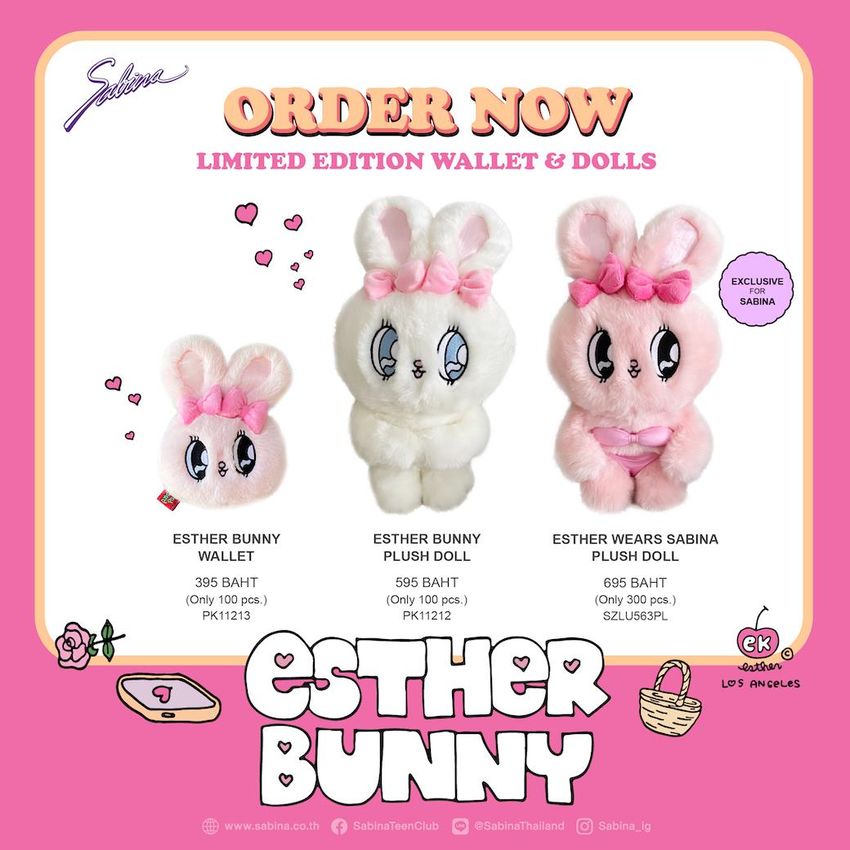
WHAT ARE WE IN Q2 2021                               FINANCIAL HIGHLIGHT   BUSINESS UPDATE                          APPENDIX

SABINA EXPORT
 39.7 MB , G +13.1%
                                                                                                                                   Sabina brand export has aimed to
                                                                                                                                   focus on the ASEAN community,
 New Store/POS Expansion (Q2 2021)                                                                                                 especially on the on line platform
                                                                                                                                   where we are now the number one
                                                                                                                                   of lingerie section through Shopee
                                                                                                                                   since 2020.
          ◼   Vietnam            29                ◼   Cambodia                    5

          ◼   Philippines        27                ◼   Bangladesh              10

          ◼   Myanmar             8                ◼   Pakistan                    9

          ◼   Laos                7

    Purely distributed by local partners with no direct investment on the stores

Offline                                                                                                Online

                                                                    •   Join the Thailand Best Buy                                   •   Sabina as one of the top 5 best
                                                                        and Top Thai Brand event                                         performance award in year 2020
                                                                        to expand the target group                                       from shopee and only one
                                                                        for Sabina                                                       lingerie brand that got this prize
                                                                    •   Doing the event near the                                     •    Join the double digit campaign
                                                                        area of supermarket or                                           every single month and having
                                                                        near the community to                                            Sabina brand day on online
                                                                        generate more sales and                                          platform
                                                                        expand target customer
                                                                                                                                                                  9
WHAT ARE WE IN Q2 2021        FINANCIAL HIGHLIGHT                       BUSINESS UPDATE                                  APPENDIX

                         OEM Customers [Lingerie]

                                                                    •   Order from UK and EU brands has
OEM                                                                     been fully booked till December
                                                                        2021.

                                                                    •   The collapse of some SME garment
126.4 MB , G -0.7%                                                      factories after the 1st and 2nd hit of
                                                                        Covid has brought the opportunity for
                                                                        OEM business to get more orders of
                                                                        all type of garments keeping Sabina
                                                                        production work smoothly.

             Order Confirmation Q2 2021

                                                                                                                 Order Confirmation
               1                       3                6                                                12
                                                                                                                 OEM order is in place until
                                                                                                                 December,2021

                                                                                                                                                   10
WHAT ARE WE IN Q2 2021 FINANCIAL HIGHLIGHT BUSINESS UPDATE APPENDIX
Online
NON STORE Lazada , Shopee , JD , LineShopping , Central Online , Robinson Online ,
ONLINE
52%
RETAILING (NSR)
Sabina Online
294.5 MB , G +3.7% New Channel New Business
i.e. Vending Machine 3%
TV & Catalogue TV + Catalogue
Oshopping , One31 , GMM25 , Friday , 24 Catalog
46%
• NSR still has growth about 3.7% even 2nd • New Customers try to buy product on • Real time marketing still be our short-term
and 3rd of Covid 19 pandemic occurred. alternative platforms besides traditional strategy to adapt all sale and marketing
platform (Offline) plan to match with customer needs.
11WHAT ARE WE IN Q2 2021 FINANCIAL HIGHLIGHT BUSINESS UPDATE APPENDIX
TREND ONLINE
NON STORE
Market Place
RETAILING (NSR) YoY-9.5%
294.5 MB , G +3.7%
23,09 Direct Sale
6,142 3,144 11,82
,790
YoY +11%
7,862
X
• DTC is growing in double digit comparing to other online
channels. Customers are willing to buy directly from brand.
DTC (Direct to customer)
Sabina website + Social commerce 12WHAT ARE WE IN Q2 2021 FINANCIAL HIGHLIGHT BUSINESS UPDATE APPENDIX
NON-STORE
RETAILING (NSR)
294.5 MB , G +3.7%
• Shopee Brand Awards 2021
To celebrate brands’ milestones and achievements, Shopee also
presented awards to ten brands for their outstanding marketing
and commercial performance
13WHAT ARE WE IN Q2 2021 FINANCIAL HIGHLIGHT BUSINESS UPDATE APPENDIX
SABINA BRAND
830.2 MB , G -6.2%
Traditional Store Retailing Channels
Department
Mobile pop up
Shop stores and Modern Trade
store
others
Distributors
2021 Store 2019 2020 Q2 2021 Dif
82 Department stores 307 Modern trade
95 Shops 82 Traditional Trade
Department Store 83 83 82 -1
◼ Key channel ◼ Key channel ◼ Key channel ◼ Key channel
for high value for mid-end for low price to manage Modern Trade 308 312 305 -7
products products products obsolete
Shop 106 102 95 -7
◼ Advertising inventory
channels Traditional Trade 88 81 81 0
Strengths
◼ Channels to Total 585 578 563 -15
gather
customer With the rise of Online and TV shopping channels, more traditional stores will be
behavior data removed to 550 offline stores by the end of 2021, renting space will keep lower
for R&D than 50 Square meter.
14WHAT ARE WE IN Q2 2021 FINANCIAL HIGHLIGHT BUSINESS UPDATE APPENDIX
TVC : GREAT PRICE
15WHAT ARE WE IN Q2 2021 FINANCIAL HIGHLIGHT BUSINESS UPDATE APPENDIX
Covid insurance WFH Bras : The comfiest bras for working from home
South East Life Insurance teams up with Sabina to In between all the hustle and fear of the pandemic, the unending work from home demands
create a special promotional campaign especially comfort clothing is raising. Sabina offers the comfiest seamless, wireless and non-padded bra
for Sabina customers, when spending 1,500 baht per styles for your everyday wardrobe and enjoy the new normal. You can feel the most
purchase, get a free Covid insurance. comfortable natural beauty bra .
16WHAT ARE WE IN Q2 2021 FINANCIAL HIGHLIGHT BUSINESS UPDATE APPENDIX
Premium Camisole New +Plus Size Panty for Plus Size Woman
To create the most comfortable outfit for in- Sabina new + Plus size panty for plus size women to feel the most comfortable from inside available
home workouts & exercise, lounging on the now both Sabina store and Sabina online.
couch, or as a sleeveless sleep shirt also
recommended.
17WHAT ARE WE IN Q2 2021 FINANCIAL HIGHLIGHT BUSINESS UPDATE APPENDIX
Maximizing Fit for Cloth and Medical Procedure Masks to Improve
Performance and Reduce SARS-CoV-2 Transmission and Exposure
Universal masking is one of the prevention strategies recommended by CDC to slow
the spread of SARS-CoV-2, the virus that causes coronavirus disease 2019 (COVID-19).
Sabina also has campaign to support customers using double masks for more
protection.
18WHAT ARE WE IN Q2 2021 FINANCIAL HIGHLIGHT BUSINESS UPDATE APPENDIX
Newness : Sabina x Esther Bunny Collaboration
Sabina team-up marks Esther Bunny’s first collection released in Thailand.
It is designed by Korean-American artist Esther Kim.
19WHAT ARE WE IN Q2 2021 FINANCIAL HIGHLIGHT BUSINESS UPDATE APPENDIX
Sabina promoted our OMNI channel by turning our offline
store PC to be online customer service to give any
assistance customers may need during a temporarily
closing of our stores in 29 provinces,
20WHAT ARE WE IN Q2 2021 FINANCIAL HIGHLIGHT BUSINESS UPDATE APPENDIX
FINANCIAL HIGHLIGHT
Q2 2021
SABINA PUBLIC COMPANY LIMITED
www.sabina.co.th 21WHAT ARE WE IN Q2 2021 FINANCIAL HIGHLIGHT BUSINESS UPDATE APPENDIX
Consistently growing top line Rapidly trending down SG&A to total revenue
THB mm THB mm
SG&A SG&A/Sales
44.1%
3,103 3,295 40.1% 37.4% 38.9%
2,914 35.5% 34.6% 35.3%
2,679
2,397 1,067 1,156 1,276
1,051 1,034
1,340 1,305
463 461
2016 2017 2018 2019 2020 1H 2020 1H 2021 2016 2017 2018 2019 2020 1H 2020 1H 2021
% YoY Growth
2016 2017 2018 2019 2020 1H 2020 1H 2021
4% 12% 16% 6% -12% -18.5% -2.6%
Strong GPM and steadily expanding EBIT margins Significantly expanding net profit and NPM
% EBIT Margin GPM THB mm Net Profit NPM
52.8% 51.6% 54.4% 11.7% 12.5%
50.9% 47.4% 48.5% 10.8%
45.9%
9.1% 9.5% 9.0%
7.3%
14.6% 15.9% 12.2% 13.7%
9.2% 11.4% 11.7%
362 413
176 243 277
121 141
2016 2017 2018 2019 2020 1H 2020 1H 2021 2016 2017 2018 2019 2020 1H 2020 1H 2021
% YoY Growth
2016 2017 2018 2019 2020 1H 2020 1H 2021
6.1% 38.4% 48.7% 14.3% -33.0% -39.6% 16.7%
22WHAT ARE WE IN Q2 2021 FINANCIAL HIGHLIGHT BUSINESS UPDATE APPENDIX
Working capital management
Days sales outstanding and account receivable turnover Days inventory outstanding and inventory turnover
DIO (Days) Inventory Turnover (Times)
8.1 8.3 8.0 1.4
7.5 7.7 1.2
7.1 1.1
1.0 1.0 1.0
49 51 47
45 44 46 374 355 358
297 328
255
2016 2017 2018 2019 2020 1H 2021 2016 2017 2018 2019 2020 1H 2021
DSO (Days) A/R Turnover (Times)
Account payable turnover days and account payable turnover Improving cash conversion cycle
Days
A/P Turnover Days (Days) A/P Turnover (Times)
12.4
11.0
8.9 8.9 8.4
8.0 382 373 376
296 331
41 46 41 43 258
33 29
2016 2017 2018 2019 2020 1H 2021 2016 2017 2018 2019 2020 1H 2021
23WHAT ARE WE IN Q2 2021 FINANCIAL HIGHLIGHT BUSINESS UPDATE APPENDIX
Healthy balance sheet with ample debt room to raise fund whenever it is needed
ROA ROE
Percent Percent
14.5 14.7
22.4
10.5 10.6 19.4
9.5
7.9 15.1 16.6
13.3
10.3
2016 2017 2018 2019 2020 1H 2021 2016 2017 2018 2019 2020 1H 2021
D/E EPS
Times
Total Equity Total Liabilities D/E
0.62
0.56
0.42 0.47
1.19
0.28 0.26 1.04
1,157 1,009 852 0.80
492 767 0.70
484
0.51
0.41
1,754 1,895 1,835 1,861 1,795 1,818
2016 2017 2018 2019 2020 1H 2021 2016 2017 2018 2019 2020 1H 2021
24WHAT ARE WE IN Q2 2021 FINANCIAL HIGHLIGHT BUSINESS UPDATE APPENDIX
With ability to consistently distribute cash to investors
Dividend
1.19
1.04
0.62 0.80
0.70 0.54
0.45
0.68 0.41
0.50 0.57
0.35 0.41
0.14
2017 2018 2019 2020 2021
EPS (Bt./share) 1st Half 2nd Half
2017 2018 2019 2020 2021
Dividend THB /
0.82 1.04 1.19 0.80 0.41
Share
Payout Ratio 117% 100% 100% 100% 100%
25WHAT ARE WE IN Q2 2021 FINANCIAL HIGHLIGHT BUSINESS UPDATE APPENDIX
BUSINESS UPDATE
SABINA PUBLIC COMPANY LIMITED
www.sabina.co.th 26WHAT ARE WE IN Q2 2021 FINANCIAL HIGHLIGHT BUSINESS UPDATE APPENDIX
Mother’s Day
Sabina launched special Mom’s giftset with premium face masks on Mother’s day.
27WHAT ARE WE IN Q2 2021 FINANCIAL HIGHLIGHT BUSINESS UPDATE APPENDIX
Expansion of product range
Sabina started to have special collaboration with top-brand to create more variety of products to Sabina’s customers. All the
brands that we collaboration has their own uniqueness about design and quality product.
28WHAT ARE WE IN Q2 2021 FINANCIAL HIGHLIGHT BUSINESS UPDATE APPENDIX
CSR : Continuing donation of cloth mask and lingerie to help Thai pass this pandemic
Sabina continue donates both our cloth mask and lingerie to worker camp that has been locked down,
Public school in Bangkok, Hospital for medical personnel etc.
29WHAT ARE WE IN Q2 2021 FINANCIAL HIGHLIGHT BUSINESS UPDATE APPENDIX
Output (million pcs.)
Output 2020 2021 %G
YS 3.20 2.97 -7%
CN 1.70 1.75 3%
BN 1.20 0.91 -24%
TP 1.20 1.05 -12%
S5 1.10 0.75 -32%
Capacity 8.40 7.43 -12%
• Production Capacity has been intentionally controlled to reduce to
-12% on this quarter to avoid the inventory piled up.
Manpower
Sewing Non ( sewing+PC ) PC
5,100
4,529
800 4,200
3,900 3,939
1,153 3,521 -418
1,200 1,073
1,900 1,100
959 -114
-114
1,618
1,400 1,450 1,423 -106
1,317 -106
2,400
1,400 1,550 1,758 1,443 -198
1,245 -198
2011 2013 2017 2019 2020 1H 2021
- The total number of employees have naturally decreased 418 positions since
the beginning of January 2021. Some employee would like to change their job
to do the food and parcel delivery during the Covid pandemic.
30WHAT ARE WE IN Q2 2021 FINANCIAL HIGHLIGHT BUSINESS UPDATE APPENDIX
Working capital and inventory management
GPM has sharply increased DIO (Days) Inventory Turnover (Times)
1.4
from 38.8% to 49.3% YOY 1.2
1.1
1.0 1.0 1.0
and from 47.6% to 49.3%
QOQ. 374 328 355 358
297 255
2016 2017 2018 2019 2020 1H 2021
• Inventory days still maintains at the similar level of 2020 despite the second Covid pandemic on Dec2020 to Jan2021
and the third Covid pandemic on mid Jun.
Production : Sourcing
82% : 18% 63% : 37% 54% : 46% 55% : 45%
2018 2019 2020 1H 2021
Produce Sourcing Sourcing Sourcing Sourcing
Produce Produce
GPM 50.4% GPM 58.9% GPM 58.6% Produce GPM 57.6% GPM 56.6%
GPM 53.3% GPM 44.3%
GPM 43.2%
GPM 51.6% GPM 54.4% GPM 47.4% GPM 48.5%
• 48.5% GPM of 1H has been improved from 47.4% GPM of ending 2020. GPM of out sourcing is still making
higher profit than self production despite the recent weaker Thai currency.
31WHAT ARE WE IN Q2 2021 FINANCIAL HIGHLIGHT BUSINESS UPDATE APPENDIX
ESG Principles
CSR : ESG
ENERGY MANAGEMENT (GRI 302-1, 302-4) CORPORATE SOCIAL RESPONSIBILITY MANAGEMENT
- Mother Jintana Foundation
WATER MANAGEMENT (GRI 303-2, 303-4, 303-5)
- Sewing Cup, Sewing Heart
PARTICIPATION IN CLIMATE CARE - AunJai Fund (Micro Finance)
(GRI 305-2, 305-5) - Factory Model
WASTE MANAGEMENT (GRI 306-2) - Covid Away Program
PRODUCTION RESPONSIBILITY SAFETY , OCCUPATINAL HEALTH AND WORKING
(GRI 301-1 , 301-2) ENVIRONMENT (GRI 406-1, 403-2, 403-4, 403-5, 403-6, 403-9)
HEMAN RIGHTS RESPECT (GRI 406-1, 412-1, 412-2)
FAIR BUSINESS PRATICES
- Code Of Conduct
- CAC (Collective Action Coalition Against Corruption)
32WHAT ARE WE IN Q2 2021 FINANCIAL HIGHLIGHT BUSINESS UPDATE APPENDIX
Corporate Culture
33WHAT ARE WE IN Q2 2021 FINANCIAL HIGHLIGHT BUSINESS UPDATE APPENDIX
APPENDIX
Q2 2021
SABINA PUBLIC COMPANY LIMITED
www.sabina.co.th 34Sabina at a Glance
Introduction to Sabina
◼ The leading Thai women underwear manufacturer #1 Thai lingerie brand in term of revenue
under the iconic Sabina brand, awarded Thailand’s Top
Corporate Brands in fashion sector for 5 consecutive years
◼ Strong distribution nationwide
with products sold across 585 POS, 106 shops in leading
department stores and discount stores together with sales
channels in TV and online channels
◼ Also has support from local distributors
In key regional markets including the Middle East, Asia
(Pakistan), and AEC (CLMV and Philippines)
◼ Manufacturing capacity of ~12 mm units
with ability to manufacture complex products that required high
skilled labor
Manufacturing footprint (1)
Yasothorn
5 mm/year
Burerum
1.5 mm/year
Chainat
2.4 mm/year
Thapra
1.7 mm/year
Sai 5
1.4 mm/year
35Sabina at a Glance
From OEM manufacturer to brand developer
Sale Report Brand and OEM (2007 - 2020)
2011: Thailand Great flood / Euro-zone crisis
2007-2008:Subprime 2010:UK Financial Crisis 2012: Minimum Wages hike to THB 300
97% 92% 91%
90% 91% 89% 89% 91% 91%
2,108 2,803
1,824 1,978 2,439 2,993 2,633
75% 1,911 2,044
65% 70%
1,459
55% 1,310
1,099
50% 50%
1,163 45%
959 994
903 35%
30%
551 25%
556 9%
441 11% 11% 9%
10% 9% 9% 8% 9%
185 200 242 250 216 220 287 287 265
2007 2008 2009 2010 2011 2012 2013 2014 2015 2016 2017 2018 2019 2020
OEM Sabina
% Gross Profit
26% 37% 37% 35% 44% 50% 51% 53% 52% 53% 51% 52% 54% 47%
% Net Profit Margin
6% 9% 4% 3% 3% 6% 5% 7% 7% 7% 9% 12% 12% 9%
1997-2005: No pricing ability with nominated supplier 2012-2020: Ability to command retail price with variety supplier
10% 90% 0% 69% 19% 9% 3%
BRAND OEM BRAND EXPORT BRAND NSR OEM BRAND EXPORT
36Sabina at a Glance
Wide product offering with ability to capture broad group of customers
Medium (THB1,000)
Children
(6-15 years)
Teens
(15-25 years)
Young women
(25-45 years)
Women
( > 45 years)
The products vary in prices to fit with different
target groups. The lowest price products are
distributed through modern trade, such as BigC
and Tesco Lotus. The middle price products,
which cost about 700-800 Baht, are distributed
throughout the country, including Doomm Series,
Wireless bras, and Modern V. For the top price
products under the brand Madmoiselle, Maggie
mae and Woonsen Collection, which cost over
1,000 Baht, are only distributed in big cities and
in Bangkok area only.
37Sabina at a Glance
Growth Strategy in 2021-2023
Key Drivers
◼ Customer centric product development
◼ Consistently introduce new products / collection that meet customers needs
◼ Backed by state-of-the-art marketing activities (plan to invest 3-4% of sales in marketing
activities)
◼ Store Optimization – selective store for each group of product
Sabina ◼ Price optimization
Brand ◼ Provide Omni-Channel experience for customer
◼ Wider and Exclusive assortment in online and TV channels
◼ Joint business plan with key partners to align sales & marketing plan
◼ Provide customer seamless Experience
NSR
◼ Personalized marketing campaign
◼ Stores expansion
◼ Sabina brand building
◼ Online and TV channels expansion
◼ Strengthen distributors
oversea
Export ◼ Channel expansion
◼ Wholesale expansion
◼ Product innovation ◼ Focus on high-end brand
OEM ◼ Maintain superb quality and on-time delivery ◼ Increase higher profit margin
Now
Looking Forward
Sales will be supported by both Sabina manufacturing capacity together with an increase in product sourcing from trusted sub-contractors
38Company Information
Business structure
Divisions operation of the company policy Shareholding pattern
39Company Information
Company mile stones
Originally, the business of manufacturing and
distributing OEM products of the company
was the production and distribution for
subsidiaries which received production orders
from another customer. Since the subsidiary
has been operating for a long time and is
known to foreign customers more than
domestic ones. When the company became
well-known to foreign customers, it began to
sell OEM products directly to customers.
So the production for lingerie distributors
overseas is the main revenue proportion.
However, after the company changed its
policies concerning reducing the proportion
of OEM production and distribution since
2008, resulting in the company's main
revenue proportion coming mainly from the
production and distribution of products to
the subsidiary under the brand "Sabina".
40Company Information
Message from Chairman The Thai economy in 2019 did not look good, resulting from the decelerating trend in 2018. The GDP at the beginning of
the year was expected to be approximately 3.8 % but ended up at 2.4%. The first half of 2019 saw a rather promising
growth of the Thai economy; however, second half of the year saw a decline in agricultural prices, drought, and heavy
rain at the end of the year, causing floods in the north and northeast regions.
Despite the recession, due to the expansion of distribution channels customized for the current buying habits of consumer
s, Sabina Public Company Limited was able to perform well in 2019, in which its sales revenue had increased by 6.2
percent, resulting in total sales revenue of 3,295 million baht, which was higher than the previous year's sales revenue of
3,103 million baht, resulting in a 14.3% higher profit than the previous year and net profit of 413 million baht, which was
higher than the previous year's net profit of 51 million baht. For this reason, the Board of Directors has resolved to pay
dividends of 1.19 baht per share. However, since the Board of Directors has passed a resolution to pay interim dividends
in the amount of 0.57 baht per share, it is appropriate to propose to the general meeting of shareholders on April 23,
2020 for further dividend payment at the rate of 0.62 baht per share, which will be paid on 22 May 2020
In 2020, the company is planning to increase its sales revenue and expand its customer base by offering new distribution
channels that are easily accessible, faster delivery by adjusting the inventory and shipping system to be more efficient,
new innovative products to meet the needs of consumers, clear marketing communication, and the marketing budget
for maximum efficiency. Exports produced under the CLMV companies' brand are likely to increase due to the reliability
of the quality and the Sabina brand of the company.
In 2019, the company operated its business by abiding by the principles of good corporate governance and continuously
recognizing the importance and responsibility of shareholders and interested parties of the company. In 2019, the
company was evaluated by the Thai Institute of Directors (IOD) and placed at the level of "excellent".
In 2019, the company put a great emphasis on the importance of projects and activities based ESG (Environmental,
Social, Governance) and the philosophy of "Society Lives. People Survive. Employees and Companies live a sustainable
Life", by implementing former projects and maximizing their benefits such as Breast Implant Project that is focused on
breast donation to those undergoing mastectomy because of breast cancer, Zero Waste Project emphasized on usage
of traditional wisdom to make products out of waste materials, and Micro Finance aimed at helping employees with
large debts.
On behalf of the Board of Directors, executives, employees, the company will be dedicated to conducting its business
under the principles of good governance in order to create sustainability for the organization. Thank you to all shareholder
s, customers, business partners, as well as all interested parties, for the trust and confidence that you have given to the
company all along. Finally, we are so proud to have received the Set Award in the Out Standing Performance category for
2019 as well. 41Company Information
Vision and Mission
Vision
The company operates under the
concept of “Create Value with
Innovation” aim to build Sabina lingerie
brand integrity with new innovations as well as
modern fashion, accepted quality, consist and
fits with the needs of all women in all countries
and along with social responsibility.
Partners: Productivity: Planet:
People: Product:
Mission Trust and Reliable Innovation through productivity Return Benefit to Society
Trust and Worthiness in Delivered products beyond
Enterprise by advance mechanism and Environment
human as precious resources expectation
The company has a mission to People: The company believes Product: The company will Partners: The company Productivity: The company will Planet: The company is
operate in accordance with the will manage and operate manage production by using still committed to
that employees are valuable produce product’s quality to
vision structured in order to gain trust and production management business conducting by
human resources because they meet with expectations of
confidence from partners methods, production technology, returning profits to
under the concept of operations are an important factor enables customers. By using research,
or those related to the production innovation Including society and the
which are separated into the company to achieve its develop new innovations for
modern machinery used in environment.
goals and objectives. Therefore, products that will meet the company in every aspect
various parts as follows. giving importance to taking care needs of women of all ages. such as shareholders, production. In order to get
of all employees, every position employees, customers, standardize quality products
is like a valuable resource of the creditors, and competitors. and approve by every customer
company. in every country.
42Company Information
Awards
43Company Information
Awards
44Company Information
Awards
45Company Information
Organization Chart
46Company Information
Board of directors
47Sabina Fareast Co., Ltd. Telephone : IR Contact :
Address : 02-422-9400 Telephone :
12 Arun Amarin Road, Arun Amarin 02-009-9999
Sub-District , Bangkok Noi District, Fax : E-mail :
Bangkok 10700 02-434-5911 ir@sabina.co.th
48You can also read