Opportunities Offered by Northeast Electricity Markets for Canadian Wind Projects - October 2016
←
→
Page content transcription
If your browser does not render page correctly, please read the page content below

Opportunities Offered by Northeast Electricity
Markets for Canadian Wind Projects

                                       October 2016

                                                      www.poweradvisoryllc.com

Power Advisory LLC 2016. All Rights Reserved.         Prepared for CanWEA
Content & Contact

     •   Executive Summary                                  Prepared for CanWEA
     •   Introduction                                              October 2016
     •   Market Basics: ISO-NE
     •   New England Renewable Energy                                John Dalton
         Requirements                                              978-369-2465
     •   Market Basics: NYISO                       jdalton@poweradvisoryllc.com
     •   New York Renewable Energy
         Requirements
                                                              212 Thoreau Street
     •   Economics of Wind in Atlantic
         Canada                                              Concord, MA 01742

     •   Ensuring Opportunities for Wind               www.poweradvisoryllc.com

Power Advisory LLC 2016. All Rights Reserved.   2
Introducing Power Advisory

    •   Power Advisory LLC (Power Advisory) is an electricity sector focused management consulting firm. We
        specialize in electricity market analysis and strategy, power procurement, policy development, regulatory and
        litigation support, market design, and project development and feasibility assessment, focusing on North
        American electricity markets.
    •   Our clients include state, provincial and federal governments, public utility regulators, consumer advocates,
        electricity generators (both renewable and conventional), investors, electricity transmission companies, and
        electricity distribution companies.
    •   With offices in Toronto, Metropolitan Boston, and Calgary, a major area of focus is Canadian-US electricity
        trade.
    •   Sample projects include:
            •   Advised the Massachusetts Clean Electricity Partnership, which included HQ Energy Services (U.S.) Inc., on the benefits of
                proposed legislation to import 18.9 TWh per year of clean electricity into New England.
            •   Advised the Atlantic Canada Opportunities Agency on the opportunities offered by the U.S. Northeast for the export of
                clean and renewable energy from Atlantic Canada.
            •   Advising Natural Resources Canada on its Regional Electricity Cooperation and Strategic Infrastructure Initiative, which is
                focused on identifying the most promising regional electricity infrastructure projects with the potential to achieve significant
                greenhouse gas reductions.
            •   Completed for Natural Resources Canada a comprehensive analysis of existing Renewable Portfolio Standard (RPS)
                programs in the US and a broader continental RPS, which would encompass Canada and the US. The study modeled the
                potential for increased renewable energy trade between the Atlantic and New England based on an assessment of which
                renewable resources (Canadian hydro, Canadian wind or New England wind) would be able to most cost effectively satisfy
                forecast RPS demand. After forecasting the relative cost of these resources, the study quantified the level of increases in
                trade, the savings that would be generated and evaluated the proportion of US RPS demand that would be satisfied by
                Canadian renewable energy exports.

Power Advisory LLC 2016. All Rights Reserved.                             3
Executive Summary

Power Advisory LLC 2016. All Rights Reserved.   4
Executive Summary
New England has significant requirements for additional
clean energy
    • All six New England states have renewable portfolio standards (RPS). Renewable Energy Credits
      (RECs) are used to ensure compliance with RPS. Class I RECs are among the most valuable and
      wind generation from Quebec and the Maritimes is an eligible Class I resource in each New England
      state.
            •   Of the New England states, only Vermont counts large-scale hydro as a Class I resource.*
            •   Many New England states require that Class I resources be located in adjacent control areas. This precludes
                wind generation from Ontario participating.
            •   There are special requirements for resources that aren’t located in New England.
    • The increase in Class I resource demand in New England from 2015 to 2025 is about 8.8 TWh,
      representing about 2,500 MW of wind.
            •   Rhode Island extended the period over which its Class I RPS requirements increase to 2035 in the most
                recent legislative session. The Massachusetts Legislature considered doubling the rate of increase in its Class
                I RPS, but failed to do so. Some observers expect such action in the next legislative session.
    • Satisfying this Class I demand is becoming increasingly difficult given the distance between
      favorable locations for wind projects and Southern New England load centers and increasing
      transmission congestion where wind projects are being developed.
            •   The New England states are pursuing alternatives to support the funding of required transmission projects to
                deliver this renewable energy to Southern New England load centers. This will increase the cost of these
                projects and help offset a disadvantage to Canadian clean energy resources.

Power Advisory LLC 2016. All Rights Reserved.                    5
Executive Summary
Massachusetts recently increased its requirements for
clean energy
    •   In addition, Massachusetts enacted legislation calling for 9.45 TWh per year of clean energy generation. Under this
        legislation clean energy generation includes large scale hydro as well as Class I renewable resources.
            •   This 9.45 TWh of clean energy isn’t necessarily in addition to the 8.8 TWh of Class I resources given that any Class I resources
                used to satisfy the clean energy mandate would also address Massachusetts Class I requirements.
            •   The greater value offered by the RECs produced by Class I renewable resources would be recognized, allowing for a higher price
                for wind generation from Eastern Canada relative to large scale hydro.
    •   The legislation also specifies that preference will be given to proposals that combine new Class I renewable
        portfolio eligible resources and firm hydroelectric generation. This suggests that adding wind generation to
        hydroelectric generation will yield additional value beyond the value of the Class I RECs.
    •   Wind generation would offer additional value relative to hydro given the state’s requirements for an additional 4.4
        TWh of Class I generation. The incremental value of Class I RECs amounts to about US$35 to US$50/MWh.
            •   Current Class I REC prices in New England range from $32 to $38/MWh, but are expected to increase with the loss of the
                Production Tax Credit, which will increase the effective cost of wind generation, the predominant form of new Class I generation
                in New England.
    •   In addition, the New England states as part of The Conference of New England Governors and Eastern Canadian
        Premiers have agreed to cut CO2 emissions to as much as 45% below 1990 levels by 2030. This will require
        additional volumes of clean energy, with the actual volume depending on electricity demand growth and the future
        composition of electricity resources.

Power Advisory LLC 2016. All Rights Reserved.                             6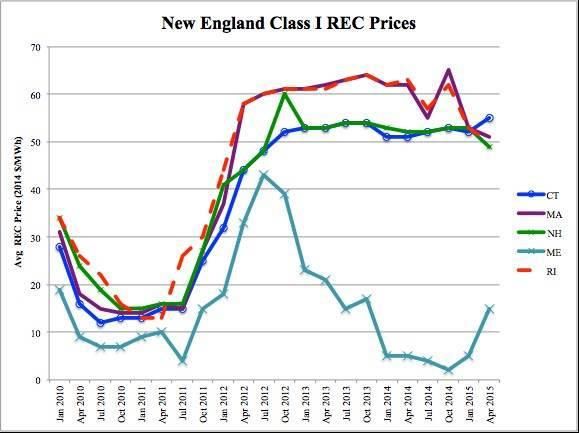
Executive Summary

New York also has ambitious renewable energy goals

         • New York’s State Energy Plan established a goal that 50% of the state’s electricity be
           generated by renewable energy sources by 2030 (“50 by 30” goal)
         • With renewables providing about 26% of the state’s existing electricity requirements,
           this would require an increase in renewable energy of over 30 TWh by 2030.
         • To achieve this aggressive target the state is pursuing a range of programs including:
                 • Creating a requirement for regular Renewable Energy Certificate (REC) procurements.
                   These are forecast to represent an incremental demand for RECs of over 7 TWh per year by
                   2021, the last year for which the Public Service Commission has established a target. With
                   increases beyond this in future years.
                 • The Public Service Commission is currently only proposing to procure RECs, developers will
                   have to bear the risks of the market price for energy or hedge this risk with a third-party.

Power Advisory LLC 2016. All Rights Reserved.               7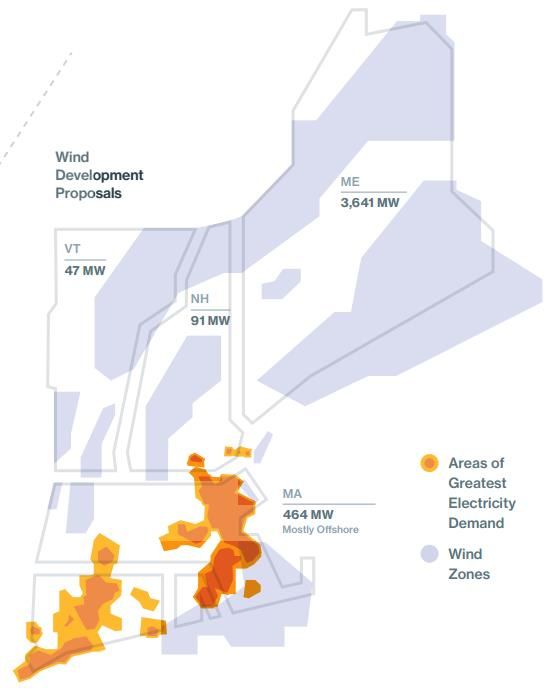
Executive Summary
Both New England and New York have significant
need for additional renewable resources

           • As shown the six New England states are forecast to have                                   2015 to 2025 Incr.
             a need for an additional 8.8 TWh per year of renewable                    State            Class I Demand (TWh)
             energy from 2015 to 2025.                                                 Connecticut                           2.1
                   •   This is largely in addition to the 9.45 TWh per year of clean   Maine                                 0.2
                       energy that Massachusetts electric distribution companies       Massachusetts                         4.4
                       are mandated to procure under recent legislation.               New Hampshire                         0.9
                                                                                       Rhode Island                          1.0
                   •   Class I resources that are used to satisfy the 9.45 TWh of
                       clean energy would also assist Massachusetts in realizing its   Vermont                               0.2
                       4.4 TWh Class I resource target. Therefore, the 9.45 TWh      Total                                   8.8
                       and 8.8 TWh are not necessarily additive.
           • New York has an incremental demand for Tier 1
             resources of about 7.5 TWh per year by 2021 and 30                                       Incr. Tier 1 Demand
             TWh per year by 2030.                                                                   2017 to 2021 By 2030
                                                                                        New York     7.5 TWh     30 TWh
                   •   Tier 1 resources are required to have achieved commercial
                       operation after January 1, 2015.

Power Advisory LLC 2016. All Rights Reserved.                      8
Executive Summary
The attractiveness of opportunities for US
Northeast electricity markets vary by province

           • As discussed, increasing requirements for clean energy in both New England and New
             York are creating opportunities for wind projects in Quebec, Atlantic Canada and
             Ontario.
           • Wind projects in Quebec have ready access to either New England or New York given
             Hydro-Quebec TransEnergie interconnections with both.
           • Given transmission interconnections and tariffs, New England represents the primary
             opportunity for wind projects in Atlantic Canada.
                   •   Hydro-Quebec transmission tariff at $Cdn8/MWh is costly for Atlantic Canada projects wheeling
                       to New York.
           • New York is an opportunity for wind projects in Ontario given the interties between
             these two markets. New England REC requirements typically require that projects be in
             adjacent control area, precluding Ontario wind from participating in the New England
             REC market. Access to New England from Ontario is also adversely affected by the
             relatively high cost of transmission access through Quebec and the difficulties of
             wheeling through New York to access New England.

Power Advisory LLC 2016. All Rights Reserved.                   9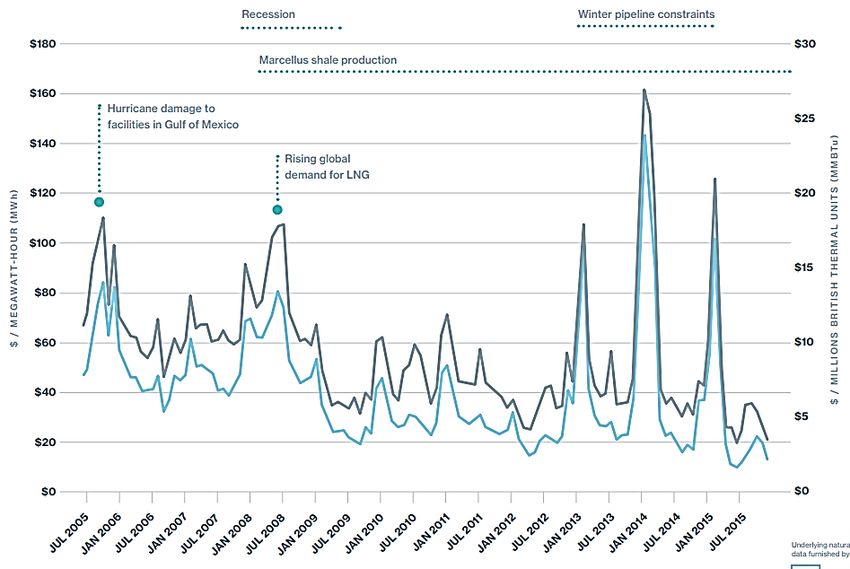
Introduction

Power Advisory LLC 2016. All Rights Reserved.   10
Introduction

Overview of Scope of Project

           • Power Advisory engaged by CanWEA to review
             opportunities offered by the US Northeast for Canadian
             wind projects
           • We proposed to undertake a review of three primary issues
                   • Review specific market opportunities in New England and
                     New York for Eastern Canadian wind projects
                   • Evaluate business case for wind project development in
                     Eastern Canada for export into US Northeast
                   • Assess requirements for Eastern Canadian wind projects to
                     participate in US Northeast electricity markets
                   • Identify approaches that could be used to allow Canadian
                     wind projects to participate as consortium members with
                     Canadian hydro suppliers and transmission project
                     developers

Power Advisory LLC 2016. All Rights Reserved.   11
Market Basics: ISO-NE
Factors Contributing to the Need for Additional Clean Energy
Power Advisory LLC 2016. All Rights Reserved. 12Market Basics: ISO-NE
Demand forecast
• New England energy demand is forecasted to decline by 0.2%
annually, from 128,014 GWh in 2016 to 125,213 GWh in 2025.
• Peak demand is forecasted to grow 0.2% annually under normal
weather conditions
• Energy efficiency and distributed generation will flatten demand
and slow peak demand growth
• Without it, energy and peak demand growth rates would be 1.0% and
1.1% respectively
• The New England states have ambitious, well funded and highly rated
energy efficiency programs
• The penetration of rooftop solar is also reducing customer
requirements
Power Advisory LLC 2016. All Rights Reserved. 13Market Basics: ISO-NE
New England’s electricity market is highly reliant on
natural gas
• Natural gas-fired generation 2015 ISO-NE Resource Mix
provided almost 50% of the
Hydro & Other Renewables, 15%
region’s total generation in Pumped Storage, 1%
2015
• Nuclear generation provides
about 30% of total Oil, 2%
generation and represents Coal, 4%
the largest single source of
clean energy. However, it is Natural Gas, 49%
under increasing pressure
Nuclear, 30%
• Renewables (including
hydro) represent about 15%
• Oil and coal-fired generation
have declined significantly
and total about 6%
Power Advisory LLC 2016. All Rights Reserved. 14Market Basics: ISO-NE
Electricity market driven by natural gas
Percent of Total Electric Energy Production by Fuel Type
49%
44%
34%
31% 30%
22%
18%
15%
7% 8% 7% 8% 9% 9%
5% 4%
1% 2%
Nuclear Oil Coal Natural Gas Hydro Renewables
2000 2014 2015
• Natural gas increased from 15% in 2000 to almost 50% in 2015
• 80% of capacity built since 1997 and more than 60% of new proposed generation (about
8,200 MW) relies on natural gas
• Natural-gas-fired generators set real-time electricity prices 75% of the time in 2015
• The modest increase in renewables is attributable to a decline in energy output of biomass
units from 2000 to 2014-15, which has been offset by increased production from wind,
solar and hydro resources
Power Advisory LLC 2016. All Rights Reserved. 15Market Basics: ISO-NE
Natural gas contributes to electricity price volatility
• Natural gas pipelines serving New England
are constrained throughout much of the
winter given increasing demands and
reduced supplies from Atlantic Canada.
• With limited pipeline capacity on cold winter
days gas-fired generators compete with local
gas distribution companies for natural gas
supplies. This can lead to very high prices.
• A major contributor to the inadequate
pipeline capacity is the unwillingness of
natural gas-fired generators to contract for
firm pipeline supplies.
• Recent reductions in oil prices have
moderated the impact of natural gas prices
on electricity prices in New England. Two
factors have contributed to this: (1) dual-
fuel units with oil burning capability are now
cost competitive when burning oil; and (2) Source: ISO-NE
lower oil prices have also reduced prices in
Natural gas prices and wholesale electricity prices
the World LNG market, which has increased
LNG deliveries to New England and lowered are closely linked
LNG prices.
Power Advisory LLC 2016. All Rights Reserved. 16Market Basics: ISO-NE
Natural gas infrastructure inadequacy affects the
fuel mix
• During most of the winter, existing pipelines
in the New England region are running at or
near maximum capacity
• As natural gas demand approaches pipeline
capacity natural gas prices increase. As
natural gas prices increase oil-fired
resources are used to meet demand
• Over 30% of ISO-NE’s gas-fired capacity is
dual-fuel
• These conventional resources are older and
more expensive to run
• At lower natural gas prices, natural gas-fired
generation is typically cheaper than coal-
fired generation. New England’s coal-fired
units have higher coal costs given
transportation costs and environmental
requirements for low sulphur content.
Source: ISO-NE
• Switching to conventional fossil fuel
resources is problematic due to increasingly A comparison of the differences in fuel mix during an average day
stringent GHG emission requirements and a cold winter day
Power Advisory LLC 2016. All Rights Reserved. 17Market Basics: ISO-NE
Natural gas pipeline constraints affect natural gas
prices
Algonquin Citygate Basis to Henry Hub
• The figure to the right shows the ($/MMBtu) versus Pipeline Utilization Rates
resulting increases in Algonquin basis
differential (the premium paid by
customers in New England) as pipeline
utilization increases.
• Proposals to expand pipeline capacity
to New England are receiving
increasing opposition.
• The Massachusetts State Supreme
Court voided a Mass Department of
Public Utilities decision that allowed
electric utilities to contract for
additional natural gas pipeline
capacity to lower electricity prices.
Source: ICF
• Spectra Pipelines, Eversource and
National Grid had proposed the
Access Northeast pipeline expansion Prices increase at higher pipeline
project to provide an additional 9.25 utilization levels
MMcf/day of capacity.
Power Advisory LLC 2016. All Rights Reserved. 18Market Basics: ISO-NE
Non-gas capacity retirements are increasing,
exacerbating natural gas constraints
• Current low natural gas prices are
driving down wholesale electricity
prices, displacing higher cost non-
natural gas-fired resources
• Older less efficient plants are often
unable to recover the costs of
maintaining their plants and in some
instances can’t afford the costs of
environmental compliance
technologies necessary to meet new
environmental requirements
• More than 4,200 MW has or will be
retiring soon
• Another 6,000 MW is at risk
• ISO-NE estimates that about 30% of
the region’s generating capacity is at Source: ISO-NE
risk of retiring by 2020
Most of the retiring capacity will be replaced by new natural gas
capacity, however, these non-gas resources are necessary
during the winter when gas resources are limited
Power Advisory LLC 2016. All Rights Reserved. 19Market Basics: ISO-NE
Low wholesale electricity prices contributing to
nuclear unit closures
• The Vermont Yankee nuclear plant (620 MW) closed in 2014 and Pilgrim nuclear plant
(680 MW) is scheduled to close in 2019. These two units provided about 10 TWh of
carbon-free electricity and about 8% of New England’s total electricity requirements.
• The Massachusetts legislative requirement to procure 9.45 TWh per year of clean energy can be
viewed as a response to these closures.
• New England’s GHG emissions increased in 2015 for the first time in 5 years as a result of
the closure of Vermont Yankee. The loss of both nuclear units makes it more difficult for
the region to satisfy its Regional Greenhouse Gas Initiative (RGGI) emission reduction
targets.
• RGGI is a cooperative effort to cap and reduce CO2 emissions from the electricity sector.
Participating states use a cap and trade framework under which all large fossil-fueled
generators in the participating states have to hold allowances equal to their CO2
emissions over a three-year period. Allowances can be obtained through quarterly
auctions or offsetting CO2 emissions outside the electricity sector. The RGGI CO2 cap
declines 2.5 percent each year from 2015 to 2020.
Power Advisory LLC 2016. All Rights Reserved. 20Market Basics: ISO-NE
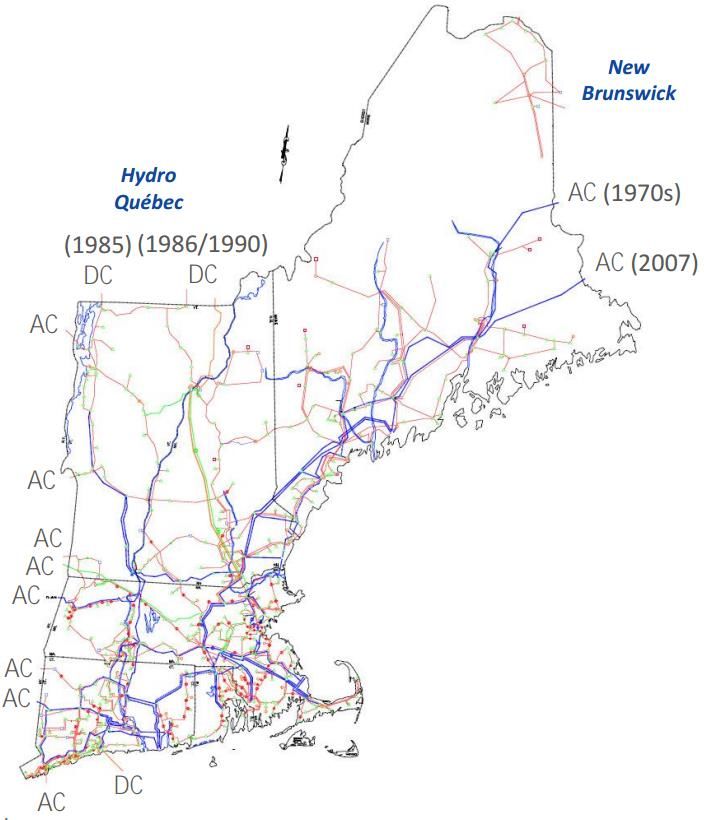
New England Energy Import Capability
Quebec-New England
(Phase II):
1,400 MW*
Quebec-New England Maritime - New England:
(Highgate): 1,000 MW
217 MW
New York - New England
[8 AC ties]: 1,400MW
Cross-Sound Cable :
*Capacity import capability
330 MW
Source: Adapted from ISO-NE “Overview and Regional
Update” 2015 Slide 6
Power Advisory LLC 2016. All Rights Reserved. 21Market Basics: ISO-NE
Imports into New England
Net Flow over the External Ties (GWh)
5000
0
-5000
-5539
-10000
-10142
-15000 -12648
-20000
-18961
-20696 -20997
-25000
2010 2011 2012 2013 2014 2015
Total New Brunswick Hydro-Quebec New York
Source: ISO-NE
New England will continue to attract imports given the
availability of low variable cost energy in Eastern
Canada, primarily from Hydro-Quebec.
Power Advisory LLC 2016. All Rights Reserved. 22New England Renewable
Requirements
Power Advisory LLC 2016. All Rights Reserved. 23Renewable Energy Requirements
New England State RPS
• Renewable Portfolio Standards (RPS) are State Class I REC Requirements (in GWh)
state-determined regulatory mandates that 25,000
require a minimum percentage of retail
customer electricity requirements to be 20,000
served using renewable energy
• RPS use Renewable Energy Credits (RECs) for 15,000
compliance
10,000
• Each REC is equivalent to 1MWh generated
from a renewable resource
5,000
• The highest value RECs (other than those for
solar PV) are Class I RECs -
2015 2016 2017 2018 2019 2020 2021 2022 2023 2024 2025
• The demand for Class I RECs is forecast to
CT ME MA NH RI VT
grow by almost 9 TWH by 2025
• Satisfying this demand is becoming
increasingly difficult given the distance
between favorable locations for wind Of the New England states, only Vermont counts large-
projects (i.e., Maine) and Southern New
England load centers and increasing
scale hydroelectricity in its Class I RPS*
transmission congestion where wind projects
are being developed.
• Permitting wind projects has always been * Connecticut allows large-scale hydro projects to satisfy its
difficult in New England. Class I RPS targets if a shortage of Class I RECs is deemed
to exist.
Power Advisory LLC 2016. All Rights Reserved. 24Renewable Energy Requirements
Class I Renewables vary by state
Ocean
Geoth- Landfill Anaerobic Thermal, Small Large
State Wind Solar Fuel Cells Biomass
ermal Gas Digestion Wave, Hydro Hydro
Tidal
Connecticut Certain run- Low
✓ ✓ ✓ ✓ ✓ ✓ ✓ X
of-the-river emission
Maine < 100 MW,
✓ ✓ ✓ ✓ ✓ X ✓ X ✓
fish passage
Massachusetts New,Renewable Energy Requirements
Wind generation represents majority of new renewables
in ISO-NE
• Currently over 800 MW of wind capacity
and 4,200 MW of proposed wind
capacity
New England Proposed Generation
• Approximately 13,000 MW total
proposed generation in the ISO-NE 6%
Generation Interconnection Queue
• Wind resources are far from demand 30%
centers, therefore increased wind
generation will require significant
64%
transmission upgrades
• ISO-NE market structure has required Natural Gas Wind Other
that wind project developers pay for
most required transmission upgrades.
Difficult to get wind project developers
to band together to support such
upgrades
Of the approximate 4,200 MW of proposed wind capacity in the
• Tri-State Clean Energy RFP provided a ISO-NE interconnection queue, about 3,600 MW is located in
mechanism to allow for the Maine. However, Maine’s transmission system is increasingly
consideration of necessary transmission congested, and will require upgrades to accommodate this
additional wind generation.
developments
Power Advisory LLC 2016. All Rights Reserved. 26Renewable Energy Requirements
Large hydro doesn’t qualify as a Class I resource for most
New England States
• The Class I RPS
eligibility criteria are
shown in the table to
the right.
• Many states limit the
size of hydro projects
to no more than 30
MW.
• Hydro projects would
realize a higher
capacity value and
corresponding capacity
payments and those
with storage capability
can target output to
higher priced periods.
Power Advisory LLC 2016. All Rights Reserved. 27Renewable Energy Requirements
Massachusetts Energy Bill
• Passed MA Legislature July 31, 2016
• Calls for the procurement of 1.6 GW of offshore wind by 2027 and 9.45 TWh/year of clean energy
generation by 2022
• Clean energy generation includes:
• Firm service hydroelectric generation
• New Class I RPS eligible resources firmed up with firm service hydroelectric generation
• New Class I RPS eligible resources
• Competitive solicitation process to be used to select proposals. Allows multiple solicitations, but Power
Advisory expects state to issue one solicitation for clean energy generation to enhance competitive pressure
• The following criteria to be used when procuring clean energy:
• Enhance electricity reliability
• Help reduce winter electricity price spikes and guarantee energy delivery in the winter months
• Be cost effective to ratepayers, including economic & environmental benefits
• Mitigate transmission costs; any overruns are not borne by ratepayers
• Demonstrate project viability in a commercially reasonable timeframe
• Allow resources to be paired with energy storage systems
• Mitigate environmental impacts and promote economic development in Massachusetts, if possible
• The legislation also indicates that preference will be given to proposals that combine new Class I renewable
portfolio eligible resources and firm hydroelectric generation. This suggests that adding wind generation to
hydroelectric generation will yield additional value beyond the value of the Class I RECs.
Power Advisory LLC 2016. All Rights Reserved. 28Market Basics: NYISO
NYISO is responsible for administering the organized electricity
markets that operate in New York State
Power Advisory LLC 2016. All Rights Reserved. 29Market Basics: NYISO
Demand Forecast
Electric Energy Usage Trends in New York State: 2000-2026
Source: NYISO Power Trends 2016
• Electricity demand is forecasted to decline by 0.16% annually over the next
decade due to energy efficiency and distributed energy resources
• Peak demand is forecasted to grow 0.21% annually
Power Advisory LLC 2016. All Rights Reserved. 30Market Basics: NYISO
New York’s electricity market is also highly reliant
on natural gas
2015 NYISO Resource Mix
• Natural gas (including
Natural Gas,
dual fuel) make up 7%
44% of the state’s Hydro &
energy production Other
Renewables,
and 69% of the 24%
downstate region’s Natural
energy production Gas/ Oil,
37%
• Natural gas-fired
projects represent Oil, 1%
Coal, 1%
about 65% of all
Nuclear,
proposed generating 31%
capacity in New York
Power Advisory LLC 2016. All Rights Reserved. 31Market Basics: NYISO
New York electricity market in flux given low wholesale
electricity prices and resulting retirements
• Due to recent low natural gas prices, wholesales electricity prices hit a 15-year low in
2015
• About 2,300 MW of New York’s generation capacity is planning to retire or suspend operation
between 2016 and 2018. This includes 1,435 MW of nuclear capacity, which is located Upstate
• New York has developed a Clean Energy Standard to promote the development of additional clean
energy and to support the state’s nuclear generating units
• The electricity market’s ability to respond to these changes is hampered by transmission
constraints
• Increasingly stringent environmental quality goals, such as the Clean Energy Standard
and stayed federal Clean Power Plan, represent new challenges to existing generation
• NYISO estimates that 75 – 80% of the system’s generating capacity will be affected by new and
proposed environmental regulations including the Clean Power Plan and a diverse set of
environmental regulations such as control technology requirements for nitrogen oxides (NOx),
mercury from coal plant emissions, interstate transportation of air emissions
• The impacts of these requirements will vary and are likely to result in additional capital expenditures for
affected units and higher operating costs. These requirements aren’t likely to result in a significant
increase in renewables beyond that already called for.
Power Advisory LLC 2016. All Rights Reserved. 32Market Basics: NYISO
Transmission is a challenge as well as an opportunity
• About 58% of the State’s electricity is used downstate (New York City, Long Island, Lower
Hudson Valley) while only 40% of the generating capacity is located downstate
• The disconnect between where generation and demand are located causes many existing transmission
facilities to be heavily loaded
• 80% of NYISO’s 11,124 miles of transmission lines went into service before 1980, meaning
about 4,700 miles will require replacement or upgrades within the next 30 years
• Increasing transmission capability across the state can also help enable clean energy
• All of New York’s existing and proposed wind projects and its major hydro resources are located far
from demand centers in the northern and western regions of the state
• The interties that Canadian resources access are also far from the high demand regions
• Transmission congestion in Western New York is contributed to by increasing imports from Ontario
• Several merchant transmission projects have been proposed to address transmission
constraints and develop additional clean energy downstate
• The Champlain Hudson Power Express is the most developed and has the vast majority of its required
permits. It has stalled given low natural gas prices which have depressed the price differentials that drive
such projects.
• Champlain Hudson Power Express is a high voltage direct current transmission that would deliver 1,000 MW into
New York metropolitan area from Quebec.
Power Advisory LLC 2016. All Rights Reserved. 33Market Basics: NYISO
Nuclear decommissioning in New York’s future
New York State Nuclear Generation Plants
Plant Name Location Nameplate Operating Notes
Capacity License
(MW) Expiration
Indian Point, Unit 2 Buchanan NY 1,032 9/28/2013 Operating under “timely renewal”
until NRC makes final ruling on
license renewal application
Indian Point, Unit 3 Buchanan NY 1,051 12/12/2015 Same as Indian Point Unit 2
James A. FitzPatrick Scriba NY 838 10/17/2034 Was set to cease operation
January 2017, but sale to Exelon
appears to be moving forward.
However, sale depends on CES
being adopted and final terms
Nine Mile Point, Unit 1 Scriba NY 621 8/22/2029 Exelon Corp. has discussed
financial struggles, mentioning
need for support, though it has
not discussed early
decommissioning formally
Nine Mile Point, Unit 2 Scriba NY 1,140 10/31/2046 Same as Nine Mile Point Unit 1
R.E. Ginna Ontario NY 610 9/18/2029 Operating under reliability
support services agreement with
NY PSC, in effect until April 2017
Source: Information Digest 2015 – 2016, US Nuclear Regulatory Commission, Appendix A
• All 6 of New York’s operating nuclear plants are facing financial– and some, regulatory– struggles
• The potential retirement of the two nuclear plants at Indian Point Energy Center are a particular reliability concern, as their
loss would require 500 MW of new capacity to be built in the demand-heavy region of Southeast New York
• Having passed their license expiration dates, the plants are currently operating under “timely renewal”, though due to numerous
safety and environmental concerns, license non-renewal is possible.
Power Advisory LLC 2016. All Rights Reserved. 34New York State Renewable
Requirements
The Clean Energy Standard
Power Advisory LLC 2016. All Rights Reserved. 35Clean Energy Standard
New York mandates ambitious renewable energy goals
through the Clean Energy Standard (CES)
• Following the expiration of New York’s Renewable Portfolio Standard in 2015, the
Department of Public Service (DPS) was directed to develop a standard that
mandates the State Energy Plan (SEP) goal that 50% of the state’s electricity is
generated by renewable energy sources by 2030 (“50 by 30” goal)
• This is a strategy to reach the broader goal of reducing statewide greenhouse gas
emissions by 40% by 2030
• The Clean Energy Standard was adopted on August 1, 2016 with the following goals:
• Encourage consumer-initiated clean energy purchases or investments through program
and market structures
• Obligate load serving entities (LSEs) to financially support new renewable generation
resources to serve their retail customers
• Create a requirement for regular REC procurement solicitations
• Obligate distribution utilities on behalf of all retail customers to continue to financially
support the maintenance of certain existing at-risk small hydro, wind and biomass
generation facilities
• Obligate LSEs to financially support the preservation of existing zero-emissions at-risk
nuclear facilities to serve their retail customers
Power Advisory LLC 2016. All Rights Reserved. 36Clean Energy Standard
CES will require significant changes
• To fulfill this goal, it is estimated that New York will need to
increase energy from renewable resources by 33,700 GWh from
current levels
• NYISO equates this to about 25,000 MW of solar PV, 15,000 MW of wind,
or 4,000 MW of hydropower
• The Department of Public Service (DPS) Staff CES Cost Study,
released in May, found material internal transmission constraints
in Ontario and thus concluded that much of the supply from
northern and western Ontario, especially if located within or
blocked from getting through the Toronto area, was inaccessible
to New York without additional transmission capacity.
Furthermore, currently, all interties carrying energy from Quebec
to New York are fully utilized in most hours.
Power Advisory LLC 2016. All Rights Reserved. 37Clean Energy Standard
The CES builds on existing initiatives
• The CES builds on the regulatory and retail market changes
that are already being pursued under the state’s Reforming
the Energy Vision (REV) initiative
• Through REV, New York has formed various initiatives that
work to reduce the soft costs and other market barriers facing
renewable energy, support energy efficiency in buildings, help
finance distributed energy, integrate advanced storage and
load control technologies into the electricity system and more.
• Whereas REV will continue to support distributed resources
and their integration into the grid, the CES will provide the
broader scale and certainty necessary to ensure that markets
are created that have the scale and scope necessary to
attract investment and reduces costs
Power Advisory LLC 2016. All Rights Reserved. 38Clean Energy Standard
CES mechanisms
• As a fully restructured state, New York has historically met
its clean energy goals through a system which treated the
compliance obligation as a delivery function of the
distribution utility with RECs centrally-procured for utilities
by NYSERDA under long-term contracts, intended to
provide greater certainty to generators and lower REC costs
for customers.
• The CES retains the benefit of New York’s unique central
procurement system but shifts the compliance obligation
from the distribution utility to the retail commodity supplier
LSE.
Power Advisory LLC 2016. All Rights Reserved. 39Clean Energy Standard: Renewable Energy Standard
The CES is divided into a Renewable Energy Standard
and a Zero-Emissions Credit (ZEC) requirement
Renewable Energy Standard
• Tier 1: New Renewable Resources
• Requires all LSEs to procure new renewable resources (with RECs as evidence) at
increasing rates (see Table A on following page)
• Specific goals are established for 2017 to 2021, with subsequent goals established in triennial reviews
• Table B on following page shows the projected statewide output from new
renewable resources due to these requirements
• LSEs can meet their obligations by purchasing RECs from NYSERDA, purchasing
qualified RECs from other sources or by making Alternative Compliance
Payments to NYSERDA
• Resources must have come into operation after Jan 1, 2015 in order to be eligible
• This order requires NYSERDA to conduct regularly scheduled solicitations for
long-term procurement of RECs to achieve the following minimum result (see
Table D on following page)
• Expected procurements of new large-scale renewable generation is approximately 1,869.4 GWh per
year, which is twice the level of RPS procurements during 2011 to 2015
• ZECs are discussed in a subsequent slide
Power Advisory LLC 2016. All Rights Reserved. 40Clean Energy Standard: Renewable Energy Standard
CES RES: Tier 1 tables
Table A. Required Procurement Table B. Expected Statewide Yield (MWhs)
% of LSE Distribution Direct Statewide
Year Year LIPA NYPA
total load Utilities & ESCOs Customers Total
2017 0.6%
2017 705,595 120,244 139,225 8,936 974,000
2018 1.1%
2018 1,261,429 214,967 248,900 15,975 1,741,270
2019 2.0% 2019 2,263,192 385,682 446,563 28,662 3,124,100
2020 3.4% 2020 3,841,197 654,599 757,928 48,647 5,302,371
2021 4.8% 2021 5,455,424 929,688 1,076,440 69,090 7,530,642
Table C. Expected Renewable Resources Table D. Long-term Procurement of RECs
Renewable % Renewable Anticipated Procurement Minimum Procurement
Year
Resource (MWhs) Resources Target (MWh) Target (MWh)
Baseline 41,296,000 25.71% 2017 1,966,449 1,769,804
2017 42,270,000 26.32%
2018 2,022,004 1,819,804
2018 43,037,270 26.81%
2019 2,077,560 1,869,804
2019 44,420,100 27.69%
2020 2,133,116 1,919,804
2020 46,598,371 29.08%
2021 48,826,642 30.54% 2021 2,188,671 1,969,804
Power Advisory LLC 2016. All Rights Reserved. 41Clean Energy Standard: Renewable Energy Standard
Fixed-price RECs will be procured consistent with past
practice
• Staff had argued for the procurement of a
bundled (RECs and energy) product
• Commission determined that larger procurement
volumes and elimination of budget cap will attract
more developers, than past NYSERDA processes
• Ensuring success of REC-only procurement
• Effectiveness of REC-only procurement will be
evaluated in the triennial review
• Net effect is that renewable project developers must
manage energy price risks
Power Advisory LLC 2016. All Rights Reserved. 42Clean Energy Standard: Renewable Energy Standard
CES RES: Tier 2
Renewable Energy Standard
• Tier 2: Maintenance
• Does not include the support payments for existing
renewable generation as recommended in the Staff White
Paper
• Noted that REC support payments in White Paper were either
premature, unnecessary, or already provided for under the current
maintenance program
• Consists of a maintenance program virtually identical to the
one that existed under the existing RPS
• Offshore Wind
• NYSERDA to identify appropriate mechanisms to achieve
goal of developing offshore wind
Power Advisory LLC 2016. All Rights Reserved. 43Clean Energy Standard: Zero-Emission Credits
CES Tier 3: Existing nuclear facilities
• NYSERDA will offer qualifying nuclear facilities multi-year contracts for the
purchase of Zero-Emission Credits (ZECs)
• For contracts awarded prior to April 1, 2017, contract period will run until March 31,
2029
• ZEC: $17.48/ MWh for the first two year tranche (Tranche 1)
• Price adjusted every two years for Tranches 2 – 6, based on social cost of carbon and changes in Zone A
energy and capacity prices
• Each LSE serving end-use customers will be required, beginning April 1, 2017,
to purchase a number of ZECs relative to the portion of the electric energy
load served by the LSE
• Costs will be recovered from ratepayers through commodity charges
• The Order formally supports New York State’s upstate nuclear plants
• These upstate plants realize lower locational marginal prices than downstate nuclear
plants (e.g., Indian Point).
Power Advisory LLC 2016. All Rights Reserved. 44Clean Energy Standard: Eligibility
CES: resource eligibility proposed rules
• The NYS RPS program did not have geographic limitations until 2013 when the
PSC approved NYSERDA’s request that out-of-state resources could no longer be
considered for the main tier of the state RPS due to energy security issues and the
displacement of economic benefits.
• In the NY Department of Public Service (DPS) Staff White Paper on the CES, Staff
recommended that a geographic eligibility provision be added to the CES to
expand supply options to include out-of-state resources, which would enhance
competition and supply stability and reduce costs.
• Recommended that out-of-state generation be eligible if located in an adjacent control
area to the NYISO control area, and if generation is accompanied by documentation of
a contract path between the generator and the in-state purchaser, including
transmission rights
• Also requires delivery of the underlying energy for consumption in New York between
the generator and either the New York Spot Market administered by the NYISO or an
LSE in New York
• DPS staff noted that because the CES would apply to all LSEs, restricting LSEs to in-
state resources would conflict with the Commerce Clause of the Constitution.
Power Advisory LLC 2016. All Rights Reserved. 45Clean Energy Standard: Eligibility
CES: adopted resource eligibility
• CES eligibility rules for Tier 1 mirror those currently
used in the Main Tier of the RPS with the exception
that 30 MW limit on low-impact run-of-river hydro
facilities is eliminated
• Large hydro is eligible, but only if it determined to be a
low-impact run-of-river facility and this requires that
there be no new storage impoundments, which excludes
most large hydro projects
• Recall that Tier 1 resources also have a vintage requirement
that mandates new resources
• Eligible resources: biogas, biomass, liquid biofuels, fuel
cells, hydro, solar, tidal/ocean, and wind
• However, no new storage impoundment will be
permitted for any eligible hydro facility
Power Advisory LLC 2016. All Rights Reserved. 46Clean Energy Standard: Eligibility
Out-of-state resource participation adopted in the CES
DPS Staff’s proposed geographic eligibility was adopted, allowing
facilities located out-of-state in adjacent control areas to participate
in NY CES Tier 1 solicitations.
For imported electricity to be eligible, it must be demonstrated that
it was:
• Scheduled into a market administered by NYISO for end-use in NY
• Delivered through a wholesale meter under the control of a utility, public
authority or municipal electric company such that it can be measured and
such that consumption within NY can be tracked and verified
• Delivered through a facility dedicated generation meter approved by the DPS
or its designee, to a customer in NY whose electricity was obtained through
the NYISO system
• All costs associated with measurement, tracking and verification must be borne by
the facility owner
Power Advisory LLC 2016. All Rights Reserved. 47Clean Energy Standard: Eligibility
Specifications for out-of-state intermittent renewable generators
that participate in CES Tier 1 solicitations
• May sell and transmit energy as it is generated into the spot market
of the control area of its location without simultaneous transmission
into the NY Control Area, as long as an equal quantity of energy is
transmitted out of the affected spot market into the NY Control Area
for end-use during the same hour as the renewable generation is
produced.
• Contractual deliveries for out-of-state resources much be recognized
in each hour as the lesser of actual hourly metered energy production
by the renewable generator, or actual hourly energy delivered to the
electric energy purchaser in the NY Control Area for end-use.
• If the control area of origin has an attributes accounting and tracking
system or an environmental disclosure program, it is required that
such programs recognize hourly matched transactions without
double counting the attributes in any jurisdiction.
Power Advisory LLC 2016. All Rights Reserved. 48Clean Energy Standard: Renewable Energy Standard
Eligibility requirements preclude renewable generation
from Atlantic Canada
• Given existing transmission tariffs, most renewable generation from Atlantic
Canada is unlikely to be cost-effective in New York or alternatively New York
would be viewed as a less attractive market
• Commission indicated that evaluation framework to be based on price and
economic development unless this shown to be ineffective
• This could disadvantage Canadian wind projects given their economic development
benefits will be lower than those for New York projects
• Commission indicated that the following additional factors will be considered:
• Viability of the project;
• Time frame for bid acceptance to operation;
• Diversity of resources of the overall portfolio;
• Diversity of owners [not further defined];
• Alignment with REV goals specified in procurement solicitations;
• Project developer experience; and
• Non-cost economic benefits.
Power Advisory LLC 2016. All Rights Reserved. 49Economics of Wind in Quebec
and Atlantic Canada
Ability of Wind from Quebec and Atlantic Canada to compete in US
Northeast
Power Advisory LLC 2016. All Rights Reserved. 50Economics
Similar underlying assumptions used for US and
Canadian wind costs
• Used US Energy Information Administration’s Assumptions to the
Annual Energy Outlook as the source for wind project capital and fixed
O&M costs
• Adjusted these to reflect expected cost differences in the US Northeast and Eastern
Canada
• These included regional cost differences (e.g., higher construction costs in New England
given project siting on ridge tops) and foreign exchange (Fx) effects
• Analysis assumed that significant portion of Canadian projects wouldn’t be affected by Fx,
with manufacturing infrastructure located in Canada
• Provincial cost differences were viewed as relatively minor and beyond the scope of
this analysis
• Analysis also accounted for differences in expected capacity factors in
these two regions
• Eastern Canada was viewed as offering higher capacity factors than the US Northeast
• Here as well differences in provincial wind regimes weren’t considered
• These assumptions are shown on a subsequent page
Power Advisory LLC 2016. All Rights Reserved. 51Economics
Historically, US wind projects had a competitive
advantage from the PTC
• US wind projects have benefited from the US Production Tax Credit (PTC)
• A 2.3 cent/kWh tax credit that was paid for all output over the first 10 years of a project’s life.
• The PTC is scheduled to be phased out by 2020.
• However, by expending 5% of a projects costs in a year a developer is able to claim that it began construction in
that year. This “continuity safe harbor” provision allows a developer to extend the benefits of the PTC for up to
four years assuming that the developer is able to demonstrate that it has made continuous progress towards
completion.
• This raises a question as to whether developers will share this benefit with buyers by reflecting it in its offered
pricing or whether they will elect to retain the benefit in terms of a higher return. We expect that market
dynamics will determine the answer to this question and where there are believed to be fewer competitors that
have this benefit the seller will seek to retain this benefit for itself.
• If this occurs Canadian wind will be on a much more level playing field.
• The PTC is scheduled to drop to 80% by 2017, 60% by 2018 and 40% by 2019.
• Projects are required to initiate construction by the end of the year to lock in the respective PTC rate. The
threshold for initiating construction is relatively low and includes incurring 5% of eligible project costs by the
deadline.
• Proponents then have four years to complete construction.
Power Advisory LLC 2016. All Rights Reserved. 52Economics
The busbar costs of Canadian wind projects are
projected to be lower than US projects
Source Data NE US Projects CAN Projects
2013 US$/kW 2020 US$/kW 2020 CAD$/kW
Capital Costs
$1,980 $2,359 $2,504
($/kW)
Fixed O&M Costs
$39.53 $45.41 $47.68
($/kW-year)
Capacity Factor (%) 38% 40%
Busbar Cost
$83.9 $76.1
($/MWh)
When Canadian wind project costs converted to
US$ - $60.9/MWh
• Costs shown are central case estimates
• +/- 15% reflects the high/low estimates
• Northeast US project busbar cost estimates assume expiration of the PTC
• The generation produced by Canadian projects must be delivered to the US
for it to compete
• The costs associated with delivering this energy must be considered
Power Advisory LLC 2016. All Rights Reserved. 53Economics
Canadian wind generation must incur
transmission costs for Northeast
Provincial Transmission Charges
• The transmission charges that would
be incurred in each Province are $/MWh Losses
shown to the right New Brunswick $5.18 3.3%
• In addition, losses are assigned PEI $5.19 2.8%
according to the loss factors shown Nova Scotia $8.55 2.0%
• In Ontario, losses vary by location
Quebec $8.20 5.4%
• Provinces that aren’t directly
Ontario $1.85 Vary
interconnected to the US Northeast
need to pay multiple transmission
Cumulative Transmission Charges*
charges, one for each province they
wheel through this is shown in terms $/MWh Losses
of the Cumulative Transmission
PEI $10.36 6.0%
Charges
Nova Scotia $13.73 5.2%
• Even with these additional
transmission charges, wind generation
from Quebec and Atlantic Canada These transmission costs reduce the
appears to be competitive with wind competitive advantage offered by Canadian
generation from the US Northeast wind generation
* Cumulative Transmission Charges reflect
the addition of PEI and Nova Scotia
charges, respectively with New Brunswick
Power Advisory LLC 2016. All Rights Reserved. 54Economics
Northeast wind projects experiencing increasing
transmission costs
• As discussed above, in New England wind generation is clustered in Maine and this
is leading to increasing levels of transmission congestion.
• Transmission congestion reduces the value of this wind generation from Maine as it has a
reduced locational value (Locational Marginal Price)
• Therefore, increasingly new wind projects require transmission investment to
deliver the energy to Southern New England load centres
• The Tri-State Clean Energy RFP issued by Massachusetts, Connecticut and Rhode
Island recognized this and allowed new transmission investments to be bundled
with generation as well as to be considered separately.
• A number of transmission projects were submitted in response to the Tri-State RFP.
Power Advisory expects that one or more of these transmission projects to be
successful.
• These different projects are forecast to have significantly different costs and to
deliver different types of energy.
• With the economic assessment considering the underlying value of energy delivered,
higher cost projects may be more cost-effective.
Power Advisory LLC 2016. All Rights Reserved. 55Economics
The estimated costs of different transmission projects vary
significantly
Length Transfer
Project TWh Generation $/MWh
(miles) Capability
Clean Energy Connect 25 600 2.1 Wind & Hydro $3
Maine Clean Power Connection 66 550 1.9 Wind $5
Maine Renewable Energy Interconnect 150 1200 4.1 Wind $11
NextEra Maine 114 561 1.8 Wind, Solar & Battery $12
Northern Pass 192 1090 8.8 Hydro $19
Vermont Greenline 60 400 3.2 Wind & Hydro $20
• $/MWh costs are Power Advisory estimate of the capital costs for the project amortized over the generation that would be utilizing the
transmission facility.
• Higher cost projects that deliver lower cost or higher value energy may be successful in the Tri-State RFP.
• In general, transmission projects that would be delivering wind generation offer the higher value of Class I RECs.
• Whereas, a project such as Northern Pass is likely to offer access to energy that would receive the ISO-NE market price. Specifically,
Northern Pass participated in the Tri-State RFP as a delivery commitment project where the proponent was just seeking cost recovery for
transmissions based on the total amount of clean energy delivered. There would be no commitment to purchase a fixed quantity of
energy.
• Recall that Class I REC requirements for New England are forecast to increase by about 8 TWh from 2016 to 2025.
Power Advisory LLC 2016. All Rights Reserved. 56Economics
The value of Class I RECs varies depending on
market conditions
• Pricing for Class I RECs is shown in the figure to
New England Class I REC Prices
the right.
• Economic theory suggests that the value of Class I
RECs will be determined by the incremental cost of
the marginal renewable resource. If a wind project
in New England costs $90/MWh ($84/MWh busbar
cost plus $6/MWh for transmission) and the value
of energy in New England is $44/MWh in 2020,
then the value of a Class I REC would be about
$46/MWh before consideration of any discounts
for a long-term contract.
• Current Class I REC prices range from about $32 to
$38/MWh. We expect that the loss of the PTC will
result in increases in Class I REC prices in New
England.
• Current forward contracts for 2020 for the ISO-NE
Mass Hub are about $44/MWh and $53/MWh for
2025.
• This analysis assumes no capacity value taken for
wind given ISO-NE pay-for-performance program.
• States have Alternative Compliance Payments,
which represent the ceiling price for a Class I REC. Source: US Department of Energy
These alternative compliance payments generally
escalate with inflation and for Massachusetts are
about $64/MWh.
Power Advisory LLC 2016. All Rights Reserved. 57Economics
There is little long-term forward market liquidity
for Class I RECs
• Renewable Portfolio Standards (RPS) are product of legislation and state
regulations. Therefore, there’s considerable change-in-law risks associated
with these RPS.
• For example, Connecticut has changed the definition of qualifying Class I resources
several times and this has affected the price of Class I RECs in Connecticut.
• The net result is that there’s limited trading of Class RECs several years
before the compliance year. This has required that sellers have long-term
contracts to secure reasonable value for Class I RECs.
• The market value of RECs several years before the compliance year is typically at a
considerable discount to nearer term market prices reflecting these change-in-law
risks.
• Requirements for such long-term contracting are generally established
legislatively and these requirements are considerably less than the total
Class I resource requirements of these states.
• Tri-State RFP could consume much of the legislative mandates for long-term
contracts, other than required by the recent Massachusetts legislation.
Power Advisory LLC 2016. All Rights Reserved. 58Economics
The value of Canadian hydroelectric projects
varies by state
• For example, Massachusetts has mandated the purchase of 9.45
TWh per year of clean energy and large Canadian hydroelectric
projects would qualify for such purchases.
• Absent this purchase requirement, the value of Canadian hydroelectric power
would be the value of the energy plus its capacity value.
• Using current ISO-NE futures prices this would represent about US$54/MWh
in 2020 and about US$65/MWh in 2025.
• In 2020 baseload energy at the Mass Hub has a value of about $43.8/MWh (based on current
futures prices) and capacity about $10.5/MWh (assuming once again a baseload output profile).
• Large Canadian hydroelectric projects don’t qualify for Class I
RECs. However, as non-carbon emitting resources they can assist
states achieve any potential Clean Power Plan emission reduction
obligations.
Power Advisory LLC 2016. All Rights Reserved. 59Economics
Incremental value of wind generation relative to
Canadian hydroelectric projects needs to consider
• The incremental value of Class I renewable resources (or the value
of Class I RECs) versus differences in the output profile of the two
resources and the greater capacity value of hydroelectric output.
• There could also be an integration costs associated with wind (excluding
transmission costs which would be incurred by both resource types).
• For the purposes of this assessment we are assuming that hydroelectric
output is delivered around-the-clock.
• Differences in the value of the wind output relative to hydro vary
by market. For the purposes of this comparison, we believe it is
reasonable to assume that the discount associated with wind
output value relative to hydroelectric power is close to the
capacity value of wind resources.
• Therefore, one can assume that any discount in the energy value
of wind from a higher proportion of output in off-peak periods is
offset by wind’s capacity value.
• This is an approximation, but is reasonable in most electricity markets.
Power Advisory LLC 2016. All Rights Reserved. 60Economics
Incremental value of wind generation relative to
Canadian hydroelectric projects needs to consider
• This suggests that the difference in value for wind versus baseload
hydro is largely reflected by the value of the Class I RECs
associated with the wind resource. The value of Class I RECs vary
depending on market conditions. When there is a shortage or
Class I RECs they tend to trade just below the Alternative
Compliance Payment (ACP) which in Massachusetts, Rhode Island
and New Hampshire is about $67/MWh.
• In a market where sufficient renewable energy can be built to
meet RPS requirements, economic theory suggests that the
pricing for RECs should be about $36 to $46/MWh, with the low-
end of the range assuming a discount of about $10/MWh to
secure a long-term REC contract or using the low end of the range
for wind project costs.
Power Advisory LLC 2016. All Rights Reserved. 61You can also read