Incremental ELCC Study for Mid-Term Reliability Procurement (January 2023 Update)
←
→
Page content transcription
If your browser does not render page correctly, please read the page content below
Incremental ELCC Study for Mid-Term
Reliability Procurement

(January 2023 Update)

January 2023

PREPARED FOR

The California Public Utilities Commission (CPUC)

PREPARED BY

Astrapé Consulting
 Kevin Carden
 Trevor Bellon

Energy + Environmental Economics
 Aaron Burdick
 Charles Gulian
 Arne Olson

 1
Disclaimer: This report was prepared by the authors for The California Public Utilities Commission. The
authors do not accept any liability if this report is used for an alternative purpose from which it is intended,
nor to any third party in respect of this report. By reviewing this report, the reader agrees to accept the
terms of this disclaimer.

Acknowledgement: We acknowledge the valuable contributions of many individuals to this report and to
the underlying analysis, including peer review and input offered by CPUC staff. In particular, we would
like to acknowledge the analytical, technical, and conceptual contributions of Neil Raffan, Sarah
Goldmuntz, Nathan Barcic, Donald Brooks, Mounir Fellahi, and Patrick Young.

 2

TABLE OF CONTENTS
EXECUTIVE SUMMARY ........................................................................................................... 7
 PURPOSE .................................................................................................................................................. 7
 BACKGROUND .......................................................................................................................................... 7
 METHODOLOGY ....................................................................................................................................... 8
 RESULTS ................................................................................................................................................... 9

BACKGROUND AND METHODOLOGY.................................................................................... 11
 MTR PROCESS AND NEED FOR INCREMENTAL ELCCS............................................................................ 11
 SERVM ELCC CALCULATION METHODOLOGY ........................................................................................ 12
 STUDY DESIGN ....................................................................................................................................... 15

INPUT ASSUMPTIONS .......................................................................................................... 20
 SUMMARY OF INPUT UPDATES FROM 2021 MTR ELCC STUDY............................................................. 20
 IMPORTS ................................................................................................................................ 21
 HYDRO ................................................................................................................................... 22
 CALIFORNIA AND OUT-OF-STATE WIND PROFILES.................................................................... 25
 OFFSHORE WIND PROFILES ..................................................................................................... 25
 LOAD PROFILES ...................................................................................................................... 26
 SUMMARY OF KEY INPUTS..................................................................................................................... 27
 MTR BASELINE PORTFOLIO ..................................................................................................... 27
 SOLAR AND STORAGE SURFACE INPUTS .................................................................................. 29

RESULTS .............................................................................................................................. 32
 SOLAR ELCC ............................................................................................................................................ 32
 STORAGE ELCC ....................................................................................................................................... 33
 WIND ELCC ............................................................................................................................................. 34
 APPROACH FOR OTHER RESOURCES NOT MODELED ............................................................................ 34
 ELCC COMPARISON TO PAST STUDIES ................................................................................................... 35
 WHY RESOURCE INCREMENTAL ELCC VALUES CHANGE ............................................................ 35
 CHANGES TO STORAGE ELCC ................................................................................................... 36
 CHANGES TO SOLAR ELCC ....................................................................................................... 38
 CHANGES TO WIND ELCC ........................................................................................................ 39

SENSITIVITIES ...................................................................................................................... 42
 NO NEW SOLAR GROWTH ..................................................................................................................... 43

 3
LOWER BTM SOLAR GROWTH ............................................................................................................... 43
 IEPR AFTERNOON LOAD SHAPE ADJUSTMENT ...................................................................................... 44
 WEATHER YEAR RE-WEIGHTING ............................................................................................................ 45
 PESSIMISTIC BATTERY OPERATION ........................................................................................................ 48

CONCLUSIONS AND LESSONS LEARNED ................................................................................ 50
 CONCLUSIONS ....................................................................................................................................... 50
 RECOMMENDATIONS FOR FURTHER RESEARCH ................................................................................... 50

LIST OF ACRONYMS ............................................................................................................. 52

 4
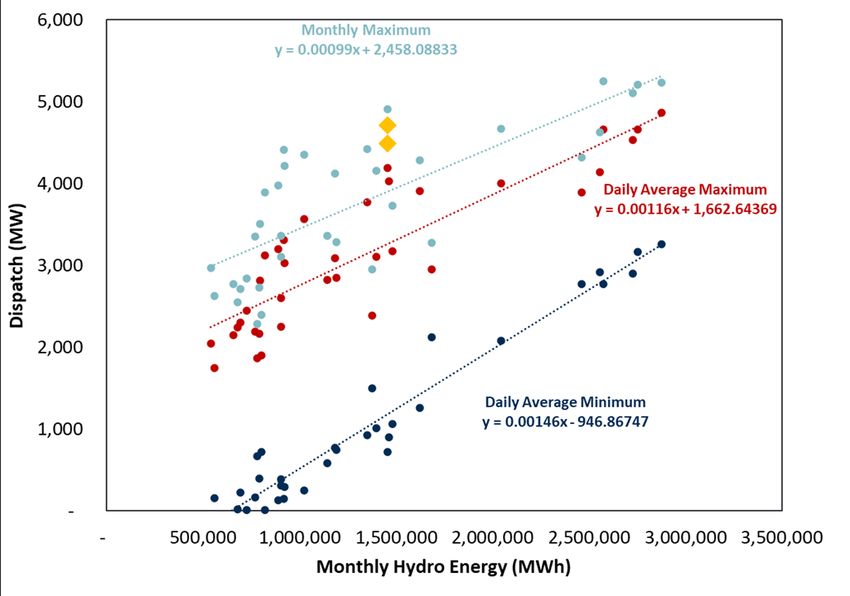
TABLE OF FIGURES

Figure 1. Illustrative Net Load Shift Due to Solar Penetration .................................................................... 11
Figure 2. Schematic of “Diversity Impacts” between Solar and Energy Storage ........................................ 12
Figure 3. ELCC Calculation Process Visual ................................................................................................... 13
Figure 4. Flat Load Addition Effect on Firm Generator Operations ............................................................ 14
Figure 5. Solar and storage additions by MTR tranche ............................................................................... 17
Figure 6. Delta Method ELCC Allocation Methodology .............................................................................. 18
Figure 7. Historical CAISO Hydro Data ........................................................................................................ 22
Figure 8. Original and Updated "Detrended" CAISO Hydro Energy Availability ......................................... 23
Figure 9. Historical CAISO Hydro Maximum Output ................................................................................... 24
Figure 10. CAISO Annual Hydro Production vs. Annual CAISO Peak ........................................................... 24
Figure 11. Daily Average Wind Output Comparison (2023 MTR ELCC Study vs. 2021 MTR ELCC Study) ... 26
Figure 12. Average Normalized September Load (> 45 GW Daily Peak) .................................................... 27
Figure 13. Proposed RESOLVE Solar and Storage Surface + the Subsection Studied in this Report........... 30
Figure 14. Solar Additions Effect on Storage Potential ............................................................................... 37
Figure 15. 4-hour Duration Battery Storage ELCC Comparison .................................................................. 38
Figure 16. Solar ELCC Comparison .............................................................................................................. 38
Figure 17. In-state Wind ELCC Comparison ................................................................................................ 40
Figure 18. Wyoming Out-of-State Wind ELCC Comparison ........................................................................ 40
Figure 19. New Mexico Out-of-State Wind ELCC Comparison.................................................................... 41
Figure 20. Offshore Wind ELCC Comparison............................................................................................... 41
Figure 21. Incremental 4 Hour Battery Storage ELCC at Multiple Levels of Solar Additions above the 40
GW 2025 Baseline ....................................................................................................................................... 43
Figure 22. Average Daily Net Load Profile Comparison (September, Daily Peak > 40 GW) ....................... 45
Figure 23. Normalized Net Load Shapes on Extreme Days ......................................................................... 47

 5
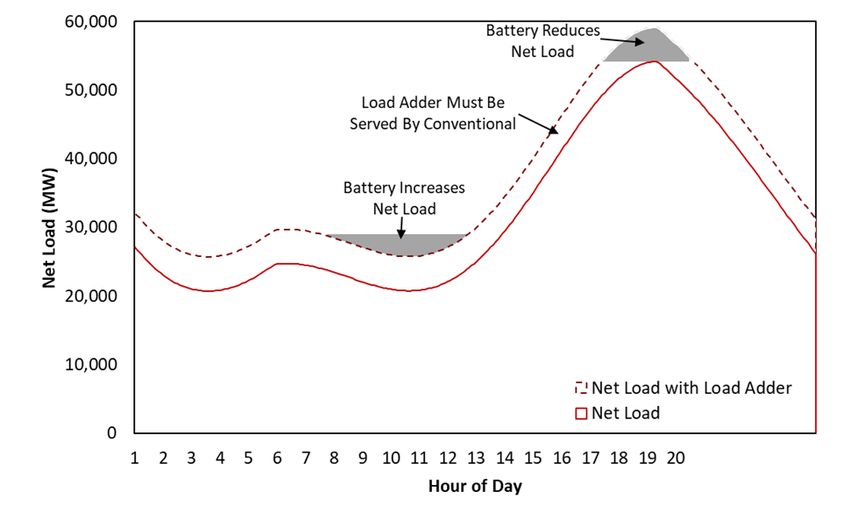
TABLE OF TABLES

Table 1. Incremental ELCCs by MTR Tranche .............................................................................................. 10
Table 2. Summary of changes vs Previous MTR Study ............................................................................... 20
Table 3. Base Resource Mix ........................................................................................................................ 29
Table 4. Cumulative Nameplate Solar and Storage Additions by Tranche ................................................. 31
Table 5. Assumed Cumulative Nameplate Storage Additions by Tranche.................................................. 31
Table 6. Incremental ELCCs by MTR Tranche .............................................................................................. 32
Table 7. Why ELCC Values Change Between Studies .................................................................................. 35
Table 8. Low BTM PV Incremental ELCC Sensitivity Results ....................................................................... 44
Table 9. IEPR Afternoon Load Shape Adjustment ELCC Sensitivity Results ................................................ 45
Table 10. SERVM Weather Year Probability Weighting .............................................................................. 46
Table 11. Weather Year Re-Weight ELCC Sensitivity Results ...................................................................... 48
Table 12. Pessimistic Battery ELCC Sensitivity Results................................................................................ 49

 6
EXECUTIVE SUMMARY

PURPOSE
The CPUC’s Mid-Term Reliability (MTR), Decision (D.21-06-035), orders the procurement of 11,500
megawatts (MW) of net qualifying capacity (NQC) and requires standardized effective load carrying
capability (ELCC) values. These standardized values allow for load serving entities (LSEs) to know the
compliance value of various incremental resource types and allows for the CPUC to be confident that
incremental procurement will fill their identified procurement need. This report presents updates to the
ELCC values to be used for compliance with the CPUC’s MTR Decision. The ELCC values for 2023 (“Tranche
1”) and 2024 (“Tranche 2”) compliance dates were finalized in a report by the CPUC in October of 2021.
This report presents updates to the previously reported ELCC values for 2025 (“Tranche 3”) and 2026
(“Tranche 4”) compliance dates. Additionally, this report presents ELCC values for 2027 (“Tranche 5”) and
2028 (“Tranche 6”), based on the January 13, 2023, Integrated Resource Planning (IRP) Proposed Decision
that proposes additional MTR procurement. The study also presents a comparison to previous ELCC
studies and sensitivities that consider drivers of ELCC uncertainty. E3 and Astrapé produced this study as
technical consultants to the CPUC using Astrapé’s Strategic Energy and Risk Valuation Model (SERVM)
stochastic loss of load probability (LOLP) model.

BACKGROUND
Many renewable energy resource types, such as wind and solar resources, are non-dispatchable and
variable in output, and dependent upon external conditions such as weather. Energy-limited resources
such as battery storage have constraints on their ability to be discharged and are subject to charging
limitations based on available excess energy from other generators. Consequently, the ability of these
resources to serve load is not the same as a traditional, firm1 dispatchable resources. Therefore, a measure
of their equivalent capacity is needed so that these resources can be properly accounted for in resource
adequacy (RA) assessments and procurement. The emerging industry standard for this purpose is ELCC.

This study examined the incremental ELCC of energy storage, solar photovoltaic (PV), and wind in the
California Independent System Operator (CAISO) footprint to provide ELCC assumptions to LSEs for
compliance with the CPUC’s MTR Decision.2 This study’s primary focus was on Tranches 3 and 4: pertaining
to requirements of 1,500 additional megawatts (MW) by 2025 and 2,000 additional MW by 2026.
Additionally, the study reflects the proposed changes to MTR in the January 13, 2023, IRP Proposed
Decision, whereby the 2,000 MW long-lead time (“LLT”) resource tranche is delayed until 2028, a new
2,000 MW Tranche in 2026 replaces that LLT volume, and another 2,000 MW tranche is added in 2027.

1
 A “firm” resource can operate indefinitely when called upon.
2
 D.21-06-035, available at: https://docs.cpuc.ca.gov/PublishedDocs/Published/G000/M389/K603/389603637.PDF
 7
METHODOLOGY
ELCCs are calculated by determining the reliability improvement contributed to the system by incremental
resources in terms of the amount of additional load that can be served because of that improvement in
reliability, calculated relative to a perfect capacity firm generator with no outages.3 Thus, ELCC provides a
consistent metric through which renewable and energy-limited resources can be directly compared with
one another and with dispatchable generation resources based on their ability to fill the CAISO’s mid-term
capacity shortfall.

This study began with a resource portfolio intended to represent the expected CAISO resource portfolio
in 2025, prior to the MTR procurement in 2025 and later years. This portfolio was determined by adding
to the MTR baseline portfolio: 1) resources procured by LSEs in compliance with the D.19-11-016
procurement order and 2) expected cumulative LSE resource additions for compliance with MTR Tranches
1 and 2 in 2023 and 2024. The additions to the MTR baseline reflect LSE procurement data for D.19-11-
016 and MTR Tranches 1 and 2 contracts, received from LSEs by CPUC staff on 8/1/2022. Recognizing that
solar and energy storage resources significantly interact with each other and are likely to form the bulk of
resource additions, E3 and Astrapé designed a “surface” of incremental solar and storage additions. Wind
resources were studied at various points in this surface, aligned with MTR Tranches. This surface covered
the existing MTR Tranches 3 and 4, as well as the additional 4,000 MW procurement volume recently
proposed in the IRP proceeding and captured in Tranches 5 and 6.4

This analysis used the CPUC Energy Resource Modeling (ERM) team’s latest SERVM version,5 with its
existing load and resources data across 1998-2020 weather years, and made a variety of updates including
minor refinements of the MTR baseline, wind shape adjustments, hydro de-trending and de-coupling, and
load shape adjustments consistent with 2021 Integrated Energy Policy Report (IEPR) load. For this analysis,
the ELCC of incremental resource additions was determined by comparing the reliability improvement
achieved with the equivalent reliability of a perfect capacity generator (represented by a combustion
turbine – CT – with no forced or planned outages).6

3
 In the academic literature the comparison is performed against flat blocks of load. However, in practice in the
industry, the comparison is often made to generation modeled without forced or planned outages.
4 The four tranches described in this report refer to the four years of procurement ordered in the MTR decision –
2023-2026 – and are separate and distinct from the three tranches of procurement ordered in the short-term
reliability decision (2021-2023), although Tranche 1 of MTR procurement coincides with Tranche 3 of the short-
term reliability decision procurement.
5
 As described in “Energy Division Study for Proceeding R.21-10-002: Loss of Load Expectation and Slice
of Day Tool Analysis for 2024” available at:
https://docs.cpuc.ca.gov/PublishedDocs/Efile/G000/M501/K409/501409211.PDF
6
 Per the FAQ document released by CPUC staff on August 24, 2021, “for resource types for which staff publish
ELCCs for by the end of August 2021, per OP 15, the ELCC is annual and should be used to determine compliance
with OP 1 and OP 3. For other resource types, LSEs should use the September NQC according to RA program

 8
RESULTS
The ELCCs by MTR Tranche are presented in Table 1. By “Marginal” vs. “Incremental” ELCCs:
Tranche 3, energy storage resources provide less than 80% marginal ELCCs refer to the ELCC benefit of
incremental ELCC due to the existing CAISO storage adding one additional MW to a system (or
penetration from past procurement, including Tranches 1 another reasonably small amount).
and 2. Energy storage ELCC decline can be partially offset Incremental ELCCs refer to the ELCC

with longer duration storage additions. Solar ELCCs are benefit of a larger incremental addition or
 the subsequent benefits of multiple
generally very low due to the late evening net peak but
 increments of additions.
continue to provide value through their interactive effects
with other resources, including providing mid-day charging
energy. While solar ELCCs monotonically decline with increases in solar penetration in isolation, solar
ELCCs can increase when storage penetrations increase and energy constraints become binding. This is
the effect observed in the increase in solar ELCC between Tranche 3 and 4, and the continued (albeit
small) incremental reliability value of solar through 2028. The assumed addition of both solar and storage
helps to maintain the reliability value of both resources. In-state wind ELCCs are generally low, reflecting
updated wind shapes showing lower summer afternoon output. Out-of-state wind and offshore wind
show higher ELCCs than in-state wind due to their higher output during net peak conditions. The results
presented in Table 1 are applicable to storage technologies other than batteries and pumped storage
hydro, provided that such storage resources have comparable round-trip efficiencies and durations.

rules at the time of contract signing.” The FAQ document is available at: https://www.cpuc.ca.gov/industries-and-
topics/electrical-energy/electric-power-procurement/long-term-procurement-planning/more-information-on-
authorizing-procurement/irp-procurement-track
 9
Table 1. Incremental ELCCs by MTR Tranche

 From prior study, for Updated values Additional Proposed
 reference only from this study MTR Tranches7
 Tranche 1 Tranche 2 Tranche 3 Tranche 4 Tranche 5 Tranche 6
 2,000 MW 6,000 MW 1,500 MW 2,000 MW 2,000 MW 2,000 MW
 2023 2024 2025 2026 2027 2028
4-Hour Battery 96.3% 90.7% 75.1% 76.6% 74.0% 76.5%
6-Hour Battery 98.0% 93.4% 79.6% 80.3% 80.5% 83.3%
8-Hour Battery 98.2% 94.3% 84.0% 84.0% 87.1% 90.1%
8-Hour PSH N/A 76.8% 82.6% 82.6% 85.7% 88.7%
12-Hour PSH N/A 80.8% 86.6% 86.6% 89.7% 92.7%
Solar - Utility and BTM PV 7.8% 6.6% 6.6% 7.0% 7.5% 8.8%
Wind CA 13.9% 16.5% 12.0% 13.2% 14.0% 14.7%
Wind WY 28.9% 28.1% 31.0% 33.0% 31.7% 30.9%
Wind NM 31.1% 31.0% 30.0% 35.0% 33.7% 31.9%
Wind Offshore N/A N/A 48.0% 46.0% 44.0% 44.7%

Compared to the MTR ELCC study released in October 2021, the changes to Tranche 3 and 4 ELCC
values were generally small. The largest change was to the wind ELCC values resulting from
improvements to the wind shapes used in this study. These improvements led to lower in-state
wind ELCCs and higher offshore wind ELCCs. The ELCC Comparison to Past Studies section of this
report explains why and how ELCC values shift from study to study, highlighting the importance of
regular updates to long-term ELCC forecasts as the load shapes, system portfolio, and weather
trends evolve over time. The fact that ELCC values evolve as system portfolios change and as new
weather and operational data becomes available is a key benefit of the methodology that supports
continuous improvement in the CPUC’s reliability planning, though it is recognized that the variable
nature of ELCC values poses a challenge to multi-year forward procurement efforts.

Sensitivity analyses were conducted to consider the sensitivity of solar and storage ELCCs to key
portfolio and operational parameter inputs. These analyses show that the solar and storage ELCCs
presented in the table above could change by up to +/- 10 percentage points under various
assumptions of future load shapes and battery operations. Further collaboration with the California
Energy Commission (CEC) on multi-year weather and load datasets may reduce uncertainty in the
CAISO load shape, and as batteries grow on the CAISO system, expanded operational data --
including forced outage rates/durations and ability to dispatch optimally to reduce loss of load risk
-- will reduce the uncertainty in storage ELCCs.

7
 The years and volumes shown here are based on the January 13, 2022 Proposed Decision. Tranche 5 consists of
2,000 MW in 2027 and Tranche 6 consists of 2,000 MW – assumed to be 1,000 MW long duration storage and
1,000 MW firm zero carbon renewables – in 2028.
 10
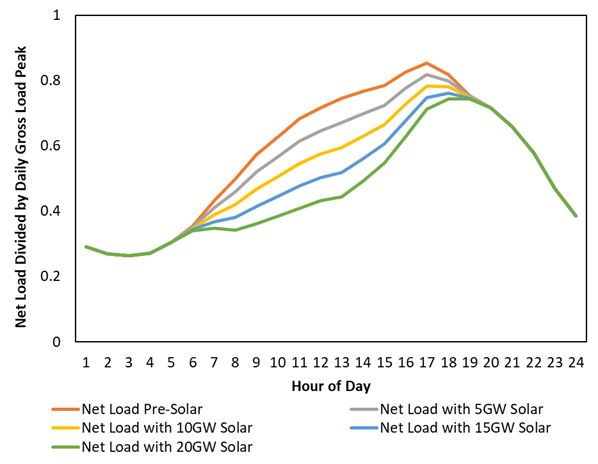
BACKGROUND AND METHODOLOGY

MTR PROCESS AND NEED FOR INCREMENTAL ELCCS
The MTR Decision requires that at least 11,500 MW of additional net qualifying capacity (NQC) be
procured by all the LSEs subject to Commission jurisdiction. The capacity requirements are divided into
four “tranches”: 2,000 MW by 2023, 6,000 additional MW by 2023, 1,500 additional MW by 2025, and
2,000 additional MW by 2026. Two additional procurement tranches are now proposed in the IRP
proceeding for 2,000 MW in 2027 and 2,000 MW in 2028. The very large amount of capacity ordered
(approximately a third of the system managed peak demand) requires a robust method for ensuring that
incremental reliability contributions used by LSEs in their evaluations and compliance filings will be
sufficient to completely fill the procurement need identified.

Unlike traditional resources, the system reliability contributions of renewable and energy-limited
resources decline with greater penetrations of such resources. This is because energy-limited resources
do not have the same dispatch flexibility that traditional resources have to meet changing system
dynamics and are subject to “saturation effects.” For example, as solar is added to the system, the
injections into the system from the solar resources cause a shift in the timing of the net load peak as
demonstrated in Figure 1. Incremental solar produces less energy during the new net load peak period
and has a corresponding lower reliability contribution.

Figure 1. Illustrative Net Load Shift Due to Solar Penetration

The orange line in Figure 1. Illustrative Net Load Shift Due to Solar Penetration depicts the net load
assuming no solar (i.e., gross load less other modifiers such as wind, energy efficiency, etc.), and the
different colored lines below the no solar line depict net loads at various penetrations of solar. The figure
clearly depicts a time shift in the “net load peak” of the system. As the new net load peak approaches

 11
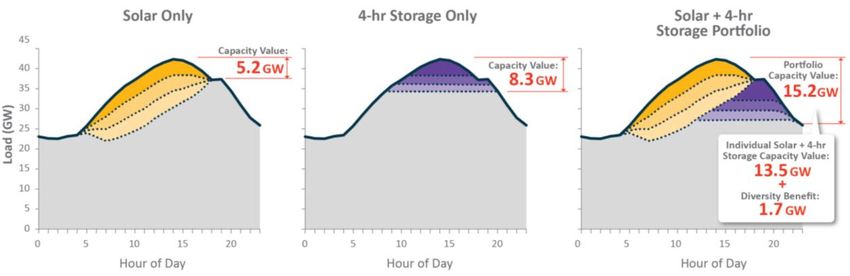
dusk, the contribution that the next increment of solar provides for meeting that new peak is smaller than
that of previous increment. The result is that over time, as solar is added to the system, the average ELCC
– the total reliability value of all the solar resources – decreases. These dynamics are often referred to as
“saturation effects.”

In addition to ELCC dynamics within a resource type (e.g., solar), there are ELCC dynamics between
resource types, which are referred to as “diversity impacts.” This concept is illustrated in Figure 2 below,
which shows that solar and energy storage added together provide more than the sum of their parts.
Energy storage shifts the peak back to the higher solar production hours, during which solar can both
charge energy storage and narrow the residual net peak period that storage must serve as solar
production wains.

Figure 2. Schematic of “Diversity Impacts” between Solar and Energy Storage8

Due to these saturation effects and diversity impacts, the average ELCC of the portfolio does not
accurately reflect the true reliability benefit of the next increment of a resource added to the system.
Therefore, for all renewable and energy-limited resources, the only way to truly capture the reliability
benefit of these incremental resources is to calculate the incremental ELCC of adding new resources,
which will be different than the average ELCC of the entire portfolio. Loss of load probability (LOLP)
modeling is used for ELCC calculations because it accurately captures reliability contributions across a
broad range (years or decades) of system conditions and because it robustly captures interactive effects
between incremental resources and the existing system fleet. This study used Astrapé’s stochastic LOLP
reliability model SERVM for these ELCC calculations.

SERVM ELCC CALCULATION METHODOLOGY
ELCCs are calculated using SERVM by determining how much additional load can be served by the
renewable/energy limited resources while maintaining a targeted reliability benchmark, expressed in

8
 N. Schlag, Z. Ming, A. Olson, L. Alagappan, B. Carron, K. Steinberger, and H. Jiang, "Capacity and Reliability Planning
in the Era of Decarbonization: Practical Application of Effective Load Carrying Capability in Resource Adequacy,"
Energy and Environmental Economics, Inc., Aug. 2020
 12
terms of Loss of Load Expectation (LOLE). The resource adequacy framework of SERVM ensures that the
reliability impact of the renewable/energy-limited resources are evaluated across a broad range of
weather patterns via historical weather years, economic growth scenarios, and outage conditions.

SERVM models renewable resources as an 8,760-hour per year injection profile into the system. A
separate injection profile is modeled for each weather year considered. Battery and pumped storage
hydro (PSH) resources are modeled with an initial generation schedule determined day-ahead, but which
can be altered under emergency conditions. Battery resources, however, can dispatch more flexibly and
serve ancillary services at a wider range of dispatch levels. These resources are modeled along with all
other dispatchable resources using an 8,760-hour chronological, economic dispatch modeling approach.

To determine the reliability benefit of a portfolio of renewable/energy-limited resources, the
representative 2025 starting portfolio is first calibrated to a presumed target level of reliability by adding
or removing perfect capacity. For this study, the system was calibrated to the reliability standard LOLE of
0.1 days/year. The study tranche being considered (e.g., the first tranche of modeled storage additions) is
then added to the system to determine the improvement in LOLE. The system is then returned to the
target 0.1 days/year LOLE by removing a portion of the previously added perfect capacity. The difference
in LOLE between the base case condition and the study tranche condition is the reliability benefit provided
by the test portfolio. This process is illustrated in Figure 3 below.

Figure 3. ELCC Calculation Process Visual

The amount of perfect capacity removed to achieve 0.1 days/year LOLE will be less than the nameplate
capacity of the study tranche and represents the equivalent capacity value of the study tranche. Dividing

 13
the equivalent capacity value by the nameplate capacity of the tranche results in the incremental ELCC
(expressed in percent).

When assessing ELCC, either the addition of perfect load (i.e., flat load) or the removal of perfect capacity
(i.e., a dispatchable generator with no forced or planned outages) can be used. There is no industry
standard approach, and both methods have been used widely in the industry; however, the method used
may capture different interactive effects on energy-limited resources (such as energy storage). Prior ELCC
studies performed by Astrapé for California have used the addition of perfect blocks of load to compare
the reliability contributions of incremental generation.9 That method leaves existing generation with
forced outages in the fleet and tends to exacerbate negative interactions across resource classes. For
instance, adding energy storage may require existing firm10 generation to operate more mid-day to charge
the storage. The additional load associated with the “perfect load” LOLE tuning method adds load in all
hours, which requires dispatchable generation to operate to charge the battery and then even more
dispatchable generation to operate to serve the mid-day load added. This increased operation leads to
more outages and commensurately lower ELCCs for storage. Wind resources have similar effects since
they have less energy prior to the peak than during the peak.

Figure 4. Flat Load Addition Effect on Firm Generator Operations

In contrast, the perfect capacity method typically entails a firm capacity comparison resource with no
availability limits. This resource could be modeled as a “first in the stack” firm resource (i.e., a baseload
resource dispatched before other dispatchable resources), or a “last in the stack” firm resource (i.e., a

9
 https://www.astrape.com/wp-content/uploads/2022/03/2021-Joint-IOU-ELCC-Study-Final-Report.pdf
10
 The term “conventional” in this report refers to resources that can be turned on and off to reflect market
conditions and do not have energy/duration constraints, such as gas power plants.

 14
peaking resource dispatched after other dispatchable resources when required to avoid loss of load).
The “first in the stack” method is akin to adding load in every hour and therefore can have the same
impacts on renewable and storage resources as noted above for the flat load method. The “last in the
stack” method has fewer system interactions since the perfect resource being added is only operated in
a manner to avoid loss of load risk versus operating in a way that changes the operations of the rest of
the existing fleet. This translates into a slightly higher ELCC for storage and renewable resources, since
no additional system outages are introduced in off-peak hours by the need to serve incremental load
additions. The “last in the stack” perfect capacity method was chosen for this analysis because it aligns
with the method used by the CPUC ERM team in their ELCC calculations, and while results are similar
between both “first in the stack” and “last in the stack” methods, the selected approach most accurately
reflects the reliability contribution of these resources in the system as it is projected to exist. Using the
“last in stack” perfect capacity method can require removing existing firm generation from the baseline
system used in this study.

STUDY DESIGN
This study was designed similarly to the previous MTR ELCC study released on 10/21/2021. The
following key steps were utilized:

 1. Complete SERVM methodology and input updates to the latest CPUC model version
 2. Update the CAISO portfolio to reflect the MTR baseline portfolio plus projected LSE resource
 additions through 2024 in compliance with D.19-11-016 procurement order and MTR Tranches 1
 and 2
 3. Design a “surface” of incremental solar and storage additions to represent expected mid-term
 capacity additions in 2025, 2026, 2027, and 2028
 4. Model the individual and combined additions of solar and storage capacity
 5. Interpolate storage ELCCs for the resource additions needed to fill the remaining need in each
 MTR tranche after accounting for the ELCC of modeled solar additions
 6. Allocate diversity impacts between solar and storage using the “delta method”
 7. Model wind and long duration energy storage (LDES) ELCCs within each tranche of solar and 4-
 hour battery storage additions

The key SERVM input and methodology changes are described in the “Input Assumptions” section of this
report below, which included offshore wind shapes, neighbor modeling, load shape adjustments, and
hydro modeling. CAISO portfolio updates to the baseline 2022 portfolio provided by CPUC staff included
the following changes:

 • Add forecasted incremental utility-scale solar, energy storage, and other resource additions
 within the MTR baseline (resources contracted by 6/30/2020) and add any additional resources
 required for D.19-11-016 compliance
 • Add projected MTR Tranche 1 and Tranche 2 LSE additions (i.e., forecasted additions through 2026
 based on in-development contracts executed and approved by 8/1/2022 date)

 15
• Remove planned resource retirements (OTC gas units, Diablo Canyon11, Intermountain, etc.) and
 age-based retirements
 • Update load forecast and load modifiers according to the 2021 IEPR forecast (including
 consumption, behind-the-meter (BTM) PV, additional achievable energy efficiency (AAEE), time-
 of-use (TOU), and electric vehicle (EV) loads)

Loads were held constant at the 2030 level, because load changes between 2025 and 2030 are expected
to have minimal impact on ELCCs and changing loads between study tranches would have introduced
another variable to disentangle from the aggregated impact of increasing solar and storage penetration.
The final CAISO portfolio onto which incremental resources were added is described in

11
 Per SB846, Diablo Canyon is excluded from this analysis. "The bill would require that the PUC not include, and
disallow a load-serving entity from including in their adopted resource plan, the energy, capacity, or any attribute
from the Diablo Canyon powerplant in the integrated resource plan portfolios beyond specified dates, and would
require the Energy Commission not consider the energy, capacity, or any attribute from the Diablo Canyon
powerplant in meeting the above state policy."
 16
Table 3 below.

The solar and storage ELCC surface design assumed incremental utility-scale solar based on the 2022
updated 38 MMT Preferred System Plan (PSP) portfolio, adopted in D.22-02-004, while incremental BTM
PV additions were based on the 2021 IEPR forecast. Indications are that using a 30 MMT PSP portfolio
would not materially change the results before 2028. Storage additions were designed to capture a range
of additions of both 4-hour and 8-hour duration storage that would enable interpolating to determine the
nameplate storage additions needed to fill each tranche with energy storage ELCC MW. The solar and
storage capacities in each tranche are described further in tables in the Solar and Storage Surface Inputs
section below. The solar and storage additions assumed to fill each MTR tranche are shown in Figure 5.
Solar and storage additions by MTR tranche

Figure 5. Solar and storage additions by MTR tranche

Once the solar and storage additions for each MTR tranche were interpolated from solar and storage ELCC
surface points, in-state wind storage was modeled as incremental to the assumed solar and storage
starting points for each tranche. In other words, the Tranche 4 in-state wind ELCCs were modeled as the
incremental ELCC on top of a portfolio of resources that included the Tranche 3 solar and storage
additions. This captured the interactive effects between the solar and storage additions on wind
incremental ELCCs.

As noted in Figure 5. Solar and storage additions by MTR tranche, resource additions modeled to build the
ELCC surface in all years except for 2028 are comprised only of solar and 4-hour batteries. Resource
 17
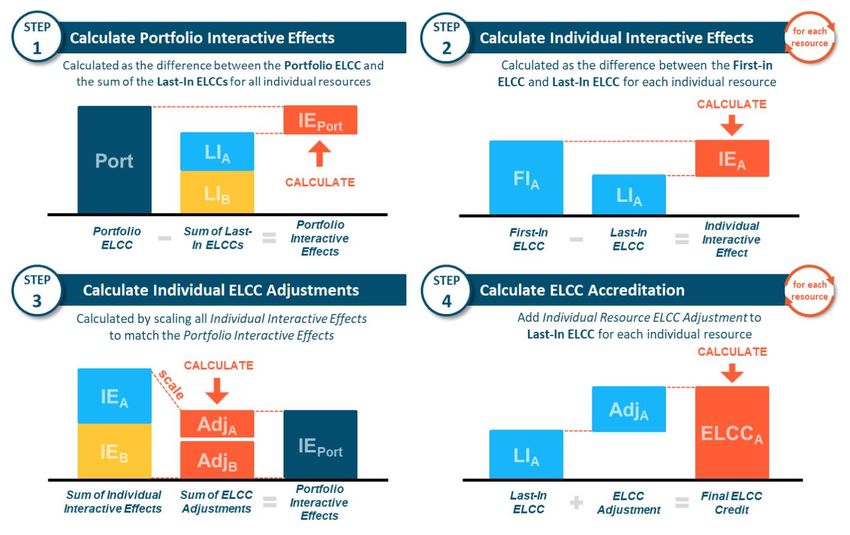
additions in 2028 (Tranche 6) are comprised of 1 NQC gigawatt (GW) of zero-carbon firm capacity, 1 NQC
GW of long duration energy storage (LDES, modeled as 8-hour battery storage), and 2.7 GW of solar
nameplate capacity.

When solar and storage are added together, they provide diversity benefits that make a portfolio of solar
and storage resources contribute more to reliability than the sum of their individual ELCCs. These diversity
benefits were allocated between solar and storage with the delta method, using the portfolio ELCC and
the estimated first-in and last-in marginal ELCCs for solar and storage within each MTR tranche on the
surface. E3 developed the delta method, illustrated in Figure 6. Delta Method ELCC Allocation
Methodology, to credit each resource in a portfolio of resources in a manner that reflects the nature of
their synergistic, antagonistic, or neutral interactions with the portfolio by adjusting last-in ELCC based on
its difference from its first-in ELCC. The method allocates interactive effects while balancing the goals of
reliability, fairness, efficiency, and acceptability. It is intended to be scalable across a portfolio of multiple
resource types but can be used as well on a portfolio with two resource types (as modeled here for solar
and storage).

Figure 6. Delta Method ELCC Allocation Methodology12

12
 For additional background information on E3’s Delta Method see the following: N. Schlag, Z. Ming, A. Olson, L.
Alagappan, B. Carron, K. Steinberger, and H. Jiang, "Capacity and Reliability Planning in the Era of Decarbonization:
Practical Application of Effective Load Carrying Capability in Resource Adequacy," Energy and Environmental
Economics, Inc., Aug. 2020.
 18
The ELCC results are referred to as “incremental” ELCC. Marginal ELCCs refer to the ELCC benefit of adding
one additional MW to a system (or another reasonably small amount). Incremental ELCCs refer to the
ELCC benefit of a larger incremental addition or the subsequent benefits of multiple increments of
additions. Because larger levels of additions are considered in this study, including multiple increments of
solar and storage, the ELCC results are referred to as “incremental” ELCCs.

Key areas of uncertainty contained within the study design include the assumed solar capacity additions
(both BTM and utility-scale), modeled vs. actual performance of energy storage resources in the CAISO
market, and the impact of recent extreme weather on SERVM’s CAISO load shapes and resource
availability. Sensitivity runs examined the magnitude of each of these factors.

 19
INPUT ASSUMPTIONS

SUMMARY OF INPUT UPDATES FROM 2021 MTR ELCC STUDY
Several input updates were made to the SERVM model since the 2021 MTR ELCC study. A summary of
changes is shown in the table below, with additional details on input development in the following
sections.

Table 2. Summary of changes vs Previous MTR Study

 Input 2021 MTR ELCC Study 2023 MTR ELCC Study

 Weather Years 1998-2017 1998-2020

 Aligned with 2021 database Aligned with 2022 database
 created by Energy Division in created by Energy Division in
 Solar Profiles
 support of RA and IRP support of RA and IRP
 proceedings proceedings13

 Astrapé developed synthetic Aligned with 2022 database
 CA and Out of State Wind
 profiles using historical CAISO created by Energy Division in
 Profiles
 settlement data support of RA and IRP proceedings

 Aligned with 2022 database
 Aligned with 2021 database
 created by Energy Division in
 created by Energy Division in
 Offshore Wind Profiles support of RA and IRP proceedings,
 support of RA and IRP
 with additional adjustments for
 proceedings
 system losses

 Explicit neighboring zones modeled
 Imports Fixed Import Profiles with net peak aggregated import
 limit

 Aligned with 2021 database Detrending of total hydro energy in
 created by Energy Division in earlier weather years and
 Hydro Modeling
 support of RA and IRP decoupling historic hydro dispatch
 proceedings from specific weather years

 Aligned with 2021 database Aligned with 2022 database
 created by Energy Division in created by Energy Division in
 Load Profiles
 support of RA and IRP support of RA and IRP proceedings
 proceedings with additional shape adjustment

13 Available here: https://www.cpuc.ca.gov/industries-and-topics/electrical-energy/electric-power-
procurement/long-term-procurement-planning/2022-irp-cycle-events-and-materials/unified-ra-and-irp-modeling-
datasets-2022

 20
to better align with IEPR 2021
 managed peak forecasts

IMPORTS

Fixed import shapes from the previous MTR study were replaced with explicit modeling of external regions
one transmission tie away from CAISO to capture the generator outage and load diversity benefit available
to CAISO. Loads and resources were updated to reflect the most recent estimates of variable-energy
resource (solar, battery, wind) penetration levels in neighboring regions as indicated in the WECC 2032
Anchor Data Set (ADS). Perfect capacity additions and load adders were applied as necessary across each
individual neighboring region such that the total annual LOLE was shown to be between 0.05 and 0.15.
Reliability was tuned to approximately 0.1 LOLE since the objective of including neighboring systems in
this reliability study is to capture the benefits of resource diversity and generator outage diversity. If
neighboring zones were above 0.1 LOLE, California would be “subsidizing” the neighbor’s reliability –
carrying too much capacity to meet its own needs to keep neighbors at 0.1. If neighboring zones were
below 0.1 LOLE, those zones would be subsidizing California’s reliability needs. This approach assumes
that the Northwest and Southwest regions will in the long run trend towards load and resource balance
(i.e., 0.1 LOLE), adding capacity if they are under-reliable today and retiring capacity if they are over-
reliable.

Modeled regions include the following:

 • Northwest
 o Bonneville Power Administration-Transmission (BPAT)
 o Portland Gas & Electric
 o PacifiCorp West
 • Southwest
 o Arizona Public Service Company
 o Nevada Power Company
 o Western Area Power Administration (Lower Colorado)
 o Salt River Project
 • Non-CAISO California
 o Imperial Irrigation District
 o Los Angeles Department of Water and Power
 o Turlock Irrigation District
 o Sacramento Municipal Utility District

An additional transmission import constraint was applied to the hourly modeling in SERVM, which limited
the total unspecified imports (aggregate value across all of CAISO) from all neighboring regions during the
anticipated sales peak period. The sales peak period was defined as hour ending 17 through 22 for each
day of the year. The aggregated import limit was set to 4,000MW for all ELCC simulations.

 21
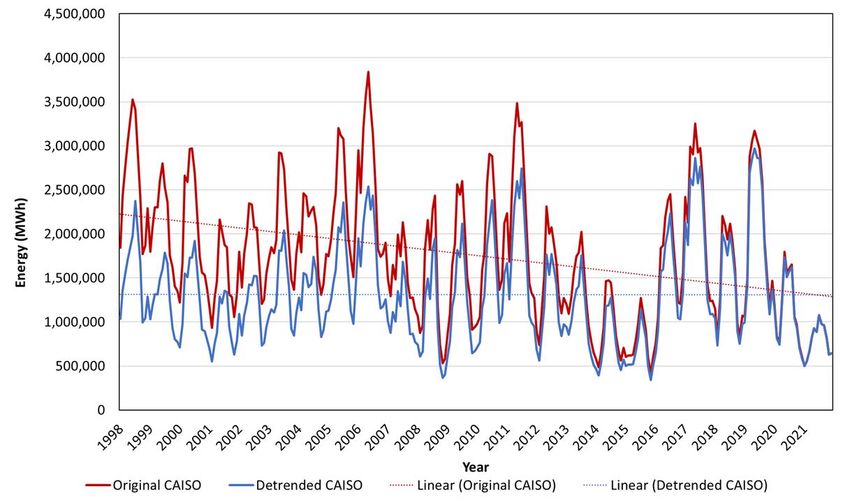
HYDRO

SERVM models hydro units by specifying operating constraints by month using historical hourly and
monthly hydro generation data. Key input variables include maximum capacity values, daily scheduled
flow range (minimum and maximum hydro dispatch levels based on an average load day), and total
monthly hydro energy. SERVM utilizes a proportional load following algorithm to determine ideal dispatch
to schedule more during high load hours and less during low load hours while still respecting monthly
energy and maximum capacity value constraints.

All hydro input variables for CAISO and the modeled neighboring regions were updated using the most
recent historical hourly hydro generation data from CAISO, BPAT, and the United States Energy
Information Administration (EIA) between 2018-2021. In addition, 23 years of historical total monthly
hydro energy production (1998-2020) from EIA was analyzed. Using the 2018-2021 hourly data,
relationships were established between monthly hydro energy production and the following variables:
daily maximum dispatch, daily minimum dispatch, and monthly maximum capacity. These relationships
based on recent hourly data provide a realistic understanding of how hydro resources are currently being
dispatched within CAISO and its neighbors. Historical monthly energy data from historical weather years
further in the past can then be used to determine the associated monthly maximum, daily average
maximum, and daily average minimum by month for those weather years. The relationships for CAISO
hydro resources are shown in the figure below as an example.

Figure 7. Historical CAISO Hydro Data

 Max output
 on August 14
 & 15, 2020

Before applying the relationships above to the historical monthly hydro energy data from EIA between
1998-2020, the monthly hydro energy values were detrended to reflect the declining total energy

 22
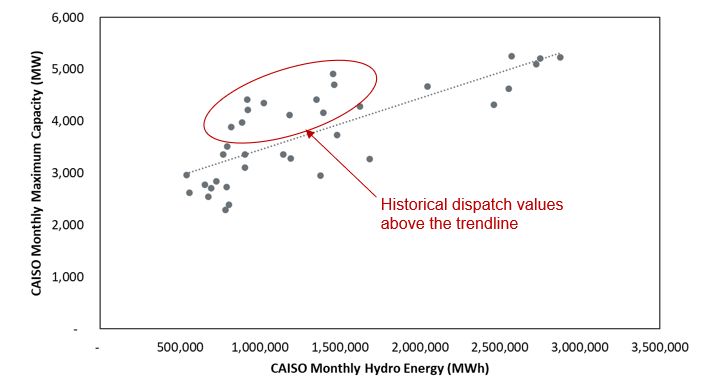
available from hydro resources in recent years. This decreased the total monthly hydro energy for weather
years in the more distant past to avoid overestimating the expected availability from hydro in the future.
Figure 8 below shows the original monthly energy values and the “detrended” values that were utilized
in the updated SERVM input parameters.

Figure 8. Original and Updated "Detrended" CAISO Hydro Energy Availability

Emergency hydro units were also modeled as an improvement to the MTR ELCC analysis. These units
reflect the additional maximum dispatch capability of existing hydro resources that would be expected
to be utilized during emergency conditions. The difference between actual monthly maximum hydro
dispatched and the trended dispatch values were compared to determine the availability of additional
emergency hydro capacity. Historical months below 1.5 terawatt-hour (TWh) of total hydro energy
production were modeled with 817 MW of emergency hydro capacity (677 MW for Pacific Gas and
Electric (PGE) and 140 MW for Southern California Edison (SCE). Above 1.5 TWh of total hydro energy,
the total capacity of emergency hydro decreased linearly as total hydro energy increased. Emergency
hydro availability is limited to 20 hours of dispatch. Emergency hydro capacity was not considered to be
available for historical months where the total hydro energy exceeded 2.48 TWh. The figure below
demonstrates the observed historical dispatch values that were seen to be greater than the trendline for
CAISO hydro resources.

 23
Figure 9. Historical CAISO Hydro Maximum Output

Lastly, to get a better statistical sampling of hydro resource performance across all modeled weather year
and load forecast error combinations, hydro performance was decoupled from the historical weather year
in SERVM simulations. Instead of modeling 1998 hydro performance alongside the load and renewable
profiles associated with the 1998 weather year, the 1998 hydro conditions were modeled across all
weather years (and so on for each hydro performance year). The chart below shows the correlation
between historical hydro energy production and the CAISO annual gross load peak. This low correlation
implies that a high load weather year is just as likely to experience a high amount of hydro energy
production as it is to experience a low amount of energy production.

Figure 10. CAISO Annual Hydro Production vs. Annual CAISO Peak

 24
The resulting combination of weather years (load), hydro performance year, and load forecast errors that
were applied to each ELCC scenario is summarized in the formula below.

 23 ℎ ⋅ 23 ℎ ⋅ 5
 = 2,645

CALIFORNIA AND OUT-OF-STATE WIND PROFILES
Creation of wind production profiles requires a production curve that translates wind speed data into
hourly generation (MWh) from wind turbines. For onshore and out of state wind production curves, staff
created a curve based on historical MWh wind generation data sourced from CAISO and other sources
based on historic availability.

For the 2021 MTR ELCC study, wind speed data was sourced from the National Climate Data Center ISD-
Lite database. For the 2023 MTR ELCC study, wind speed data was updated using the NASA MERRA2
dataset which consists of greater availability and granularity of weather data. Due to the growing diversity
of wind generator locations and the very specific locational differences between wind speeds, the more
granular data set was needed. In addition, due to the need for creation of 23 years of weather history, it
was critical to use a dataset that covers the entire set of simulated weather years. In this case, staff used
weather data from 1998 through 2020 to create sufficient weather variability.

Astrapé provided support in this development to calibrate wind production on peak load days with
historical production data. The updated wind profiles reflect slightly lower output on average during
summer afternoons for in-state wind, which is the primary contributor to slightly lower ELCCs.

OFFSHORE WIND PROFILES

The offshore wind profiles were updated by the Energy Division using available weather data and applying
the NREL offshore wind output response curve. For the 2021 MTR ELCC study, wind production curves
were sourced from NREL data, due to the lack of existing wind generation (MWh) data from offshore wind
generators. Wind speed data was sourced from the National Climate Data Center ISD-Lite database.

For the 2023 MTR ELCC study, wind profiles were updated using the NASA MERRA2 dataset. This change
in source for historical wind speed data was due to the need for greater availability and granularity of
weather data. Due to the growing diversity of locations which will be sites for wind generators, and the
very specific locational differences between wind speeds, the more granular data set was needed. In
addition, due to the need for creation of 23 years of weather history, it was critical to use a dataset that
covers the entire set of weather years needed. In this case, staff used weather data from 1998 through
2020 to create sufficient weather variability. Astrapé applied an additional derating factor across all hours

 25
of the year by approximately 12% to account for environmental, technical, electrical, and availability
losses as defined by the National Renewable Energy Laboratory (NREL)14.

Figure 11. Daily Average Wind Output Comparison (2023 MTR ELCC Study vs. 2021 MTR ELCC Study)

LOAD PROFILES

The load shapes utilized in this analysis were based on the synthetic load shapes for weather years 1998-
2020 developed as part of the IRP and RA proceedings using 2021 IEPR 2021 forecast data. An additional
adjustment to the load shapes was applied to align with the 2021 IEPR managed peak load forecast by
adjusting afternoon hours (HE16-24) for high load days in summer months (June through September). The
normalized load shapes before and after the adjustment are shown in the figure below. A sensitivity was
performed to understand the impact this load adjustment had on the ELCC values for Tranche 3.

14
 https://www.nrel.gov/docs/fy22osti/82341.pdf

 26
Figure 12. Average Normalized September Load (> 45 GW Daily Peak)

SUMMARY OF KEY INPUTS

MTR BASELINE PORTFOLIO
The Baseline Portfolio used in SERVM is provided in

 27
Table 3. Base Resource Mix. This portfolio reflects the baseline portfolio used to determine the MTR
Decision’s 11.5 GW capacity need and procurement target, as well as projected LSE resource additions
through 2024 for compliance with the D.19-11-016 procurement order and MTR Tranches 1 and 2. The
study year of 2030 was selected for developing the solar and storage ELCC matrix with the necessary
amount of perfect capacity added to calibrate the base case to 0.1 LOLE. To ensure all ELCC values within
the matrix were calculated using the method described in the methodology section above (i.e., adding
incremental resources and removing perfect capacity), a small amount of thermal resources were
replaced with perfect capacity. This avoided the potential for modeling an incremental resource addition
in later tranches with a reliability value that exceeded the amount of perfect capacity available in the
system to remove. The selection of the 2030 study year did not impact the established presumed
penetration for key resources such as solar, wind, and battery storage.

 28
Table 3. Base Resource Mix

 Unit Category Nameplate
 Capacity (MW)

 Battery Storage 12,093

 Biogas 223

 Biomass/Wood 442

 CC 14,771

 Coal 0

 Cogen 335

 CT 7,329
 DR 2,392

 Geothermal 1,376

 Hydro15 4,568
 ICE 259
 Nuclear 635
 PSH 1,483

 Utility Solar + 40,305
 BTMPV
 Wind 7,286

SOLAR AND STORAGE SURFACE INPUTS
The proposed solar and storage surface for use in 2022-23 IRP inputs and assumptions is shown in Error!
Reference source not found., which provides a heatmap indicating the marginal/incremental storage
ELCCs and the marginal/incremental solar ELCCs for various penetrations of solar and storage. This large
surface was generated from SERVM for use in RESOLVE capacity expansion, whereby the optimization is
granted wide freedom to test the reliability and economics of traversing in multiple directions across the
surface.

The battery ELCC and solar ELCC heatmaps are nearly a perfect inverse of one another, clearly displaying
the fact that the diversity benefits associated with adding solar and storage in tandem are critical to
supporting the ELCC of the other resource as penetrations increase. RESOLVE is likely to find that – for

15
 2020 Weather Year value

 29
solar and storage as reliability assets – the least-cost solution to meeting long-term reliability needs is to
add a combination of solar and storage such that the incremental storage ELCC is maintained as much as
possible. This involves straddling the diagonal line that bifurcates each table between the zones where
incremental ELCC is maintained (e.g., where solar can support batteries to be sufficiently charged).
Eventually, even these diversity impacts become saturated as the net load peak may shift outside of the
traditional days or seasons when solar energy is abundant. At this point, the economic solution to long-
term reliability needs is to diversify the portfolio by adding other resources, most critically adding or
maintaining firm capacity – that can operate on demand through low solar periods – but also adding anti-
correlated renewables to solar such as onshore, out-of-state, and offshore wind.

Figure 13. Proposed RESOLVE Solar and Storage Surface + the Subsection Studied in this Report

From this larger solar and storage surface used for long-term planning, a smaller solar and storage surface
was developed to drill down with greater precision on the specific MTR tranches ordered by the CPUC.
Notably this is a key region of the surface where solar and storage interactive effects become pronounced
and storage ELCCs decline dramatically without additional concurrent solar additions.

The nameplate solar and storage additions added by each tranche are provided in Table 4. The utility solar
additions were assumed to be all single-axis tracking. The solar and surface ELCC design assumed
incremental utility-scale and BTM solar additions in 2025, 2026, 2027, and 2028 based on the average
annual additions of 2,700 MW between 2025 and 2030 in the 2022 updated 38 MMT PSP and 2021 IEPR
forecast. This led to 2,700 MW of utility-scale and BTM solar being added to the MTR baseline portfolio
each year for each year of the analysis period (2025-2028). Storage additions were added to allow
interpolation such that the combined solar and storage ELCC added was sufficient to fill the tranche.
Recognizing that the ELCC contributions of incremental storage additions are less than 100%, the
incremental storage nameplate simulated to fill each tranche was higher than the tranche size in NQC.

 30
You can also read