Omicron: a mysterious variant of concern
←
→
Page content transcription
If your browser does not render page correctly, please read the page content below
Eur. Phys. J. Plus     (2022) 137:100
https://doi.org/10.1140/epjp/s13360-021-02321-y

Letter to the Editor

Omicron: a mysterious variant of concern

A. Gowrisankar1,a , T. M. C. Priyanka1,b , Santo Banerjee2,c
1 Department of Mathematics, School of Advanced Sciences, Vellore Institute of Technology, Vellore, Tamil
 Nadu 632 014, India
2 Dipartimento di Scienze Matematiche, Politecnico di Torino, Corso Duca degli Abruzzi, 24, 10129 Torino,
 Italy

Received: 14 December 2021 / Accepted: 21 December 2021
© The Author(s), under exclusive licence to Società Italiana di Fisica and Springer-Verlag GmbH Germany,
part of Springer Nature 2022

Abstract Omicron (B.1.1.529), a highly mutated SARS-CoV-2 variant, has emerged in the
south of African continent in the November 2021. The spike protein of Omicron has 26 amino
acid mutations, which makes it distinct from the other variants of concern. Researches are
underway to know the virulence and transmission rate of Omicron variant. In this letter, the
seven-day moving average of most affected Omicron variant countries Denmark, Germany,
India, Netherlands, South Africa and UK has been investigated and compared with each other.
Further, the seven-day average of daily positive Omicron cases of the prescribed countries has
been predicted for the months of December 2021, January 2022 and February 2022 using the
fractal interpolation method. Results elucidate that the curve of daily positive case follows
the same pattern even though the new variant of concern, Omicron added in the existing
variants.

1 Introduction

On December 31, 2019, the World Health Organization (WHO) has received the first report of
Corona Virus Disease 2019 (COVID-19) from Wuhan city, China. Despite the fact that Chi-
nese cities implemented lockdowns to restrict the spread of infection, the measures were inef-
fective, and the disease has since spread around the world. As a result, the WHO announced
COVID-19, a global pandemic on the month of March. Initially, this unforeseen global pan-
demic caused chaos on almost every sphere of human life. Since the first reported case of
COVID-19, the world is experiencing successive waves. On November 24, 2021, a new
SARS-CoV-2 variant has been reported to the WHO from South Africa. The new variant
(B.1.1.529) has been officially named Omicron (the fifteenth Greek alphabet), as a variant
of concern. The rapid spread of this highly mutated strain across six continents in less than
a week has sparked a global health alarm. Since its discovery, Omicron has been identi-
fied in more than 50 countries on six continents. When compared to the previous variants
of SARS-CoV-2: Alpha, Beta, Gamma, Delta, Omicron is found to be the most prominent
variant and distinct from the millions of SARS-CoV-2 genomes. Compared to the Wuhan

a e-mail: gowrisankargri@gmail.com
b e-mail: priyankamohan195@gmail.com
c e-mail: santoban@gmail.com (corresponding author)

                                          0123456789().: V,-vol                             123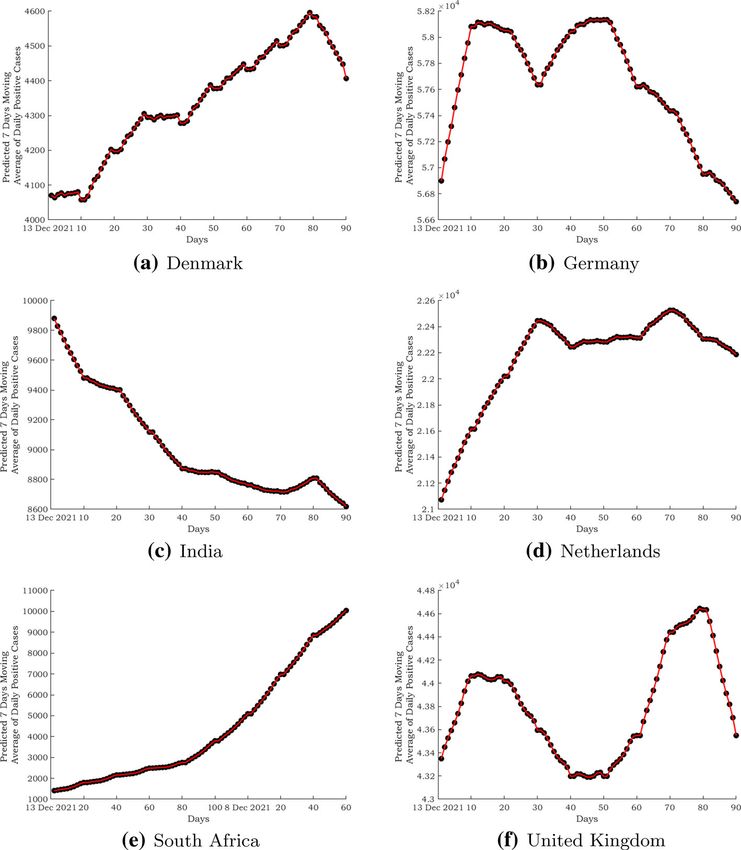
100   Page 2 of 8                                          Eur. Phys. J. Plus       (2022) 137:100

variant, it has 6 mutations which led to its increased transmissibility and vaccine resistance.
The aggressive surge of Omicron is making it the major corona virus strain, displacing the
worldwide prevalent Delta form. As of now, PCR tests have been used to detect this variant.
However, Omicron is expected to be highly transmissible; it is unclear whether it is really
higher transmissible than Delta. Furthermore, emerging research suggests that it is spreading
like wildfire in the context of the continued spread of the Delta variant and the greater natural
immunity to the Delta variant. If the current trends continues, Omicron is expected to make
the Delta a more common variant. The reader is encouraged to refer [1–3] for more informa-
tion on Omicron. Recently, for analyzing and predicting the nature as well as the successive
waves of COVID-19, fractal-based methods have been used, see, for instance, [4–7].
    In this analysis, the seven-day moving average of daily positive cases of the six countries,
namely Denmark, Germany, India, Netherlands, South Africa and UK, is investigated. The
fractal interpolation function is used to construct the graph of seven-day moving average. By
considering the time (in days) and the value of seven-day moving average as the data points,
the fractal curve is obtained. In addition, the seven-day moving average for the six countries
is predicted for the upcoming three months from December 13, 2021.

2 Method

Moving average is a statistical measure, evaluated to examine the data by calculating series
of averages of the different subsets of the entire data set. It is usually calculated to reduce
the randomness, short-term fluctuations of the data and to identify the trend direction of the
data. As it is dependent on the past data, it is considered as a trend following indicator. In this
letter, seven-day moving average of daily positive cases is calculated by taking the average
of past 7-day data. The graph of the seven-day moving average is drawn using the fractal
interpolation. The data set {(t j , x j ) : j = 0, 1, . . . , N } is taken where t j and x j denote the
time in days and seven-day moving average of the daily positive cases starting from January
27, 2020, respectively. The fractal interpolation function is constructed using the following
affine transformations


                                      t   aj 0     t   ej
                                wj      =            +                                                   (1)
                                      x    cj dj   x   fj

satisfying the join-up conditions w j (t0 , x0 ) = (t j−1 , x j−1 ), w j (t N , x N ) = (t j , x j ), j =
1, 2, . . . , N , where a j , c j , d j , e j and f j all real parameters. If d j is a predefined variable in
the system (1) with join-up conditions, then it provides a unique solution for (1). Therefore,
for j = 1, 2. . . . , N , the constants a j , c j , e j , f j can be obtained uniquely as follows:

                                  t j − t j−1
                            aj =
                                    t N − t0
                                  t N t j−1 − t0 t j
                             ej =
                                       t N − t0
                                                                                                         (2)
                                  (x j − x j−1 ) − d j (x N − x0 )
                             cj =
                                                t N − t0
                                  (t N x j−1 − t0 x j ) − d j (t N x0 − t0 x N )
                             fj =                                                .
                                                     t N − t0

123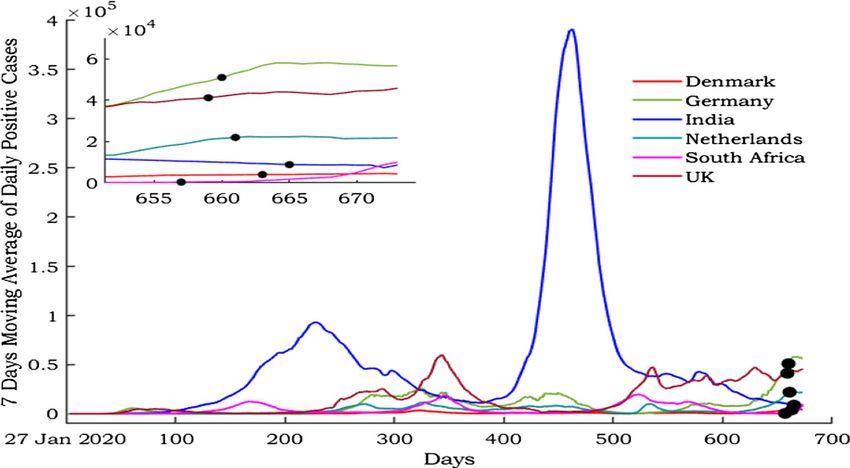
Eur. Phys. J. Plus    (2022) 137:100                                         Page 3 of 8    100

Fig. 1 Comparison of 7-day moving average of daily positive cases of Denmark, Germany, India, Netherlands,
South Africa and UK. Black dot indicates the occurrence of first Omicron case

The free parameter |d j |
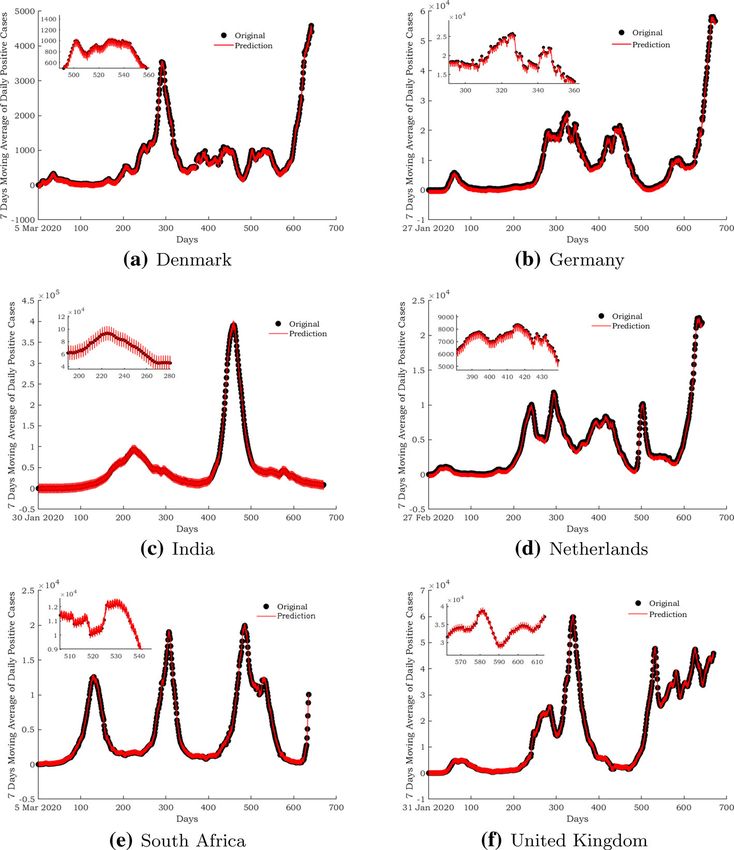
100   Page 4 of 8                                       Eur. Phys. J. Plus    (2022) 137:100

Fig. 2 Reproduced curves of 7-day moving average: a Denmark, (b Germany, c India, d Netherlands, e South
Africa and f UK

As of December 13, 2021, the total number of confirmed cases and Omicron cases are found
to be 6,531,606 and 101, respectively.
   The first confirmed case of SARS-CoV-2 is reported in India on January 30, 2020. As the
positive cases started to increase day by day, the government declared a national lockdown
on March 25, 2020. During the first wave, India, like other parts of the world, has seen a
sharp increase in COVID-19 cases and deaths. For the first time on the month of June 2020,
India’s recoveries outnumber current cases. The number of daily positive cases, as well as
infection rates, has begun to decline in September 2020. From Fig. 2c, it is observed that the
daily positive cases peaked in mid-September, with over 90,000 recorded each day, and have
decreased to less than 15,000 in January 2021. Further, Fig. 2c indicates that the second wave,

123
Eur. Phys. J. Plus   (2022) 137:100                                      Page 5 of 8   100

Fig. 3 Predicted seven-day moving average of daily positive cases starting from December 13, 2021: a
Denmark, b Germany, c India, d Netherlands, e South Africa and f UK

which started in March 2021, is observed to be more devastating than the first wave. From
January 16, 2021, onward, vaccination program has been conducted and administered more
than 500 million doses as of August 2021. However, there has been no statewide shutdown
in India during the second wave of the pandemic. The B.1.617 (dominant in Maharashtra),
B.1.1.7 (state of Delhi and Punjab) and B.1.618 (West Bengal) variants are the different types
of strains reported during the two waves. On December 2, 2021, the first case of Omicron has
been identified in India. As of December 13, 2021, the country has confirmed 35 Omicron
cases.
   Netherlands is exposed to the COVID-19 virus when the first case is identified in Tilburg,
on February 27, 2020. All the four variants of concern: Alpha variant (B.1.1.7), Beta variant

                                                                                        123
100 Page 6 of 8 Eur. Phys. J. Plus (2022) 137:100
(B.1.351), Gamma variant (P.1) and Delta variant (B.1.617.2) have been detected in Nether-
lands. Figure 2d shows that the first wave has ended at the beginning of July 2020, with no
gap, the second wave has started from the end of July 2020, since then, there has been a
huge rise in the number of daily positive cases. During the second wave, to reduce the risk
of transmission of Lineage B.1.1.7, which is thought to be more infectious, the government
has proposed strict laws in January 2021. From Fig. 2d, it is observed that the number of
daily positive cases in the country has reached its maximum during the months of October
and December 2021. Further, we can notice that the number of daily positive cases has been
steadily increasing after the confirmation of first Omicron variant (B.1.1.529) in November
2021. Over 24.4 million vaccinations are estimated to have been provided in the Netherlands
by Sunday, December 5, 2021. It is expected that 88.8% of adults over the age of 18 have had
at least one vaccination, with 85.5% having received all of them. A total of 2,880,426 con-
firmed cases have been identified in the country on December 13, 2021. In South Africa, the
first case has been confirmed on March 1, 2020, and the President of the country, Ramaphosa
declared a 21-day national lockdown. From Fig. 2a, the first wave can be observed from
March to November 2020. At the end of November 2020, 790,004 confirmed cases have
been documented. From December 2020 onward, the second wave has commenced and
501.V2 variant has been discovered by the scientists. During the second wave, the number
of confirmed cases has crossed one million and it has ended in April 2021 with 1,581,210
confirmed cases. With no delay, third wave has begun from May 2021 onward with B.1.1.7
variant of concern, C.1.2 Lineage variant and the number of confirmed cases observed at the
end of October 2021 is 2,921,886. On November 24, 2021, the B.1.1.529 variant is initially
reported to WHO by South Africa. The epidemiological condition of the country has been
marked by three different peaks in documented cases, the most recent of which is dominated
by the Delta strain. The spread of infection has risen sharply in recent weeks, corresponding
with the discovery of the B.1.1.529 strain. A specimen collected on November 9, 2021, is
the first reported B.1.1.529 infection. On November 26, 2021, the WHO designed the name
Omicron for the new variant. Figure 2e shows that as a result of Omicron, South Africa has
entered the fourth wave of COVID-19, and the rise in daily positive cases is substantially
faster than the previous three waves in almost all provinces. The Omicron variation spreads
twice as quickly as the Delta variant and is the most contagious of the SARS-CoV-2 strains.
On November 29, 2021, 2,858 daily positive cases have been reported, while 16,055 daily
positive cases have been reported on December 4, 2021. This record clearly depicts how
severe and fast is the Omicron variant. The country has confirmed 900 Omicron cases as of
13 December.
UK has reported its first case in the month of January 2020. Prime Minister Boris Johnson
declared a state of emergency on March 23, 2020. The first wave of COVID-19 has come
to the end at June 2020. In December 2020, vaccination program has been implemented in
the country. From Fig. 2f, it is noticed that the second wave has started at the beginning of
September 2020; there is an initial peak in January 2021 and the number of daily positive cases
has started gradually decreasing during March 2021. With the Delta variant, the third wave
has emerged in UK at the end of July 2021; since then, the curve is continually increasing.
The Omicron variant has reached UK in late November 2021. UK stands in the first place
with the highest number of confirmed Omicron cases in the world. As of December 13,
2021, a total of 10,819,519 confirmed cases and more than 1500 Omicron cases have been
documented. In Fig. 2, the pattern of the epidemic is reproduced by the fractal interpolation
function given in Eq. 1; hence, each reproduced curve has a self-similar pattern which is
elucidated in subfigures.
123Eur. Phys. J. Plus (2022) 137:100 Page 7 of 8 100
Figure 1 compares the 7-day moving average of daily positive cases of the countries
Denmark, Germany, India, Netherlands, South Africa and UK. After the first reporting case
of Omicron variant, the following results can be clearly visualized from the subfigure: there
is no major change in the graphs of Denmark and India, the graph of Germany and South
Africa increases steeply, whereas the curves of Netherlands and UK seem to have slight
fluctuations.
Figure 3 illustrates the prediction of 7-day moving average of Denmark, Germany, India,
Netherlands, South Africa and UK for the months of December 2021, January 2022 and
February 2022. From Fig. 3a, one can observe that the graph of Denmark shows a rapid
growth until the end of January 2022 and then the graph begins to fall down. In Fig. 3b,
Germany’s graph exhibits variations until the end of January 2022 and the graph starts to
decline steadily. In Fig. 3c, India’s seven-day moving average of daily positive cases graph
drops until mid-February 2022 and then rises slightly near the end of the month. Figure 3d
demonstrates that the steep increase in the graph of Netherlands begins to fluctuate for the
next several days as of January 2022. Figure 3e indicates a health alert to South Africa since
the curve shows progressive rise from December 2021 to the end of February 2022 with no
fall. The UK’s graph in Fig. 3f reaches two peaks during the mid-December 2021 and late
February 2022.
4 Conclusion
The evolution of SARS-CoV-2 virus is changing with respect to time which is the natural
character of any virus. In general, while virus changing one mutant to another, its properties
remain same or create little impact. Recently, a new SARS-CoV-2 variant Omicron has been
reported to the WHO which is distinct from the previous variants of SARS-CoV-2: Alpha,
Beta, Gamma, Delta. Hence, science community is searching the impact of new variant on
the SARS-CoV-2, such as transmissibility, disease severity, diagnostic method, efficiency
of existing vaccines and other COVID-19 protocols. This study evidences that there are no
rapid changes or sudden acceleration in the pattern of epidemic curves even though the new
variant Omicron included with the previous variant of concern. The present study provides the
answer for transmissibility of a new variant; however, the consistency of the results depends
on the answer of whether Omicron is able to evade the vaccine-induced immunity or not.
Data availability statement The data for this letter have been taken from the World Health Organization,
COVID-19 Data Repository by the Center for Systems Science and Engineering and Our World in Data
[10–12].
References
1. S.S.A. Karim, Q.A. Karim, Lancet (2021). https://doi.org/10.1016/S0140-6736(21)02758-6
2. A. Vaughan, New Sci. 252, 7 (2021)
3. E. Petersen et al., Int. J. Infect. Dis. (2021). https://doi.org/10.1016/j.ijid.2021.11.040
4. D. Easwaramoorthy, A. Gowrisankar, A. Manimaran, S. Nandhini, L. Rondoni, S. Banerjee, Nonlinear
Dyn. 106(2), 1375–1395 (2021)
5. C. Kavitha, A. Gowrisankar, S. Banerjee, Eur. Phys. J. Plus 136(5), 1–12 (2021)
6. A. Gowrisankar, L. Rondoni, S. Banerjee, Eur. Phys. J. Plus 135(6), 1–9 (2020)
7. P. Cristina-Maria, N. Bogdan-Radu, Chaos Solitons Fractals 139, 110073 (2020)
8. M.F. Barnsley, Constr. Approx. 2, 303–329 (1986)
123100 Page 8 of 8 Eur. Phys. J. Plus (2022) 137:100
9. S. Banerjee, D. Easwaramoorthy, A. Gowrisankar, Fractal Functions, Dimensions and Signal Analysis
(Springer, Cham, 2021)
10. WHO, Coronavirus Disease (COVID-2019) Situation Reports. https://www.who.int/emergencies/
diseases/novel-coronavirus-2019/situation-reports/
11. COVID-19 Data Repository by the Center for Systems Science and Engineering (CSSE) at Johns Hopkins
University. https://github.com/CSSEGISandData/COVID-19
12. M. Roser, H. Ritchie, E. Ortiz-Ospina, J. Hasell, Coronavirus Pandemic (COVID-19) (2020). OurWorldIn-
Data.org. https://ourworldindata.org/coronavirus
123You can also read