OKLAHOMA Economic Indicators - September 2022
←
→
Page content transcription
If your browser does not render page correctly, please read the page content below

OKLAHOMA
Economic Indicators
    September 2022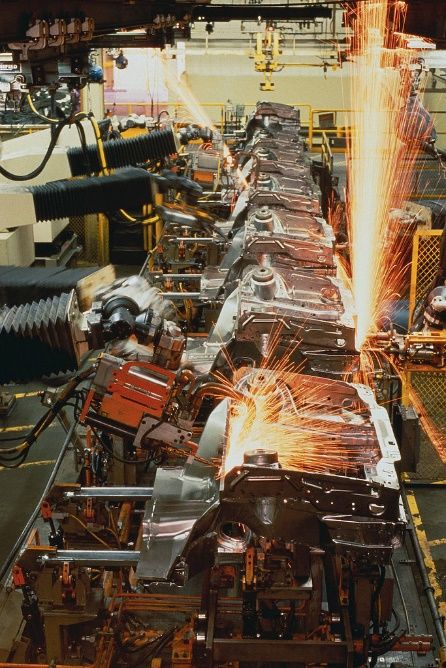
OKLAHOMA
                    ECONOMIC INDICATORS

                           Oklahoma Employment Security Commission
                               Shelley Zumwalt, Executive Director

                             Economic Research and Analysis Division
                              Lynn Gray, Director & Chief Economist

                                           Prepared by
                                   Monty Evans, Senior Economist

                                Will Rogers Memorial Office Building
                                  Labor Market Information Unit
                                           P.O. Box 52003
                                  Oklahoma City, OK 73152-2003
                                       Phone: (405) 557-5369
                                        Fax: (405) 525-0139
                                   E-mail: lmi1@oesc.state.ok.us

                                     September 2022

This publication is issued and is part of the activities of the Oklahoma Employment Security Commission
   as authorized by the Oklahoma Employment Security Act. An electronic copy has been deposited
              with the Publishing Clearinghouse of the Oklahoma Department of Libraries.

                                 Equal Opportunity Employer/Program
         Auxiliary aids and services are available upon request for individuals with disabilities
TABLE OF CONTENTS

SPECIAL REPORT: Oklahoma Industry and Occupational Employment Projections:
2020-2030 ........................................................................................................................... 2
U.S. Real Gross Domestic Product and Quarterly Change .................................................. 6
Oklahoma’s Real Gross Domestic Product and Quarterly Change ..................................... 8
Industry Share of Oklahoma’s Economy. ............................................................................ 9
Metropolitan Area Contribution to State Real GDP ......................................................... 10
Coincident Economic Activity Index for Oklahoma .......................................................... 11
U.S. and Oklahoma Unemployment Rates ....................................................................... 12
U.S. and Oklahoma Nonfarm Payroll Employment .......................................................... 13
Oklahoma Employment Change by Industry (2020-2021) ............................................... 14
U.S. and Oklahoma Manufacturing Employment. ............................................................ 15
Purchasing Managers’ Index (Manufacturing) ................................................................. 16
Oklahoma Active Rotary Rigs and Cushing, OK WTI Spot Price ........................................ 18
Oklahoma Active Rotary Rigs and Henry Hub Natural Gas Spot Price. ............................ 20
U.S. Total Residential Building Permits. ............................................................................ 22
Oklahoma Total Residential Building Permits................................................................... 23
U.S. and Oklahoma Real Personal Income........................................................................ 24
Industry Contribution to Oklahoma Personal Income ...................................................... 25
U.S. Adjusted Retail Sales ................................................................................................. 26
Oklahoma Total Adjusted Retail Sales. ............................................................................. 27

September 2022                                                                                                             Page 1

SPECIAL REPORT:
Oklahoma Industry and Occupational Projections: 2020 to 2030
Introduction
Every other year, the Oklahoma Employment Security Commission produces long-term industry
and occupational employment projections with the base year of the projections decade being an
even-numbered year. Our goal is not necessarily to predict the exact level of employment ten
years in the future, but rather to determine overall trends that can be used for career and policy
planning. Employment projections help to facilitate career exploration by high school students
and their teachers and parents, college students, career changers, and career development and
guidance specialists. Employment projections are also widely used by policymakers and education
and training officials to make decisions about education and training policy, funding, and program
offerings. Additionally, other state agencies, researchers, and academics use the projections to
understand trends in the economy and labor market.

Industry Projections
Total employment is projected to grow from 1,721,170 to 1,900,560 over the 2020–30 decade,
an increase of 179,390 jobs. This increase reflects an annual growth rate of 1.0 percent, which is
higher than recent projections cycles and accounts for recovery from low base-year employment
for 2020 due to the COVID-19 pandemic and its associated recession. Employment in only one of
Oklahoma's industry supersectors, government, is anticipated to decline in the coming years, (see
Chart 1, above and Table 1, next page).
In the goods-producing industries, employment in natural resources and mining is projected to
grow the fastest, adding 12,970 jobs (2.8 percent annually), almost all of which are anticipated to
be in oil and gas extraction (6,070 jobs) and support activities for mining (5,770 jobs).
Manufacturing employment is projected to add 15,670 jobs (1.1 percent annually). Employment
in construction is forecast to add 7,360 jobs ( 0.9 percent annually) over the 2020-30 decade.

September 2022                                                                            Page 2
Table 1: Oklahoma Long-Term Industry Employment Projections, 2020-2030
                                                                                                                       Annual
                                                                                                      Numeric          Percent
Supersector                                                              2020            2030          Change          Change
Total Employment ¹                                                  1,721,170       1,900,560         179,390             1.00
  Natural Resources and Mining                                         40,730          53,700           12,970            2.80
  Construction                                                         78,790          86,150            7,360            0.90
  Manufacturing                                                       131,230         146,900           15,670            1.13
  Trade, Transportation, and Utilities                                304,240         316,640           12,400            0.40
  Information                                                          18,220          20,980            2,750            1.42
  Financial Activities                                                 76,780          78,030            1,260            0.16
  Professional and Business Services                                  185,290         212,480           27,190            1.38
  Education and Health Services                                       377,610         425,910           48,300            1.21
  Leisure and Hospitality                                             175,950         229,370           53,430            2.69
  Other Services (Except Government)                                   66,100          70,360            4,270            0.63
  Government                                                          174,690         168,860           -5,830           -0.34
  ¹Total employment includes covered and non-covered employment, agricultural employment and self-employed workers.
  Source: Employment Projections Program, Oklahoma Employment Security Commission, Economic Research & Analysis Division

For the services-providing industries, employment in leisure and hospitality is projected to grow
the fastest (2.7 percent annually) among all sectors over the 2020–30 decade, adding 53,430 jobs.
This growth is largely driven by recovery from the pandemic, as restaurants, hotels, and arts,
cultural, and recreational related establishments with low 2020 base-year employment levels see
restored demand from the public resuming recreational and in-person activities.
Employment in education and health services is projected to add the second most jobs of all
industry supersectors, about 48,300 jobs over 2020–30. Health care and social assistance is
projected to increase by 38,880 jobs, with an annual growth rate of 1.2 percent.
Professional & business services employment is expected to add 27,190 jobs (1.4 percent
annually) in the 2020-2030 decade. More than half of the job growth in this industry is led by gains
in the administrative and support services sector which is projected to add 17,610 jobs (1.9
percent). Technological advancements are expected to support strong employment growth in
professional, scientific, and technical services forecast to contribute 10,480 jobs (1.3 percent).
The broad trade, transportation & utilities supersector is forecast to add 12,400 jobs (0.4 percent)
between 2020 and 2030. Retail trade (8,110 jobs), wholesale trade (2,130 jobs), and
transportation and warehousing (580 jobs) are all projected to add employment during the
forecast period. Utilities is forecast to add 1,580 jobs during the forecast period.
Information is forecast to gain 2,750 jobs (1.4 percent annually) over the 2020 to 2030 decade.
The financial activities supersector is projected to add 1,260 jobs (0.2 percent annually) between
2020 and 2030 as gains in real estate and rental & leasing (1,670 jobs) were partially offset by
losses in finance & insurance (-420 jobs).
Other services (except government) is expected to add 4,270 jobs for a 0.6 percent annual gain
between 2020 and 2030.
Government employment, (excluding casinos, casino hotels, education and hospitals), is
projected to decline at an annual rate of 0.3 percent, losing 5,830 jobs during the 2020-2030
period, as gains in local government (4,420 jobs) are more than offset by losses in federal
government (-3,880 jobs) and state government (-6,370 jobs).

September 2022                                                                                                         Page 3
Occupational Projections Turning to occupational projections, a solid 215,380 annual total openings are projected from 2020 to 2030, with 17,940 being new jobs created during this period. The remaining 197,440 annual job openings are due to the need to replace workers who retire or leave their occupations for other reasons. Personal care and service occupations and food preparation and serving related occupations are also projected for projected for the fastest employment growth among all occupational groups (23.6 percent), mainly due to recovery growth following low 2020 base-year employment. Healthcare support occupations are also projected for rapid employment growth (19.6 percent). Healthcare occupations and those associated with healthcare (including mental health) account for 6 of the 30 fastest growing occupations from 2020 to 2030. Demand for healthcare services, from both aging baby boomers and from people who have chronic conditions, will drive the projected employment growth. Computer and mathematical occupations are expected to see fast employment growth (14.1 percent) as strong demand is expected for IT security and software development, in part due to increased prevalence of telework spurred by the COVID-19 pandemic. Advances in, and implementation of, renewable energy technologies are expected to drive employment growth in the occupation with the highest projected growth rate, wind turbine technicians (106.2 percent). Despite the rapid growth projected for this occupation, its small employment level means that only 240 new jobs are projected from 2020 to 2030. Technological changes facilitating increased automation are expected to result in slower employment growth for office and administrative support occupations (2.0 percent), sales occupations (4.1 percent), and production occupations (7.7 percent), (see Table 2, next page). September 2022 Page 4
Table 2: Oklahoma Occupational Employment Estimates & Projections, 2020-2030
                                                                                                                    Annual
                                                                                          Numeric      Percent       Total
Aggregate Occupational Group                                         2020        2030      Change      Change     Openings
Total, All Occupations                                          1,721,170   1,900,560     179,390         10.4     215,380
  Management, Business, and Financial Occupations¹                 93,600     211,480       18,930        20.2      18,490
  Computer, Engineering, and Science²                              75,990      85,900        9,910        13.0       7,030
  Education, Legal, Community Service, Arts, and Media³           162,170     176,540       14,380         8.9      16,290
  Healthcare Practitioners and Technical⁴                         117,430     134,530       17,100        14.6       8,840
  Service Occupations⁵                                            351,160     418,970       67,820        19.3      63,020
  Sales and Related Occupations                                   167,820     174,650        6,830         4.1      23,240
  Office and Administrative Support Occupations                   229,790     234,370        4,580         2.0      25,730
  Farming, Fishing, and Forestry Occupations                        8,060       8,670          610         7.5       1,360
  Construction and Extraction Occupations                          91,370     101,900       10,530        11.5      10,770
  Installation, Maintenance, and Repair Occupations                81,090      90,360        9,270        11.4       8,980
  Production Occupations                                          105,080     113,130        8,040         7.7      12,580
  Transportation and Material Moving Occupations                  138,670     150,070       11,400         8.2      19,040
Notes:
  ¹Major occupational groups 11-0000 through 13-0000 in the 2010 Standard Occupational Classification (SOC).
  ²Major occupational groups 15-0000 through 19-0000 in the 2010 Standard Occupational Classification (SOC).
  ³Major occupational groups 21-0000 through 27-0000 in the 2010 Standard Occupational Classification (SOC).
  ⁴Major occupational group 29-0000 in the 2010 Standard Occupational Classification (SOC).
  ⁵Major occupational groups 31-0000 through 39-0000 in the 2010 Standard Occupational Classification (SOC).
Source: Employment Projections program, Oklahoma Employment Security Commission, Economic Research & Analysis Division

More Information
Detailed interactive forecast tables and charts are available at:
Industry and Occupational Employment Projections (oklahoma.gov)
There you will find interactive industry and occupational projections data for the 2020-2030
period as well as the 2021-2023 short-term industry and occupational projections and 2018-2028
long-term projections for Oklahoma’s metropolitan and non-metropolitan areas.

September 2022                                                                                                    Page 5
Definition & Importance Gross Domestic Product (GDP)—the output of goods and services produced by labor and property located in the United States—is the broadest measure of economic activity. It is also the measure that is most indicative of whether the economy is in recession. In the post-World War II period, there has been no recession in which GDP did not decrease in at least two quarters, (the exceptions being during the recessions of 1960-61 and 2001). The Bureau of Economic Analysis (BEA), U.S. Department of Commerce releases GDP data on a quarterly basis, usually during the fourth week of the month. Data are for the prior quarter, so data released in April are for the 1st quarter. Each quarter's data are revised in each of the following two months after the initial release. Each revision is based on more complete economic data. Background There are four major components to GDP: 1. Personal consumption expenditures: Individuals purchase durable goods (such as furniture and cars), nondurable goods (such as clothing and food) and services (such as banking, education, and transportation). 2. Investment: Private housing purchases are classified as residential investment. Businesses invest in nonresidential structures, durable equipment, and computer software. Inventories at all stages of production are counted as investment. Only inventory changes, not levels, are added to GDP. 3. Net exports: Equal the sum of exports less imports. Exports are the purchases by foreigners of goods and services produced in the United States. Imports represent domestic purchases of foreign-produced goods and services and are deducted from the calculation of GDP. 4. Government: Government purchases of goods and services are the compensation of government employees and purchases from businesses and abroad. Data show the portion September 2022 Page 6
attributed to consumption and investment. Government outlays for transfer payments or interest
payments are not included in GDP.
The four major categories of GDP—personal consumption expenditures, investment, net exports
and government—all reveal important information about the economy and should be monitored
separately. This allows one to determine the strengths and weaknesses of the economy.
Current Developments
The U.S. economy contracted from April through June, although less than previously thought, as
consumer spending and business inventory estimates were revised upward. Real gross domestic
product (GDP) decreased at an annual rate of 0.6 percent in the 2nd quarter of 2022, according
to the "second" estimate released by the Bureau of Economic Analysis (BEA). In the 1st quarter,
real GDP decreased 1.6 percent.
Consumer spending, which accounts for more than two-thirds of U.S. economic activity, slowed
to a 1.5 percent rate, faster than 1.0 percent initially estimated but down from the 1.8 percent
pace in the 1st quarter. Spending on services, such as food services and accommodations and
health care, was revised lower to 3.6 percent, was partly offset by a 2.4 percent decline in goods,
as outlays on durable goods decreased 0.1 percent, while spending on nondurable goods, such as
food and beverages, declined 3.7 percent. Personal consumption expenditures (PCE) added 0.99
percentage point to 2nd quarter GDP growth, instead of 0.70 percentage point reported
previously.
Business investment was flat in the 2nd quarter, held back by spending on structures, after a 10.0
percent increase in the 1st quarter. Spending on structures, which are tied to the oil and gas sector
and commercial real estate, plunged 13.2 percent, while outlays on equipment slumped 2.7
percent in the 2nd quarter. Spending on intellectual property products, such as
computer software, grew at a 10.0 percent rate. Nonresidential fixed investment did not
contribute to 2nd quarter GDP, after adding 1.26 percentage points in the previous quarter.
Business inventories tumbled in the 2nd quarter, as businesses slowed their restocking of shelves
by $104.6 billion. The change in private inventories shaved 1.83 percentage points from GDP
growth in the 2nd quarter, following a 0.35 percentage point deduction in the 1st quarter.
Housing construction plunged in the 2nd quarter, as higher borrowing rates appear to be cooling
the housing market. Residential housing investment shrank at a 16.2 percent annual rate.
Residential fixed investment trimmed 0.83 percentage point from 2nd quarter GDP.
The trade deficit fell after hitting a record high in the 1st quarter, as exports surged 17.6 percent,
while imports rose just 2.8 percent. The narrowing of trade deficit added 1.42 percentage points
to 2nd quarter GDP. The record trade gap in 1st quarter was largely responsible for the decline in
GDP, subtracting 3.23 percentage points.
Government consumption expenditures declined again in the 2nd quarter, reflecting decreases in
government pandemic assistance payments. Federal government spending sank 3.9 percent in
the 2nd quarter, as national defense spending rose 1.1 percent, while nondefense spending fell
10.4 percent. Consumption outlays by state and local governments declined 0.6 percent in the
2nd quarter. Government consumption expenditures and investment subtracted 0.32 percentage
point from 2nd quarter GDP, after subtracting 0.51 in the 1st quarter.

September 2022                                                                               Page 7
Definition & Importance
The U.S. Bureau of Economic Analysis (BEA) produces statistics of quarterly gross domestic
product (GDP) by state dating back to 2005. These statistics provide a more complete picture of
economic growth across states that can be used with other regional data to gain a better
understanding of regional economies as they evolve from quarter to quarter. The new data
provide a fuller description of the accelerations, decelerations, and turning points in economic
growth at the state level, including key information about changes in the distribution of industrial
infrastructure across states.
Current Developments
Real gross domestic product (GDP) by state—a measure of nationwide growth calculated as the
sum of GDP of all states and the District of Columbia—decreased in 46 states and the District of
Columbia in the 1st quarter of 2022, as real GDP for the nation decreased at an annual rate of 1.6
percent, according to the Bureau of Economic Analysis (BEA). The percent change in real GDP in
the 1st quarter ranged from 1.2 percent in New Hampshire to –9.7 percent in Wyoming.
Oklahoma’s real GDP declined 3.7 percent in the 1st quarter of 2022, following an 8.1 percent
pace in the 4th quarter, ranking Oklahoma 43rd among all other states and the District of
Columbia. Statewide GDP was at a level of 197.0. billion (in constant 2012 dollars) in the 1st
quarter, down $1.8 billion from the 4th quarter level of $198.8 billion.

September 2022                                                                             Page 8
Real GDP decreased in 8 of the 21 industry groups that the BEA prepares quarterly state estimates.
Nondurable goods manufacturing, retail trade, and finance and insurance decreased 17.0, 10.2,
and 7.1 percent, respectively, for the nation and were the leading contributors to the decrease in
real GDP. These three industries contributed decreases in all 50 states and the District of
Columbia. In Oklahoma, nondurable goods manufacturing, retail trade, and finance and insurance
subtracted -0.88, -0.52, and -0.22 percentage point, respectively, from 1st quarter GDP.
Mining, quarrying, and oil and gas extraction contributed decreases in 49 states, including
Oklahoma. This industry was the leading contributor to the decreases in 10 states, including
Wyoming, Alaska, North Dakota, West Virginia, and New Mexico—the 5 states with the largest
decreases in real GDP. In Oklahoma, mining, quarrying, and oil and gas extraction was the leading
contributor to the decrease in 1st quarter GDP, subtracting 2.09 percentage points.
Government and government enterprises was the leading contributor to the increases in New
Hampshire and Massachusetts—the states with the largest and third-largest increases in real GDP,
respectively. In Oklahoma, government and government enterprises added 0.38 percentage
points to the state’s GDP in the 1st quarter of 2022.
Agriculture, forestry, fishing, and hunting was the leading contributor to the increase in
Vermont—the state with the second-largest increase. In Oklahoma, agriculture, forestry, fishing,
and hunting subtracted 0.55 percentage point from 1st quarter GDP.
Utilities was the leading contributor to the increase in Michigan—the only other state with an
increase. Utilities was also the leading contributor to 1st quarter GDP in Oklahoma, adding 0.49
percentage point.

September 2022                                                                           Page 9
Definition & Importance
Metropolitan Statistical Areas (MSA) are county-based definitions developed by the Office of
Management and Budget for federal statistical purposes. A metropolitan area is defined as a
geographic area consisting of a large population nucleus together with adjacent communities
having a high degree of economic and social integration with the nucleus.
GDP by metropolitan area is the sub-state counterpart of the Nation's gross domestic product
(GDP), the BEA's featured and most comprehensive measure of U.S. economic activity. GDP by
metropolitan area is derived as the sum of the GDP originating in all the industries in the
metropolitan area. Nationally, metropolitan statistical areas represent approximately 90 percent
of total GDP. In Oklahoma, the four MSAs of Oklahoma City, Tulsa, Lawton, and Enid accounted
for 71.8 percent of total state GDP in 2020.
Current Developments
Real gross domestic product (GDP) declined in 351 out of 384 metropolitan areas in 2020,
according to the U.S. Bureau of Economic Analysis (BEA). The percent change in real GDP by
metropolitan area ranged from 5.2 percent in Sierra Vista-Douglas, AZ to -20.4 percent in Kahului-
Wailuku-Lahaina, HI. Real GDP for U.S. metropolitan areas decreased 3.5 percent in 2020, as every
major industry group, (with the exception of information and finance, insurance, real estate,
rental, and leasing), saw declines over the year.
In 2020, none of Oklahoma’s four metropolitan areas experienced positive GDP growth. Enid
MSA’s GDP fell 5.0 percent in 2020 to a level of $2.99 billion, ranking it 306th among 384 metro
areas. Lawton MSA GDP declined 2.0 percent in 2020 to a level of $4.55 billion, and ranked 134th
among U.S. metro areas. Oklahoma City MSA dropped 5.4 percent to $77.3 billion and ranked
333rd, lifted by professional, scientific, and technical services. Tulsa MSA’s GDP fell 5.0 percent to
a level of $51.9 and ranked 309th in 2020, boosted by mining, quarrying, and oil and gas
extraction.

September 2022                                                                               Page 10
Definition & Importance
The Federal Reserve Bank of Philadelphia produces a monthly coincident index for each of the 50
states. The indexes are released a few days after the Bureau of Labor Statistics (BLS) releases the
employment data for the states. The Bank issues a release each month describing recent trends
in the state indexes, with special coverage of the three states in the Third District: Pennsylvania,
New Jersey, and Delaware.
The coincident indexes combine four state-level indicators to summarize current economic
conditions in a single statistic. The four state-level variables in each coincident index are nonfarm
payroll employment, average hours worked in manufacturing by production workers, the
unemployment rate, and wage and salary disbursements deflated by the consumer price index
(U.S. city average). The trend for each state’s index is set to the trend of its gross domestic product
(GDP), so long-term growth in the state’s index matches long-term growth in its GDP.
Current Developments
The Federal Reserve Bank of Philadelphia has released the coincident indexes for the 50 states for
July 2022. Over the past three months, the indexes increased in 47 states, decreased in two states,
and remained stable in one, for a three-month diffusion index of 90. Additionally, in the past
month, the indexes increased in 44 states, decreased in three states, and remained stable in three,
for a one-month diffusion index of 82. For comparison purposes, the Philadelphia Fed has also
developed a similar coincident index for the entire United States. The Philadelphia Fed’s U.S. index
increased 1.1 percent over the past three months and 0.4 percent in July.
In the three months to July, the coincident index for Oklahoma rose 0.2 percent. The level of
payroll employment increased over the past three months. However, the unemployment rate
rose during the three-month period. Additionally, average hours worked in manufacturing fell.
Overall, Oklahoma’s economic activity as measured by the coincident index has risen 4.5 percent
over the past 12 months.

September 2022                                                                                Page 11
Definition & Importance
The Bureau of Labor Statistics Local Area Unemployment Statistics (LAUS) program produces
monthly estimates of total employment and unemployment from a national survey of 60,000
households. The unemployment rate measures the percentage of people who are without work
and is calculated by dividing the estimated number of unemployed people by the civilian labor
force. The result expresses unemployment as a percentage of the labor force.
The unemployment rate is a lagging indicator of economic activity. During a recession, many
people leave the labor force entirely. As a result, the jobless rate may not increase as much as
expected. This means that the jobless rate may continue to increase in the early stages of recovery
because more people are returning to the labor force as they believe they will be able to find
work. The civilian unemployment rate tends towards greater stability than payroll employment
on a monthly basis and reveals the degree to which labor resources are utilized in the economy.
Current Developments
The U.S. unemployment rate ticked higher in August, as more workers rejoined the labor force. In
August, the unemployment rate rose by 0.2 percentage point to 3.7 percent, and the number of
unemployed persons increased by 344,000 to 6.0 million, according to the Bureau of Labor
Statistics (BLS). The BLS noted that in July, these measures had returned to their levels in February
2020, prior to the coronavirus (COVID-19) pandemic.
Oklahoma’s seasonally adjusted unemployment rate moved up 0.1 percentage point to 3.0
percent in July. Over the year, Oklahoma’s seasonally adjusted unemployment rate was 0.9
percentage point lower than July 2021.
In July, Latimer County posted Oklahoma's highest county unemployment rate of 7.3 percent,
while Cimarron County reported the lowest county unemployment rate of 1.2 percent.
Unemployment rates in July were lower than a year earlier in 72 of Oklahoma’s 77 counties, lower
in 2 counties, and unchanged in 3 counties.

September 2022                                                                              Page 12
Definition & Importance
Nonfarm payroll employment data is produced by the Current Employment Statistics (CES)
program of the Bureau of Labor Statistics (BLS). The CES Survey is a monthly survey of
approximately 145,000 businesses and government agencies representing approximately 697,000
worksites throughout the United States. The CES program has provided estimates of employment,
hours, and earnings data by industry for the nation as a whole, all States, and most major
metropolitan areas since 1939. In order to account for the size disparity between of U.S. and
Oklahoma employment levels, we have indexed the data with January 2001 as the start value.
Payroll employment is one of the most current and reliable indicators of economic conditions and
recessionary trends. Increases in nonfarm payrolls translate into earnings that workers will spend
on goods and services in the economy. The greater the increases in employment, the faster the
total economic growth.
Current Developments
U.S. payroll growth rose solidly in August although at a slower pace than the previous month,
lifting the level of employment back to its pre-pandemic level. Total nonfarm payroll employment
increased by 315,000 in August, according to the Bureau of Labor Statistics (BLS). Nonfarm
employment has risen by 5.8 million over the past 12 months, as the labor market continued to
recover from the job losses of the pandemic-induced recession. This growth brings total nonfarm
employment 240,000 higher than its pre-pandemic level in February 2020.
Oklahoma’s seasonally adjusted nonfarm employment grew by 3,800 jobs (0.2 percent) in July, to
a level of 1,691,100 while June’s estimate was downwardly revised to 1,687,300. In July, seven of
Oklahoma’s supersectors added jobs as financial activities and leisure & hospitality (1,000 jobs)
shared the largest monthly gains. Other services (-500 jobs) followed by information (-100 jobs)
posted the largest over-the-month job losses in July. Eight of Oklahoma’s supersectors reported
job growth over the year in July, as trade. transportation & utilities (10,000 jobs) reported the
largest gain, followed by leisure & hospitality (8,600 jobs). Sectors showing declines were
information (-1,000 jobs) followed by other services (-500 jobs).
September 2022                                                                           Page 13
Definition & Importance
Employment growth by industry identifies the types of jobs being created in the state. Conversely,
industries with a declining employment trend indicate those which are becoming less important
in the state’s economy. There may also be industries which behave more cyclically, growing during
expansion and decreasing in times of economic slowdown or contraction. These changes are
crucial in that they help to recognize the types of jobs being lost by individuals. Anticipating what
will happen in recovery helps identify whether those jobs will return or what types of new jobs
will be created. Consequently, key information for planning re-employment, retraining, and other
workforce and economic development programs is contained within these data. For this analysis,
we are using CES non-seasonally adjusted annual averages to compare year-over-year
employment changes.
Current Developments
Oklahoma’s annual average nonfarm employment added jobs in 2021, following a dip in 2020 as
business closures due to the COVID-19 pandemic pulled employment down. Total nonfarm
employment added a non-seasonally adjusted 14,900 jobs (0.9 percent) in 2021. For comparison,
77,500 jobs were lost for a 4.5 percent decline in the previous year.
In 2021, six of 11 of Oklahoma’s supersectors reported job gains. Leisure and hospitality saw the
largest job gain adding 8,500 jobs (5.4 percent), as accommodation and food services accounted
for most of the job gains (7,700 jobs). Trade, transportation, and utilities gained 8,300 jobs (2.7
percent), as retail trade added 4,900 jobs over the year. Professional and business services
employment grew by 5,000 jobs (6.3 percent) as employment services gained 4,200 jobs. Other
sectors were financial activities (1,300 jobs), and education and health services (1,100 jobs).
Mining and logging shed 4,000 jobs (-12.7 percent) during the 2020-2021 period as support
activities for mining lost 2,500 jobs. Manufacturing employment declined by 2,400 jobs (-1.8
percent) with durable goods manufacturing accounting for all the job losses. Construction lost
1,700 jobs (-2.2 percent); government declined by 1,100 jobs (-0.3 percent); and information shed
500 jobs.
September 2022                                                                              Page 14
Definition & Importance
Manufacturing employment data is also produced by the Bureau of Labor Statistics’ Current
Employment Statistics (CES) program. Manufacturing and production are still important parts of
both the U.S. and Oklahoma economies. According to the 2020 County Business Patterns, the
manufacturing sector was the 5th-largest employer, employing 12.0 million workers in the United
States—and the top 10 average annual employee payroll at $61,653. In Oklahoma, manufacturing
accounts for one of the largest shares of private output and employment in the state. In addition,
many manufacturing jobs are among the highest paying jobs in the state. In order to account for
the size disparity between the U.S. and Oklahoma employment levels, we have indexed the data
with January 2001 as the starting value.
Current Developments
U.S. factory hiring continued to trend up in August. Manufacturing employment increased by
22,000 in August, with gains concentrated in durable goods industries (19,000), according to the
Bureau of Labor Statistics (BLS). Manufacturing has added 461,000 jobs over the year.
Oklahoma manufacturing employment shed a seasonally adjusted 100 jobs (-0.1 percent) over
the month in July to a level of 133,430. All of the job losses in July were in durable goods
manufacturing, while non-durable goods manufacturing employment was flat over the month.
Over the year, statewide manufacturing employment added a seasonally adjusted 4,500 jobs (3.5
percent) compared to July 2021, as durable goods manufacturing gained 2,400 jobs (2.8 percent)
and non-durable goods manufacturing added 2,100 jobs (4.8 percent).

September 2022                                                                           Page 15
Definition & Importance
Economists consider the Institute for Supply Management’s Purchasing Managers’ Index (PMI™)
a key economic indicator. The Institute for Supply Management (ISM®) surveys more than 300
manufacturing firms on employment, production, new orders, supplier deliveries, and
inventories. The ISM® manufacturing index is constructed so that any level at 50 or above signifies
growth in the manufacturing sector, which accounts for about 12 percent of the U.S. economy. A
level above 43 or so, but below 50, indicates that the U.S. economy is still growing even though
the manufacturing sector is contracting. Any level below 43 indicates that the economy is in
recession.
For the region, since 1994, the Creighton Economic Forecasting Group at Creighton University has
conducted a monthly survey of supply managers in nine states (including Arkansas, Iowa, Kansas,
Minnesota, Missouri, Nebraska, North Dakota, Oklahoma, and South Dakota), to produce leading
economic indicators for the Mid-America economy using the same methodology as the national
survey by the ISM®.
Current Developments
U.S. factory activity held steady in August, as employment and new orders rebounded, while
supply bottlenecks continued to ease and a measure of prices paid for inputs by factories fell to a
two-year low, suggesting inflation may have peaked. The August Manufacturing PMI® registered
52.8 percent, the same reading as recorded in July, according to the latest ISM Manufacturing
Report On Business®.
The survey’s forward-looking measure of new orders rebounded to 51.3 August, from a reading
of 48.0 in July, ending two straight monthly decreases. The gauge of factory employment jumped
to a reading of 54.2 from 49.9 in July. Prices continued to ease in July, as the gauge of prices paid
by manufacturers dropped to 52.5, the lowest level since June 2020, from 60.0 in July. The
measure of supplier deliveries slipped to 55.1 from 55.2 in July. A reading above 50 indicates
slower deliveries to factories.

September 2022                                                                              Page 16
The Creighton University Mid-America Business Conditions Index, a leading economic indicator
for the nine-state region stretching from Minnesota to Arkansas, rose above growth neutral for
the 27th straight month. The August Business Conditions Index, which uses the identical
methodology as the national ISM and ranges between 0 and 100 with 50.0 representing growth
neutral, dropped to a solid 55.5 in August from July’s 59.8. The Mid-America report is produced
independently from the national ISM.
“Creighton’s monthly survey results indicate the region continues to add manufacturing activity
at a solid pace—with significant but declining inflationary pressures. Supply chain disruptions
eased further in August, according to supply managers,” said Ernie Goss, Ph.D., director of
Creighton University’s Economic Forecasting Group and the Jack A. MacAllister Chair in Regional
Economics in the Heider College of Business.
Oklahoma’s Business Conditions Index declined in August to a level indicating still healthy growth.
The August index decreased to 60.7 from 63.2 in July. Components of the overall August index
were: new orders at 45.3, production or sales at 59.7, delivery lead time at 74.3, inventories at
65.7 and employment at 58.3.
“Durable goods manufacturers, including metal producers, are reporting solid growth, but with
current employment, seasonally adjusted, below pre-pandemic levels. Non-durable goods
producers, excluding food processors, are reporting solid growth. USBLS data indicate that
average hourly manufacturing wages have expanded by 5.5 percent over the past 12 months,”
said Goss.

September 2022                                                                            Page 17
Definition & Importance
Crude oil is an important commodity in the global market. Prices fluctuate depending on supply
and demand conditions in the world. Since oil is such an important part of the economy, it can
also help determine the direction of inflation. In the U.S. consumer prices have moderated
whenever oil prices have fallen but have accelerated when oil prices have risen. The U.S. Energy
Information Administration (EIA) provides weekly information on petroleum inventories in the
U.S., whether produced here or abroad.
The Baker Hughes rig count is an important indicator for the energy industry and Oklahoma. When
drilling rigs are active, they consume products and services produced by the oil service industry.
The active rig count acts as a leading indicator of demand for products used in drilling, completing,
producing, and processing hydrocarbons.
West Texas Intermediate (WTI-Cushing) is a light crude oil produced in Texas and southern
Oklahoma which serves as a reference or "marker" for pricing a number of other crude streams
and which is set in the domestic spot market at Cushing, Oklahoma.
Background
The discovery of oil transformed Oklahoma's economy. By the time Oklahoma became a state in
1907, it was the largest oil producer in the nation. Excluding federal offshore areas, Oklahoma
was the 6th-largest crude oil producer among the states in 2021, accounting for over 4 percent of
the nation's crude oil production (at 143,052,000 barrels). Crude oil wells and gathering pipeline
systems are concentrated in central Oklahoma. One of the 100 largest oil fields in the United
States, the Sho-Vel-Tum field, in eastern Stephens and western Carter Counties has continuously
produced crude oil since its discovery in 1905.
The city of Cushing, in central Oklahoma, is a major crude oil trading hub connecting Gulf Coast
producers to Midwest refining markets. In addition to Oklahoma crude oil, the Cushing hub
receives supply from several major pipelines that originate in Texas. Traditionally, the Cushing
Hub has pushed Gulf Coast and Mid-Continent crude oil supply north to Midwest refining markets.

September 2022                                                                              Page 18
However, production from those regions is in decline, and an underused crude oil pipeline system
has been reversed to deliver rapidly expanding heavy crude oil supply produced in Alberta,
Canada to Cushing, where it can access Gulf Coast refining markets. For this reason, Cushing is the
designated delivery point for the New York Mercantile Exchange (NYMEX) crude oil futures
contracts. Crude oil supplies from Cushing that are not delivered to the Midwest are fed to
Oklahoma’s five refineries. As of January 2021, those refineries had a combined distillation
capacity of more than 522,000 barrels per day—roughly 3.0 percent of the total U.S. refining
capacity.
Current Developments
The U.S. Energy Information Administration (EIA) noted that the September 2022 Short-Term
Energy Outlook (STEO) that the possibility of petroleum supply disruptions and slower-than-
expected crude oil production growth continues to create the potential for higher oil prices, while
the possibility of slower-than-forecast economic growth creates the potential for lower prices.
EIA forecasts the spot price of international benchmark Brent crude oil will average $98 per barrel
(bbl) in the 4th quarter of 2022 and $97/bbl in 2023. Domestic benchmark West Texas
Intermediate is forecast to be $6/bbl lower than Brent crude.
EIA forecasts that U.S. crude oil production will average 11.8 million barrels per day (bbl/d) in
2022 and 12.6 million bbl/d in 2023, which would set a record for the most U.S. crude oil
production during a year. The current record is 12.3 million bbl/d, set in 2019.
Crude production in Oklahoma declined over the month in June—the most recently reported
monthly data point. Statewide field production of crude oil was at a preliminary level of
12,516,000 bbl in June, 618,000 bbl (4.7 percent) less than the downwardly revised May level of
13,134,000 bbl, according to data reported by the EIA. Compared to a year ago, Oklahoma crude
production was up 794,000 bbl (6.8 percent) from the June 2021 production level of 11,722,000
bbl.
West Texas Intermediate (WTI-Cushing) crude oil for delivery at Cushing, Oklahoma, averaged
$93.67/bbl in August, dropping $7.95/bbl from July’s average of $101.62/bbl. The EIA noted that
lower prices in August likely reflected overall increases in global petroleum inventories as a result
of ongoing growth in global production of crude oil.
According to oil field services company Baker Hughes, oil-directed rig activity in the United States,
which reflect crude oil drilling, was up 4 at 605 for the week ending August 26, 2022, while the
nation’s total rig count was up 3 to a level of 765. Compared to a year ago, the nation’s total rig
count was 195 more than 410 rigs reported on August 27, 2021.
For the week ending August 26, 2022, the state’s total active rig count was at a level of 65, and
up 1 rig from a month earlier, according to Baker Hughes. Oil-directed rigs accounted for 95
percent of total rig activity in August. Oklahoma’s active rig count was up 34 from 31 active rigs
reported operating on August 27, 2021.

September 2022                                                                              Page 19
Definition & Importance
The U.S. Energy Information Administration (EIA) provides weekly information on natural gas
stocks in underground storage for the U.S., and three regions of the country. The level of
inventories helps determine prices for natural gas products. Natural gas product prices are
determined by supply and demand—like any other good or service. During periods of strong
economic growth, one would expect demand to be robust. If inventories are low, this will lead to
increases in natural gas prices. If inventories are high and rising in a period of strong demand,
prices may not need to increase at all, or as much. However, during a period of sluggish economic
activity, demand for natural gas may not be as strong. If inventories are rising, this may push down
oil prices.
The Henry Hub in Erath, Louisiana is a key benchmark location for natural gas pricing throughout
the United States. The Henry Hub is the largest centralized point for natural gas spot and futures
trading in the United States. The New York Mercantile Exchange (NYMEX) uses the Henry Hub as
the point of delivery for its natural gas futures contract. Henry Hub “spot gas” represents natural
gas sales contracted for next day delivery and title transfer at the Henry Hub. The settlement
prices at the Henry Hub are used as benchmarks for the entire North American natural gas market.
Approximately 49 percent of U.S. wellhead production either occurs near the Henry Hub or passes
close to the Henry Hub as it moves to downstream consumption markets.
Background
Oklahoma's proved natural gas reserves are the 3rd-largest in the nation, after Texas and
Pennsylvania. The state has 8 percent of the nation's total proved reserves and contains all or part
of 14 of the 100 largest U.S. natural gas fields, as measured by proved reserves. Annual natural
gas production was at an all-time high of almost 3.2 trillion cubic feet in 2019.
Most natural gas in Oklahoma is consumed by the electricity generation and industrial sectors.
About half of Oklahoma households use natural gas as their primary energy source for home
heating. Nevertheless, only about one-seventh of Oklahoma’s natural gas output is consumed

September 2022                                                                             Page 20
within the state. The remaining supply is sent via pipeline to northern and eastern markets
through Kansas, Texas, and Arkansas.
Current Developments
The U.S. Energy Information Administration (EIA) expects higher-than-average natural gas prices
globally as demand remains high this winter in the United States, Europe, and Asia, and
inventories remain low. According to EIA’s September 2022 Short-Term Energy Outlook (STEO),
the U.S. natural gas spot price at the Henry Hub will continue to climb this winter, reaching a
monthly average of $9.10 per million British thermal units in January 2023. That price will be the
highest inflation-adjusted monthly average price since 2008. Natural gas futures prices in Europe
and Asia set records in August as pipeline exports from Russia to Europe reached their lowest
level in 40 years and U.S. liquefied natural gas (LNG) exports remained limited due to the outage
at the Freeport LNG facility. EIA also expects demand for natural gas to remain high despite high
prices for the commodity.
Oklahoma natural gas production declined in June. Statewide natural gas gross withdrawals were
at a preliminary level of 227,200 million cubic feet (MMcf) in June, down 6,215 MMcf (-2.7
percent) from the previous month’s downwardly revised level of 233,415 MMcf. Over the year,
statewide natural gas production was up 13,886 MMcf (6.5 percent) from the June 2021 level of
213,314 MMcf.
In August, the Henry Hub spot price averaged $8.80 per million British thermal units (MMBtu), up
from $7.28/MMBtu in July. Natural gas prices rose in August because of continued strong demand
for natural gas in the electric power sector.
According to Baker Hughes, for the week ending August 26, 2022, the national natural gas rig
count was at 158, a loss of 1 rig over the week but up 61 rigs over the year.
Oklahoma drillers reported 3 active natural gas-directed rigs for the week ending August 26, 2022,
down 1 rig over the month, according to Baker Hughes.

September 2022                                                                           Page 21
Definition & Importance
The U.S. Census Bureau and the Department of Housing and Urban Development jointly provide
monthly national and regional data on the number of new housing units authorized by building
permits; authorized, but not started; started; under construction; and completed. The data are
for new, privately-owned housing units (single and multifamily), excluding "HUD-code"
manufactured homes. Because permits precede construction, they are considered a leading
indicator for the residential construction industry and the overall economy. Most of the
construction begins the same month the permit is issued. The remainder usually begins
construction during the following three months; therefore, we also use a three-month moving
average.
While home construction represents a small portion of the housing market, it has an outsize
impact on the economy. Each home built creates an average of three jobs for a year and about
$130,000 in taxes, according to the National Association of Home Builders. Overall, homebuilding
fell to its lowest levels in 50 years in 2009, when builders began work on just 554,000 homes.
Current Developments
U.S. applications to build, a sign of future residential construction activity, fell again in July,
suggesting the housing market may be slowing, amid higher mortgage rates and prices for
construction materials. Privately‐owned housing units authorized by building permits in July were
at a seasonally adjusted annual rate of 1,674,000, 1.3 percent below the revised June rate of
1,696,000, but 1.1 percent above the July 2021 rate of 1,655,000, according to the U.S. Census
Bureau and the U.S. Department of Housing and Urban Development.
Permits for single-family homes fell 4.3 percent to a rate of 928,000 units in July. Building permits
for multi-family housing projects increased 2.5 percent to a rate of 693,000 units.
The National Association of Home Builders/Wells Fargo Housing Market Index (HMI) dropped to
49 in August, falling below the break-even level of 50 for the first time since May 2020.
September 2022                                                                              Page 22
Definition & Importance
The data services of the Federal Reserve Bank of St. Louis produce a seasonally adjusted series
including monthly state level data on the number of new housing units authorized by building
permits. These adjustments are made using the X-12 Procedure of SAS to remove the seasonal
component of the series so that non-seasonal trends can be analyzed. This procedure is based on
the U.S. Bureau of the Census X-12-ARIMA Seasonal Adjustment Program.
Current Developments
Statewide applications for new residential construction tumbled in July, to the lowest level in over
two years as multi-family permits plunged. Total residential permitting in July was at a seasonally
adjusted level of 898, down 673 (-42.8 percent) from the June level of 1,571, and down 317 (-26.1
percent) from the July 2021 level of 1,216 permits, according to figures from the U.S. Census
Bureau and the Federal Reserve Bank of St. Louis.
In July, permitting for single family homes was at a level of 732 units, down 164 (-18.3 percent),
from a level of 896 in June. Multi-family permitting was at a seasonally adjusted level of 166 in
July, down 509 (-75.4 percent), from the previous month’s level of 676 permits. Single-family
permitting accounted for 81.5 percent of total residential permitting activity in July while the
more volatile multi-family permitting accounted for 18.5 percent.
Statewide residential construction in 2021 rose to the highest level since 2006. Oklahoma total
residential permitting for 2021 was at a revised seasonally adjusted level of 15,202 permits. This
is 1,536 permits (11.2 percent) more than the 13,665 total permits issued during 2020.

September 2022                                                                             Page 23
Definition & Importance
Personal income is a broad measure of economic activity and one for which relatively current data
are available. Personal income includes earnings, property income such as dividends, interest, and
rent and transfer payments, such as retirement, unemployment insurance, and various other
benefit payments. It is a measure of income that is available for spending and is seen as an
indicator of the economic well-being of the residents of a state. Earnings and wages make up the
largest portion of personal income. The U.S. Department of Commerce, Bureau of Economic
Analysis (BEA) publishes monthly national and quarterly state personal income estimates used
here.
To show the vastly different levels of total personal income for the U.S. and Oklahoma on the
same chart, these data have been converted to index numbers. This chart shows a comparison of
Oklahoma and U.S. growth in real personal income with 1st quarter 2000 as the base year.
Current Developments
Americans’ incomes and spending rose more slowly in July, while inflation appears to be easing
from the recent historic highs. Personal income increased $47.0 billion (0.2 percent) in July,
according to estimates released by the Bureau of Economic Analysis (BEA). Disposable personal
income (DPI) increased $37.6 billion (0.2 percent) and personal consumption expenditures (PCE)
increased $23.7 billion (0.1 percent). The PCE price index decreased 0.1 percent. Excluding food
and energy, the PCE price index increased 0.1 percent. Real DPI increased 0.3 percent in July and
real PCE increased 0.2 percent; goods increased 0.2 percent and services increased 0.2 percent.
In July, spending on services such as housing and utilities, and transportation increased 0.3
percent over the month. Outlays for goods such as gasoline and other energy goods, and motor
vehicles declined 0.2 percent.
The personal savings rate—personal saving as a percentage of disposable personal income—was
5.0 percent in July, the same rate as in June.

September 2022                                                                           Page 24
Definition & Importance
Quarterly estimates of state personal income are seasonally adjusted at annual rates by the
Bureau of Economic Analysis (BEA). Quarterly personal income estimates are revised on a regular
schedule to reflect more complete information than the data that were available when the
estimates were initially prepared and to incorporate updated seasonal factors.
Current Developments
State personal income—a measure of nationwide income calculated as the sum of personal
income of all states and the District of Columbia— increased 4.8 percent at an annual rate in the
1st quarter of 2022 after increasing 3.6 percent in the 4th quarter of 2021, according to estimates
released today by the U.S. Bureau of Economic Analysis (BEA). The percent change in personal
income across all states ranged from 8.5 percent in South Dakota to 1.3 percent in Hawaii.
Oklahoma’s personal income increased at a 3.2 percent rate in the 1st quarter of 2021, to a level
of $214.7 billion, ranking the state 42nd among all states. For the 4th quarter of 2021, Oklahoma’s
personal income was revised upward to $213.0 billion (10.8 percent) from the previous estimate
of $211.3 billion (8.2 percent).
Earnings increased in 23 of the 24 industries for which BEA prepares quarterly estimates.
Professional, scientific, and technical services; construction; and administrative and support and
waste management and remediation services were the leading contributors to the overall growth
in earnings. The percent change in earnings across all states ranged from 13.5 percent in North
Dakota to 3.0 percent in Hawaii. In Oklahoma, earnings grew 6.9 percent in the 1st quarter of
2022.
In South Dakota, North Dakota, Iowa, and Idaho, the states with the largest increases in personal
income, an increase in farm earnings was the leading contributor to the increase in personal
income in the 1st quarter. In Oklahoma, farm earnings added 0.16 percentage point from total
earnings in the 1st quarter of 2022.

September 2022                                                                            Page 25
Definition & Importance
Retail sales measure the total receipts at stores that sell merchandise and related services to final
consumers. Sales are by retail and food services stores. Data are collected from the Monthly Retail
Trade Survey conducted by the U.S. Bureau of the Census. Essentially, retail sales cover the
durables and nondurables portions of consumer spending. Consumer spending accounts for
roughly two-thirds of the U.S. GDP and is therefore essential to Oklahoma’s economy. Retail sales
account for around one-half of consumer spending and economic recovery calls for consumption
growth.
Current Developments
U.S. retail spending was flat in July, as falling fuel prices held back gas station sales and consumers
took those savings and spent at other retailers. Advance estimates of U.S. retail and food services
sales for June 2022, adjusted for seasonal variation and holiday and trading-day differences, but
not for price changes, were $682.8 billion, virtually unchanged from the previous month, but 10.3
percent above July 2021, according to the U.S. Census Bureau. Total sales for the May 2022
through July 2022 period were up 9.2 percent from the same period a year ago. The May 2022 to
June 2022 percent change was revised from up 1.0 percent to up 0.8 percent.
Sales at auto dealerships fell sharply in July, declining 1.6 percent. Falling fuel prices following
record nominal highs pushed down sales at the pump, with gas station receipts down 1.8 percent.
Retail and food sales excluding gasoline and autos rose 0.7 percent from a month ago.
It appears that the pullbacks in gas and auto sales in July were offset by a 2.7 percent increase in
online sales and a 1.5 percent gain in miscellaneous stores. Sales at bars and restaurants struggled
in July, rising just 0.1 percent.
The less volatile “core” or retail-control group sales which are used to calculate gross domestic
product, and strips out automobiles, gasoline, building materials, and food services sales was flat
at 0.8 percent in July.

September 2022                                                                                Page 26
Definition & Importance
The Center for Economic and Management Research (CEMR) Price College of Business, at the
University of Oklahoma produces the Oklahoma Monthly Retail Sales Series containing monthly
estimates of retail sales for Oklahoma, the Oklahoma City, Tulsa, and Lawton Metropolitan
Statistical Areas and 48 selected cities in Oklahoma. The series is based on sales tax collection
data provided by the Business Tax Division, Oklahoma Tax Commission (OTC). In order to take out
monthly volatility, we have used a six-month moving average.
Current Developments
Statewide retail spending dipped in July, as Oklahomans spent less on gasoline due to falling pump
prices. Total adjusted retail trade in July was at a level of $4.64 billion, up 8.0 percent from the
previous month’s revised level of $4.43 billion. Over the year, total adjusted retail trade was
up 12.9 percent from the July 2021 level of $4.11 billion. Excluding estimated gasoline sales,
total retail sales for June increased 0.3 percent over the month.
In July, total durable goods sales increased 0.8 percent, as four of six durable goods categories
reported growing receipts over the month. Furniture (2.8 percent); lumber & hardware (1.0
percent); used merchandise (1.5 percent); and computer, electronics & music stores (0.5 percent)
reported gains over the month. Declining durable goods categories in June were auto accessories
& repair (-0.2 percent) and miscellaneous durable goods (-0.2 percent).
Non-durable goods expenditures plunged 9.0 percent in July, as lower pump prices sent estimated
gasoline sales plummeting 36.2 percent over the month. Other declining non-durable goods
categories in July were drug stores (-1.6 percent); liquor stores (-1.2 percent); and food stores
(-0.3 percent). Advancing non-durable goods categories in July were apparel (1.6 percent); eating
& drinking places (0.6 percent); and miscellaneous non-durable goods (0.1 percent). Receipts
at general merchandise stores were flat in July.

September 2022                                                                             Page 27
You can also read