Oil & Gas - IMAP october 2018 - imap.de
←
→
Page content transcription
If your browser does not render page correctly, please read the page content below
IMAP   october 2018

                      Oil & Gas
                      IMAP M&A Sector Report
OIL & GAS

        Oil and Gas Sector in Numbers

                12.1x                        13.7x                         60.5%                        68.1%
             Median                       Median                     Increase in oil                Cross-border
          transaction                  transaction                  prices since last            transactions with
        multiple EV/EBITDA           multiple EV/EBITDA                   year                    European target
                                                                                                      company

        Higher Industry              Alternative Energy            Oil Prices Up                 More Cross-Border
        Multiples                    Gains                                                       Deals

        • Relatively high            • Even higher transaction     • The average price per       • Europe is characterized
          transaction multiples in     multiples in the              barrel of Brent crude oil     by an international deal
          the oil and gas sector       alternative energy sector     increased from USD 46.4       climate, with 68.1% of
          from 2017 to 1H2018,         relative to the oil and       to USD 74.4, comparing        transactions from 2017
          most likely due to           gas sector from 2017 to       June 2017 with June           to 1H 2018 being cross-
          increasing oil prices        1H2018, reflecting the        2018.                         border.
          and improved financial       differences in market
          performance since the        outlook.
          downturn in 2014.

  2     IMAP
Executive summary   TELEMATICS

Table of contents
04   Market outlook and executive summary

05   Industry trends and developments

07   Supply and demand in the global oil market

08   Global M&A activity – transaction volume
     and value

11   Valuation summary

13   Oil and gas prices

15   Selected IMAP transactions

17   IMAP credentials

18   microgrid Disruptions

20   clean disruptions

22   Appendix

27   About IMAP

                                   IMAP
OIL & GAS

        Market Outlook and Executive Summary

                                                                           The oil and gas sector is still in the process of stabilizing
                                                                           since the downturn in 2014.

                                                                           M&A activity slowed down in terms of transaction volume
                                                                           and transaction value in 2H 2017 and 1H 2018, most
                                                                           likely due to an increase in geopolitical risk, a cautious
                                                                           attitude due to the recent downturn and firms focusing on
                                                                           improving earnings rather than engaging in M&A.

                                                                           Valuation multiples of recent transactions since January
                                                                           2017 are relatively high in the oil and gas sector and even
                                                                           higher in the alternative energy sector.

                                                                           Oil prices have been increasing rapidly over the last year
                                                                           and pressured by the U.S. and other non-OPEC countries,
                                                                           OPEC decided to increase production in June 2018 in order
                                                                           to contain oil prices.

                                                                           Geopolitical risks have increased, with more conflicts in
                                                                           the Middle-East , as well as global trade tensions between
                                                                           major economic powers causing more uncertainty in the
                                                                           market. For example, political issues in Venezuela and
                                                                           Libya have substantially lowered production.

                                                                           With oil demand continuing to grow rapidly and
                                                                           investments being deferred during the oil price crash of
                                                                           2014, the industry could struggle with a supply crunch in
                                                                           the near future, a projection shared by the CEOs of Total,
                                                                           Eni and Saudi Aramco.

                                                                           Coal demand is expected to peak around 2028, while
                                                                           oil demand is expected to peak in 2037. Gas demand
                                                                           continues to grow modestly.

                                                                           Global M&A in the oil and gas sector is expected to
                                                                           increase in 1H 2018 as financial performance is improving,
                                                                           oil prices have increased and companies are increasingly
                                                                           changing their portfolio of assets.

                                                                           Technological disruptions such as electric vehicles,
                                                                           autonomous vehicles, ride-hailing, storage technology
                                                                           and solar PV technology are changing the energy and
                                                                           transportation sector dramatically.

        Source: McKinsey & Company, Deloitte U.S. Oil and Gas Outlook
        2018, Bloomberg, PWC Oil and Gas Trends 2018-2019, EY Oil & Gas,
        New York Times, U.S. Energy Information Administration (EIA)

  4     IMAP
OIL & GAS

Industry Trends and Developments

Oil prices                                   Global energy demand                            U.S. shale producers

  Oil prices have increased from USD            Global energy demand growth is                U.S. shale oil producers achieved
  46.4 to USD 74.4 (a 60.5% increase)           expected to decelerate, taking into           significant cost reductions, forced by
  per barrel of Brent crude oil, when           account:                                      the market downturn in 2014.
  comparing the average price in June           • Africa, India, China and other
  2017 with June 2018.                            developing countries in Asia drive          It appears that these cost reductions
                                                  global energy demand growth, due            are more permanent than previously
  Main factors contributing to the rapid          mainly to population growth and             expected, with break-even costs
  increase in oil prices:                         economic expansion.                         across major U.S. shale oil players
  • Production cuts from OPEC which             • Aging workforce will cause a                30% to 50% lower than early 2015.
    began at the end of 2016.                     downward pressure on economic
  • Geopolitical issues, for example,             growth.                                     U.S. shale natural gas producers
    Venezuela and Libya have lowered            • Falling energy intensity due to             have structurally lowered costs as
    production significantly.                     higher end-use efficiency.                  well.
  • Global oil demand is still
    increasing, albeit at a decreasing          Electricity demand is expected to             U.S. shale oil and gas production and
    rate.                                       grow 4 times faster than all other            exports have strongly increased ,
                                                energy sources up to 2050, due                with this expected to continue.
  Under pressure by the U.S. and                mainly to the increase in electric
  other non-OPEC countries, OPEC                vehicles, growing economies in
  announced an increase in its                  Asia and Africa and technological
  production as of June 2018 in order           changes.
  to manage the fast increase in oil
  prices.                                       The long-term energy demand will be
                                                the most diversified energy mix ever,
                                                including: oil, gas, coal, nuclear, hydro
                                                and renewable energy.

Risks and uncertainties in the oil and gas sector

     Energy             Supply             Market
                                                          Technology         Workforce        Digitalization   Renewables
    demand              shocks             prices

Source: McKinsey & Company, PWC Oil and Gas Trends 2018-2019, BP Energy Outlook 2018, U.S.
Energy Information Administration (EIA)

                                                                                                                            IMAP        5
OIL & GAS

        Industry Trends and Developments

                                                Scarcity of                      Deepwater                        Rise of
        Digitalization                          young talent                     exploration                      renewables

            Advanced analytics, machine          Due to the downturn               Deepwater exploration           2016 was the first
            learning, drones and virtual         in 2014, the sector               has lower production            year in which net
            simulation can significantly         experienced a large               costs than onshore shale        annual capacity
            increase production, lower           reduction in workforce of         resources and will remain       additions of solar and
            unit costs and increase safety,      approximately 400,000             an essential source of          wind exceeded gas
            among other benefits. For            experienced and valuable          global oil supply.              and coal.
            example:                             employees.
            • Real-time monitoring                                                 The Gulf of Mexico (GOM)        It is expected that
              and data will improve              Millennials are entering          is one of the largest           new-build solar and
              maintenance regimes,               sectors other than the oil        deepwater oil sources           wind farms will be
              as well as help detect             and gas sector.                   ever discovered, although       more economical
              underperformance of wells                                            success rates are               than gas and coal in
              and anomalies during               Nonetheless, this group           significantly lower relative    almost all countries
              drilling.                          is projected to comprise          to other deepwater              as of 2020.
            • Extensive data on efficiency       roughly 75% of the labor          exploration wells.
              and emissions allows better        force in 2025, as older                                           Solar and wind will
              monitoring of health, safety,      workers retire, creating a        The GOM has proven              contribute over 80%
              security and environment           ‘brain drain’.                    to be a resourceful             of new capacity,
              (HSSE) performance and                                               deepwater location              with China and India
              compliance.                        The sector as a whole             and will become more            contributing more
            • Data-driven monitoring of          is forced to create a             important in the future,        than half.
              condition status allows            more attractive working           though technological
              better prediction and              environment in order to           developments will be
              mitigation of equipment            attract and retain new            critical in order to make it
              failure.                           talent.                           more viable.

            The traditional oil and gas
            industry is changing rapidly
            due to digitalization, and the
            U.S., with the Permian basin
            in particular, are at the cutting
            edge of digitalization.

            The adoption of digitalization
            across the globe will be
            crucial and determine the
            future industry players.

        Source: McKinsey & Company, PWC Oil and Gas Trends 2018-2019, BP Energy Outlook 2018,
        U.S. Energy Informant Administration (EIA)

  6     IMAP
OIL & GAS

Supply and Demand in the Global Oil Market

Supply                                                                Demand

   Under pressure by the U.S. and other non-OPEC countries               Global energy demand is expected to increase (at a
   and after a long period of production cuts, OPEC decided              decreasing rate), thereby increasing oil demand.
   to increase global oil supply again as of June 2018.
                                                                         The (petro)chemical industry and the transport sector
   U.S. shale oil production and export strongly increased               contribute the most in oil demand.
   over the last years and this is expected to continue.
                                                                         Long-term oil demand will decrease due to electrification
   Geopolitical issues in Venezuela and Libya have lowered               and efficiency improvements.
   production substantially. Further geopolitical risks in the
   Middle-East and global trade wars could further lower the             According to the base case scenario in McKinsey’s Global
   global oil supply.                                                    Energy Perspective, global oil demand is expected to peak
                                                                         in 2037.
   As of 2017, the volume of new oil and gas discoveries
   was at its lowest point since the 1950s and it is getting
   more and more difficult to find large discoveries.

Source: McKinsey & Company, Deloitte U.S. Oil and Gas Outlook 2018, PWC Oil and Gas
Trends 2018-2019, New York Times, U.S. Energy Informant Administration (EIA)

                                                                                                                              IMAP        7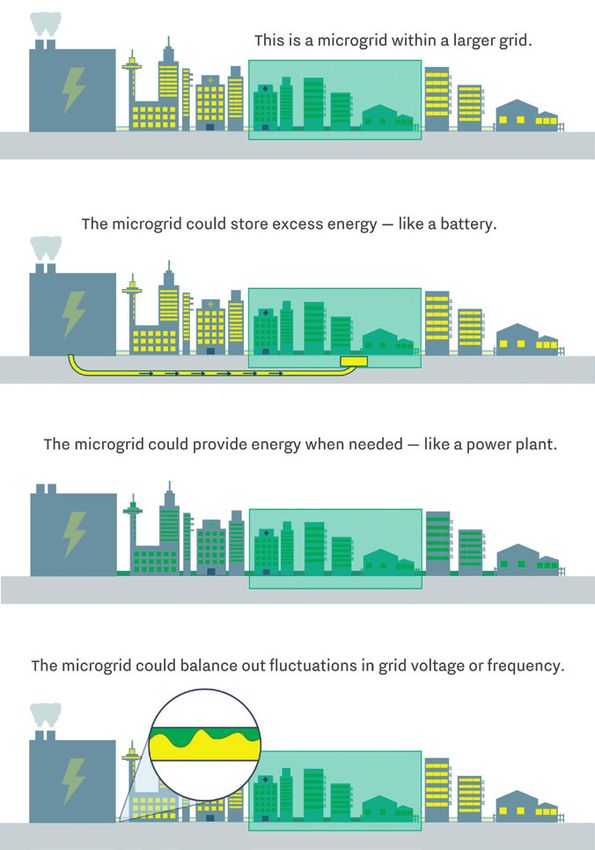
OIL & GAS

        Global M&A Activity - Transaction Volume
        Transaction volume

        Source: Zephyr, KPMG M&A Predictor 2018

        Number of global transactions by world region of target company from January 2010 to June 2018. Includes
        transactions with a transaction value higher than EUR 25 Million and with the status ‘completed-confirmed’. The world
        region ‘Other’ contains transactions for the most part, with target companies based in Canada and Australia.

             Global transaction volume peaked in 2014 with 740          While oil prices are recovering since the oil price
             deals, followed by a sharp decrease in the following       crash in 2014, transaction volume remains low, as
             years.                                                     shown below.

             Transaction volume has been declining since 2017,
             with 182 transactions in the first half of 2018, most
             likely due to:
             • Geopolitical tensions causing uncertainty in the
                market.
             • The sector is still in the process of stabilizing,
                focusing on earnings growth rather than M&A.

             The reduction in M&A activity in 2018 is in line with
             a 10% reduction in M&A appetite in the oil and gas
             sector, as outlined by the KPMG 2018 M&A Predictor.

  8     IMAP
OIL & GAS

Global M&A Activity – Transaction Value
Transaction value (EUR Billions)

Source: Zephyr

Global transaction value by world region of the target company over January 2010 to June 2018. Includes transactions with
a transaction value higher than EUR 25 Million and with the status ‘completed-confirmed’. Reported in Billions of EUR (€).
We follow Zephyr’s definition of ‘deal value’ as: “This will be the consideration paid for the actual stake acquired.” The world
region ‘Other’ contains transactions for the most part ,with target companies based in Canada and Australia. Note that
yearly transaction value is sensitive for large deals, hence the results should be interpreted carefully.

      Transaction value peaked in both 2014, with EUR 344            In addition, the number of extremely large deals in 2H
      billion and in 2017, with EUR 356 billion.                     2017 and 1H 2018 remained low.

      Transaction value was extremely high in 1H 2017                The U.S. is the most active M&A region, in terms of
      compared with 2H 2017; 57% of the total transaction            both transaction volume and transaction value.
      volume in 1H 2017 accounted for 73% of the total
      transaction value.                                             M&A activity in South America has been decreasing
                                                                     since 2010, in terms of transaction volume and
      Transaction value significantly dropped after the first        transaction value.
      half of 2017, with the second half of 2017 reaching
      EUR 98 billion and the first half of 2018 amounting to
      EUR 87 billion.

                                                                                                                           IMAP         9
OIL & GAS

        Europe and U.S. M&A Activity
        Domestic and cross-border transactions

        Number of domestic and cross-border transactions per country for Europe and the U.S. with a minimum deal value of
        EUR 25 Million between January 2017 and June 2018.

              Cross-border transaction
              Domestic transaction
                                                                                                        Source: Zephyr

            The map shows 141            Europe is characterized by    Cross-border transactions      Financial investors were
            transactions in Europe       an international climate,     play a smaller role in         involved in 32.6% of the
            and 224 transactions in      with 68.1% of transactions    the U.S., with 44.6% of        transactions in Europe
            the U.S., categorized by     being cross-border.           transactions involving a       between the start of 2017
            domestic and cross-border                                  foreign buyer.                 and 1H 2018, whereas this
            transactions.                                                                             was the case for 24.1% of
                                                                                                      the transactions in the U.S.

  10 IMAP
OIL & GAS
Valuation Summary – Oil and Gas
EV/Revenue multiples (x)
EV/Revenue multiples for listed peer firms and worldwide transactions with known multiples from January 2017 to 31st July
2018. MergerMarket sector classification ‘oil and gas exploration and production’: “Companies that engage in the exploration
and production of oil and gas.”
Q1: 0.7 Q3: 1.6
Listed peer
firms Min: 0.4 Med: 0.9 Max: 3.6
Q1: 2.5 Q3: 7.5
Transactions Min: 0.3 Med: 4.7 Max: 11.4
0.0x 2.0x 4.0x 6.0x 8.0x 10.0x 12.0x 14.0x
EV/EBITDA multiples (x)
EV/EBITDA multiples for listed peer firms and worldwide transactions with known multiples from January 2017 to 31st July
2018. MergerMarket sector classification ‘oil and gas exploration and production’: “Companies that engage in the exploration
and production of oil and gas.”
Q1: 5.1 Q3: 9.4
Listed peer
firms Min: 3.4 Med: 6.9 Max: 33.8
Q1: 5.1 Q3: 17.8
Transactions Min: 2.6 Med: 12.1 Max: 27.8
0.0x 5.0x 10.0x 15.0x 20.0x 25.0x 30.0x 35.0x 40.0x
Source: MergerMarket, Orbis
A comparable company and transaction analysis Average EV/Revenue multiples for listed peer firms
shows relatively high EV/Revenue and EV/EBITDA and transactions are 1.3x and 5.3x, respectively.
multiples in the oil and gas sector.
Average EV/EBITDA multiple for listed peer
Valuation multiples have improved since last year’s firms is 8.8x, whereas this is 12.0x for worldwide
report by IMAP, most likely due to recovering oil transactions.
prices, an improved market outlook and improved
financial performance since the downturn in 2014. Please see the Appendix for a detailed overview of
included transactions and listed firms.
While transaction volume and transaction value are
both down, valuation multiples are relatively high, with
the median EV/Revenue and EV/EBITDA multiple of
4.7x and 12.1x, respectively.
IMAP 11OIL & GAS
Valuation Summary – Alternative Energy
EV/Revenue multiples (x)
EV/Revenue multiples for listed peer firms and worldwide transactions with known multiples from January 2017 to 31st
July 2018. MergerMarket sector classification ‘alternative energy’: “Companies that produce energy from sources other than
traditional fossil fuels. Examples include solar, wind, hydro and nuclear energy.”
Q1: 4.2 Q3: 8.8
Transactions Min: 0.5 Med: 5.9 Max: 22.6
0.0x 5.0x 10.0x 15.0x 20.0x 25.0x
EV/EBITDA multiples (x)
EV/EBITDA multiples for listed peer firms and worldwide transactions with known multiples from January 2017 to 31st July
2018. MergerMarket sector classification ‘alternative energy’: “Companies that produce energy from sources other than
traditional fossil fuels. Examples include solar, wind, hydro and nuclear energy.”
Q1: 8.7 Q3: 16.3
Transactions Min: 4.7 Med: 13.7 Max: 49.1
0.0x 10.0x 20.0x 30.0x 40.0x 50.0x 60.0x
Source: MergerMarket, Orbis
The comparable transaction analysis shows Average EV/Revenue and EV/EBITDA multiples for
even higher EV/Revenue (5.9x) and EV/EBITDA worldwide transactions in the alternative energy sector
(13.7x) multiples in the alternative energy sector, in are 6.7x and 16.0x, respectively.
comparison to the oil and gas sector.
Please see the Appendix for a detailed overview of
Higher transaction multiples show that, on average, included transactions and listed firms.
acquirers are willing to pay more for target companies
in the alternative energy sector compared to the oil
and gas sector.
High valuation multiples in the alternative energy
sector reflect the high level of technology, excellent
market outlook and growth potential of the sector.
12 IMAPOIL & GAS
Oil Price
Brent crude oil – historical spot price
Oil prices are up by 60.5% when comparing the average Additionally, McKinsey Energy Insights’ base case scenario
price per barrel of Brent crude oil in June 2017; USD 46.4, forecasts Brent crude oil around USD 55 per barrel at the
to June 2018; USD 74.4. end of 2018, while other industry experts even lower oil
prices at the end of 2018.
At the time of publication, oil prices are slightly above USD
70 per barrel. The U.S. Energy Informant Agency is expecting that U.S.
crude oil output will rise to 11 Million barrels per day at the
Several major oil and gas companies have indicated that oil end of 2018, surpassing Russia at 10.95 Million, making it
prices are likely to decline during the second half of 2018. the largest producer in the world.
Due to electrification and improved efficiency, oil demand
is expected to peak around 2037.
Historical spot price per barrel of Brent crude oil from January 2010 to 13th August 2018,
based on daily historical prices. Reported in USD ($).
140
120
100
80
60
40
20
0
Jan-10
Apr-10
Jul-10
Oct-10
Jan-11
Apr-11
Jul-11
Oct-11
Jan-12
Apr-12
Jul-12
Oct-12
Jan-13
Apr-13
Jul-13
Oct-13
Jan-14
Apr-14
Jul-14
Oct-14
Jan-15
Apr-15
Jul-15
Oct-15
Jan-16
Apr-16
Jul-16
Oct-16
Jan-17
Apr-17
Jul-17
Oct-17
Jan-18
Apr-18
Jul-18
Source: U.S. Energy Information Administration (EIA), McKinsey & Company, BP Energy Outlook 2018
IMAP 13OIL & GAS
Gas Price
Henry Hub natural gas – historical spot price
Fluctuations in gas prices have less impact on the oil and While gas demand gradually decreases in the building and
gas industry than fluctuations in oil prices. transport sector, gas demand increases in the industry and
power sectors.
Natural gas prices are affected by short-term supply and
demand shocks, such as pipelines or gas fields shutting In addition, China’s policy to stimulate the use of gas in
down and an increase in demand during the winter, usually industry and power will significantly influence expected
peaking during the winter months. gas demand.
Gas demand is expected to grow strongly through to 2050,
due for the main, to the expansion of LNG and the role of
gas as a transition fuel.
Historical spot price per million Btu of Henry Hub natural gas from January 2010 to 13th August 2018,
based on daily historical prices. Reported in USD ($).
8
7
6
5
4
3
2
1
0
Jan-10
Apr-10
Jul-10
Oct-10
Jan-11
Apr-11
Jul-11
Oct-11
Jan-12
Apr-12
Jul-12
Oct-12
Jan-13
Apr-13
Jul-13
Oct-13
Jan-14
Apr-14
Jul-14
Oct-14
Jan-15
Apr-15
Jul-15
Oct-15
Jan-16
Apr-16
Jul-16
Oct-16
Jan-17
Apr-17
Jul-17
Oct-17
Jan-18
Apr-18
Jul-18
Source: U.S. Energy Informant Administration (EIA), McKinsey & Company, BP Energy Outlook 2018
14 IMAPOIL & GAS
Selected IMAP Transactions
Royal Dutch Shell – GI Energy
Royal Dutch Shell’s affiliate, Shell New Energies, made a IMAP’s Global Energy Group collaborated on evaluating the
strategic investment in GI Energy and acquired a majority deal and identifying potential buyers, providing IMAP FRG
interest. with global intelligence on renewable energy market trends,
recent M&A activity, relationships with active acquirers and
IMAP Falls River Group (FRG) acted as exclusive financial insights on approach to valuation.
advisor to GI Energy, a leading provider of on-site energy
solutions in North America. IMAP FRG generated tremendous global interest in the
opportunity, with over 30 potential partners signing
It is Shell’s 6th investment in distributed energy resources confidentiality agreements. Multiple indications of interest
since the beginning of 2017. were received and IMAP FRG closed the transaction within
six months.
Shell’s New Energies business was created in 2016 to
explore commercial models supporting the world’s energy
transition.
GI Energy’s relationship with Shell means the company can
combine its development strengths with Shell’s appetite for
long-term asset ownership, their balance sheet and ability energy & utilities
to solve commodity pricing challenges.
With advancements in technology and cost improvements,
the distributed energy model (microgrids*) will be
increasingly embraced in the US and globally. The GI
Energy deal validated this trend, seeing strong and wide
interest from multi-billion-dollar infrastructure funds
and technology/internet companies, to equipment
manufacturers and utilities.
Source: MergerMarket, Neptune Energy website and Total SA website.
* Microgrids are small networks of electricity users with a local source of supply that
is usually attached to a centralized national grid, but able to function independently.
Tom Chadwick, CEO, GI Energy:
“IMAP FRG ran a very efficient and seamless process which
ultimately produced a strategic partner that was an ideal fit
for our vision. Of note was the speed in getting the job done,
unbelievably fast.”
IMAP 15OIL & GAS
Selected IMAP Transactions
Value Enhancement Partners – InterDam
Private equity firm Value Enhancement Partners (VEP) IMAP Netherlands collaborated with IMAP’s Global Energy
acquired a majority stake in InterDam Holding B.V. as of Group to gauge interest with foreign potential buyers.
December 2017.
IMAP Netherlands received interest from both strategic-
IMAP Netherlands acted as advisor to InterDam during this and financial buyers, distributed multiple Information
transaction. Memoranda and received several non-binding offers.
InterDam is engaged in the design, manufacturing and Private equity firm VEP is a long-term operational and
supply of blast and fire protection solutions, including strategic partner, active mainly in the manufacturing and
doors, walls and windows. trade sector, making it an excellent partner for InterDam.
The company is active in both on- and offshore, serving
mainly refineries, oil and gas platforms and offshore wind
substations. energy & utilities
It holds a leading position worldwide, with certified and
unique products.
InterDam has an outstanding client portfolio, with
renowned players in the energy market who are engaged in
multi-billion projects.
InterDam reached a revenue of approximately EUR 45
Million and employed in the region of 45 people in 2016.
16 IMAPOIL & GAS
Credentials from Across IMAP
energy & utilities energy & utilities energy & utilities energy & utilities
energy & utilities energy & utilities energy & utilities energy & utilities
energy & utilities energy & utilities
IMAP 17OIL & GAS
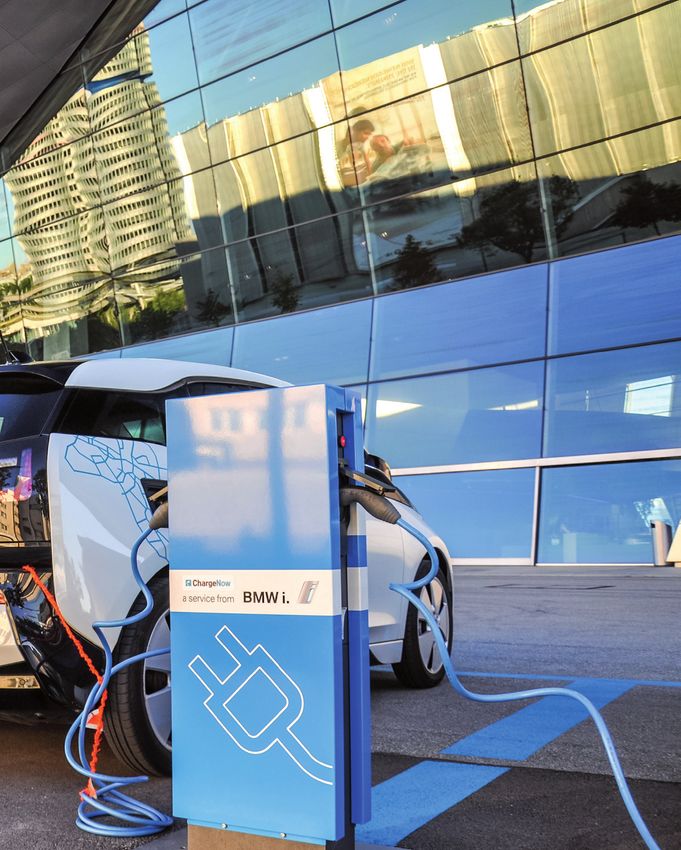
Microgrids – a top contender in the race to
provide a solution to rising disruption in the
evolving global power market
We are currently seeing disruption it is not surprising that more and Calls for a greener,
across the entire energy sector. With more large players are taking a more resilient and
traditional electricity generation serious look at alternatives such as reliable source of power
giving way to sustainable and cost- microgrids, which have the potential supply
effective alternatives, renewables to dramatically transform the way in
and storage look to be where future which we both produce and consume So what is the big deal with microgrids?
growth opportunities lie. Therefore, energy. The concept of course, is not a new
one. Indeed, before they were joined
into regional and national grids, the
earliest electricity networks were
essentially microgrids. Both consist
of power generation, distribution and
controls. However, there are many
key factors that set microgrids apart,
the first being reliability. Local energy
grids, known as microgrids, are small
scale, self-sustaining power networks.
Therefore, they have the capacity to
work in parallel with and independently
from the national grid. When needed,
microgrids can disconnect from the
grid and function autonomously. By
means of isolating their generation
nodes and power loads from
disturbance, they can operate without
affecting the integrity of larger grids.
In addition, during peak usage, storms
and power outages or in case of a grid
failure, they also have the capability to
feed power back to the grid. In today’s
modern world, providing high-quality
power to facilities such as hospitals
or data centers is crucial, where even
the briefest outage can be highly
detrimental.
Perhaps more importantly though, is
the fact that unlike traditional grids,
microgrids can be powered by and
integrate with, renewable energy
sources. Though they can be run by
traditional means including generators
and batteries, the focus is now on
finding and integrating greener,
sustainable energy sources, such as
wind and solar power, geothermal,
waste-to-energy, small hydro and
Source: www.vox.com/energy-and-environment combined heat and power (CHP).
18 IMAPOIL & GAS
Microgrids have the benefit of being investments in environmentally sound As more large players embrace the
able to make use of local resources solutions for the future. Indeed, it new trends and begin to reinvent
that are perhaps too small or unreliable appears that many utility giants have themselves, we could see an
for traditional grids. In addition, by been on a grid edge shopping spree increase in large acquisitions in the
closely linking power generation and recently, with significant investments near future. By investing out with
power use, microgrids can be more related to energy storage. their core business, companies can
efficient. look to de-risk their business model
Shell’s investment in microgrids and and in some cases, compensate
distributed energy in their recent for declining revenue streams.
Acquiring competencies acquisition of a majority stake in Recent M&A activity indicates that
as opposed to growing GI Energy, which IMAP Falls River rather than growing organically,
organically Group (FRG) recently advised on, companies are proactively buying
validates this trend. The oil major into companies and markets.
With advancements in technology made the acquisition through Shell
and cost improvements, it is likely New Energies, a business it launched
that microgrids will be increasingly in 2016 to explore commercial models
embraced across the globe as utility that support the world’s energy
companies look to make targeted transition.
2017 Grid Edge Investment by European Giants
2018 Grid Edge Investment by European Giants
Source: GTM Research Grid Edge Data Hub.
Image Credit: GreenTech Media
IMAP 19OIL & GAS
Clean Disruptions in Energy & Transportation
S-curve adoptions could be happening quicker than we think
Clean disruptions
Historically, technological disruptions follow an S-curve TaaS-model (transport as a service) with ride-hailing will
and the technology is adapted exponentially at the first half decrease the total fleet significantly and increase vehicle
of the S-curve. utilization rate, leading to more efficiency.
S-curves are getting steeper and technological To illustrate, some islands have already switched from
developments are adapted even faster than before, driving diesel-generation to being 100% solar-powered since solar-
cost curves of new technologies down rapidly. generation (and storage) is already more economical than
diesel-generation.
Tony Seba considers five main ‘clean disruptions’ that
could rapidly change the energy and transportation Self-driving taxis are already available in Singapore.
sectors:
• Batteries (technology) While McKinsey projects oil demand to peak in 2037, Tony
• Electric vehicles (technology) Seba predicts the peak in oil demand in 2020 and a long
• Autonomous vehicles (technology) term equilibrium price at USD 25 per barrel.
• Ride-hailing (business model)
• Solar (technology)
20 IMAPOIL & GAS
The solar PV (photovoltaic) cost curve has been well as households to switch to self generation with the
decreasing by approximately 11.5% per year, while the distributed energy model. This development threatens
solar PV installed capacity has grown at a CAGR of the centralized power generation system and thus energy
approximately 40% from 2000 to 2016. generation using natural gas, coal and nuclear.
According to PWC, 69% of corporations are actively Technological disruptions are in progress, and the speed of
pursuing solar PV purchases for energy generation since it adoption will determine developments in the near future.
is more economical.
The cost of unsubsidized solar PV generation on rooftops
will drop below the cost of transmission in the upcoming Source: Tony Seba (Stanford University) speech in Boulder, Colorado,
awarded the 2017 Sunshine award by Clean Energy Action, filmed by
years, making it highly attractive for corporations as Colorado Renewable Energy Society.
IMAP 21OIL & GAS
Appendix 1/5
Transactions: Oil and gas
Acquired EBITDA
EV Revenue EV/ EV/
Date Target Acquiror stake margin
(EUR M) (EUR M) Revenue EBITDA
(%) (%)
Aug/18 AAG Energy Holdings Limited Xinjiang Xintai Natural Gas Co., 51% 375 69 79.9% 5.4x 6.8x
A HKEX listed company Ltd.
active in the exploration and Chinese company engaged in
development of coalbed selling of natural, liquified pe-
methane in China troleum, and gases throughout
China
Jul/18 RSP Permian Inc. Concho Resources Inc. 100% 7,666 670 63.8% 11.4x 17.9x
Acquisition, exploration, Acquisition, development and
development and production exploration of oil and natural
of unconventional oil and gas gas properties
reserves
Jul/18 EQT Corporation’s Appalachian Diversified Gas & Oil Plc 100% 494 211 64.6% 2.3x 3.6x
Basin Assets Listed UK-based company,
Listed US integrated energy engaged in the production of
company, involved in natural natural gas and crude oil
gas supply, transmission and
distribution
May/18 Spartan Energy Corp. Vermillion Energy Inc. 100% 850 284 38.7% 3.0x 7.7x
Engaged in the business Listed Canadian energy
of oil and gas exploration, company
development, acquistion and
production
May/18 Naturgy CVC Capital Partners Limited 20% 36,515 5,053 31.4% 7.2x 23.0x
Supply, commercialization and UK-based private equity firm
distribution of natural gas and
electricity
Mar/18 Maersk Olie Og Gas A/S Total S.A. 100% 6,325 4,478 55.1% 1.4x 2.6x
Oil and gas exploration Integrated oil and gas company
company
Feb/18 MPLX LP Marathon Petroleum 40% 27,783 2,458 40.7% 11.3x 27.8x
Owns, operates and develops Corporation
crude oil, refined product, and Oil refinery and petroleum
other midstream assets products retailing business
Jan/18 Hindustan Petroleum Oil and Natural Gas Corporation 51% 9,942 31,196 6.8% 0.3x 4.7x
Corporation Ltd Limited
Indian oil refining and marketing Indian company engaged in
company oil exploration and production
activities
Jan/18 Songa Offshore ASA Transocean Ltd 100% 2,745 715 59.8% 3.8x 6.4x
Engineering expertise and Provider of offshore contract
technical solutions provider drilling services for oil and gas
to the offshore oil and gas wells
industries
Nov/17 Rice Energy, Inc EQT Corporation 100% 6,875 739 39.2% 9.3x 23.7x
Gas exploration and production Integrated energy company
company involved in natural gas supply,
transmission and distribution
Oct/17 Phillips 66 Partners LP First Reserve & Tortoise C.A. 5% 6,531 690 76.8% 9.5x 12.3x
Ownership, operation, LLC & Stonepeak I.P.
development of fee-based Private equity firms agreed to
crude oil, refined petroleum acquire a 5.4% stake via private
product, and more placement
Source: Mergermarket
22 IMAPOIL & GAS
Appendix 2/5
Transactions: Oil and gas
Acquired EBITDA
EV Revenue EV/ EV/
Date Target Acquiror stake margin
(EUR M) (EUR M) Revenue EBITDA
(%) (%)
Sep/17 Teekay Offshore Partners L.P. Brookfield Business Partners 60% 3,321 1,094 49.9% 3.0x 6.1x
Providing marine transportation, L.P.
oil production, storage, Canadian investment company
long-distance towing and other
services
Sep/17 Trilogy Energy Corp. Paramount Resources Ltd. 85% 726 129 34.3% 5.6x 16.4x
Exploration and production of Exploration and production of
oil and gas oil and gas
Aug/17 Petrolera El Trebol SA Phoenix Global Resources Plc. 100% 728 123 36.0% 5.9x 16.5x
Oil and gas exploration services Investment company focused
on the oil and gas sector
Jun/17 ONEOK Partners L.P. ONEOK Inc. 60% 21,635 8,465 19.1% 2.6x 13.4x
Production of oil and gas as Oil and gas production, natural
well as processing, gathering, gas processing, gathering,
storage and transmission of storage and transmission
natural gas
May/17 Sterling Resources (UK) Ltd. Oranje-Nassau Energie B.V. 100% 108 45 46.1% 2.4x 5.2x
Exploration, development and Exploration and production of
production of crude oil and oil and gas
natural gas
Apr/17 Clayton Williams Energy Inc. Noble Energy Inc. 100% 3,056 275 58.0% 11.1x 19.2x
Exploration and production of Exploration, production,
oil and natural gas acquisition and marketing of oil
and gas
Apr/17 International Petroleum Lundin Petroleum AB 100% 486 194 59.7% 2.5x 4.2x
Corporation (Spin-off) (shareholders)
Canadian oil and gas Swedish oil and gas exploration
exploration company company
Feb/17 Spectra Energy Corp Enbridge Inc 100% 37,069 4,791 42.2% 7.7x 18.3x
Engaged in gas transmission, Energy transportation and
storage, gathering, processing distribution of crude oil and
and distribution liquids pipeline system
Feb/17 Columbia Pipeline Partners LP Columbia Pipeline Group Inc. 53% 3,140 1,219 51.5% 2.6x 5.0x
Operates and develops a Operator, developer and owner
portfolio of pipelines, storage of a portfolio of pipelines,
and related midstream assets storage and related midstream
assets
Jan/17 Maurel et Prom SCA Pertamina (Persero), PT 100% 1,298 276 38.8% 4.7x 12.1x
French petroleum and gas Exploration and production of
company oil, gas and geothermal energy
Jan/17 Williams Partners L.P. Williams Companies Inc. 32% 50,813 7,110 40.3% 7.1x 17.7x
Infrastructure company pro- Energy infrastructure company
viding midstream natural gas
services
Jan/17 Rosneft Oil Company OAO Consortium led by Qatar 20% 77,241 63,783 24.6% 1.2x 4.9x
Oil and gas exploration Investment Authority
company Comprised of Qatar Investment
Authority and Glencore
Source: Mergermarket
IMAP 23OIL & GAS
Appendix 3/5
Transactions: Alternative energy
Acquired EBITDA
EV Revenue EV/ EV/
Date Target Acquiror stake margin
(EUR M) (EUR M) Revenue EBITDA
(%) (%)
Jun/18 8pint3 Energy Partners LP Capital Dynamics AG 100% 1,331 59 74.6% 22.6x 30.3x
Owns, operates and acquires Assets management firm that
solar energy generation projects invests in PE funds and clean
energy infrastructure
May/18 Acciona Termosolar Group ContourGlobal L.P. 100% 962 147 74.8% 6.5x 8.7x
Owns concentrated solar Power Develops, acquirers and opera-
generation plants in Spain tes electric power and district
heating business
Mar/18 Infrastructure & Energy M III Acquisition Corp. 100% 297 582 10.8% 0.5x 4.7x
Alternatives LLC US blank check company
Engineering, procurement and formed to make acquisitions by
construction company in the M-III Partners
renewable energy sector
Feb/18 Alterra Power Corp. Innergex Renewable Energy Inc 100% 548 58 60.8% 9.5x 15.6x
Operating, developing, exploring Operator of renewable power
and acquiring geothermal ener- generating facilities
gy project
Dec/17 TerraForm Global Inc. Brookfield Asset Management 100% 1,171 203 39.0% 5.8x 14.8x
Company that owns and opera- Inc.
tes clean energy projects Canadian asset management
company
Dec/17 ErgyCapital S.p.A. Intek Group S.p.A. 51% 61 14 49.9% 4.3x 8.6x
Italian investment firm focused Italian diversified holding
on the renewable energy sector company
Oct/17 Frendy Energy SpA Edison S.p.A. 100% 18 1 24.8% 12.2x 49.1x
Operator of hydroelectric power Power generation company en-
plants gaged in exploration, production
and sale of hydrocarbons
Oct/17 TerraForm Power Inc. Brookfield Asset Management 39% 5,368 621 50.8% 8.6x 17.0x
Owner and operator of clean Inc.
power generation assets Canadian asset management
company
Sep/17 BIOX Corporation FP Resources Limited & CFFI 65% 55 78 1.8% 0.7x 39.6x
Company that designs, builds, Ventures Inc.
owns and operates biodiesel Canadian investment holding
production facilities companies
Sep/17 Energy Development Consortium for Energy 48% 3,124 655 60.6% 4.8x 7.9x
Corporation Development Corp.
Phillipines company engaged in Formed by Macquarie
the exploration, development Infrastructure and Real Assets
and operation of geothermal and GIC Pte Ltd
energy
Source: Mergermarket
24 IMAPOIL & GAS
Appendix 4/5
Transactions: Alternative energy
Acquired EBITDA
EV Revenue EV/ EV/
Date Target Acquiror stake margin
(EUR M) (EUR M) Revenue EBITDA
(%) (%)
Aug/17 EDP Renovaveis S.A. Energias de Portugal S.A. 5% 8,688 1,453 80.6% 6.0x 7.4x
Renewable energy company Company engaged in the
distribution and generation of
electricity
Jul/17 Magacela Solar 1, S.A.U. Solaria Energia y Medio 100% 62 7 84.2% 9.4x 11.2x
Engaged in generation, Ambiente S.A.
transmission and distribution of Engaged in renewable energy
solar electric energy sector, with activities in solar
energy.
Jul/17 Ormat Technologies Inc ORIX Corporation 22% 3,209 629 46.5% 5.1x 11.0x
Provider of alternative and Listed Japanese company
renewable energy technology engaged in financial services
Jul/17 FUTUREN SA EDF Energies Nouvelles SA 100% 394 57 49.4% 6.9x 14.1x
French provider of energy from French company engaged in
renewable sources services of electricity power
plants
Jul/17 WGL Holdings Inc. AltaGas Ltd. 100% 6,227 2,096 18.4% 3.0x 16.1x
Provides clean, efficient and Energy infrastructure com-
diverse energy solutions pany engaged in acquiring
and growing gas and power
infrastructure
Jun/17 Pattern Energy Group Inc. Public Sector Pension 10% 3,152 336 52.0% 9.4x 18.0x
Develops, constructs, owns Investment Board
and operates renewable and Canadian state-owned pension
transmission energy invesment managing firm.
May/17 Canvest Environmental Shanghai Industrial Holdings 13% 1,194 202 42.2% 5.9x 14.0x
Protection Group Co. Ltd. Limited
Eengaged in development, HKEx-listed company engaged
management and operation of in investments in various
waste-to-energy plants sectors
May/17 Jiangsu Dingyang Green Tech Roshow Technology Co. Ltd. 100% 102 28 36.1% 3.7x 10.3x
Electric Co. Ltd. Listed Chinese company
Engaged in solar power station engaged in electromagnetic
investment, installation and wire products
operation
Mar/17 Trina Solar Limited Consortium for Trina Solar Ltd. 95% 2,085 2,778 10.3% 0.8x 7.3x
Chinese photovoltaic cell Acquisition verhicle formed by
producer Mr. Jifan Gao and Industrial
Bank Co. Ltd.
Feb/17 Lincs Wind Farm Limited Green Invevstment Group 75% 1,116 133 62.4% 8.4x 13.5x
Owns and operates wind farms Limited
Engaged in infrastructure
investments in the energy
sector
Source: Mergermarket
IMAP 25OIL & GAS
Appendix 5/5
Listed peer valuations: Oil and gas
Market Enterprise
Net debt Revenue EBITDA EV / EV /
Company Name capitalization value EV
(EUR M) (EUR M) margin (%) Revenue EBITDA
(EUR M) (EUR M)
Royal Dutch Shell 248,543 56,329 304,872 263,040 15.9% 1.2x 7.3x
BP Plc 128,929 32,446 161,375 207,040 10.4% 0.8x 7.5x
Chevron Corporation 205,290 29,181 234,471 116,078 21.4% 2.0x 9.4x
ExxonMobil Corporation 300,707 -414 300,293 204,415 16.5% 1.5x 8.9x
Total SA 147,609 7,240 154,849 147,813 15.5% 1.0x 6.7x
Eni SpA 60,860 20,179 81,039 66,919 23.2% 1.2x 5.2x
ConocoPhillips Company 73,018 11,531 84,549 25,087 18.3% 3.4x 18.4x
Sinopec 103,663 2,680 106,342 290,350 9.0% 0.4x 4.1x
Petrochina 183,148 42,149 225,297 258,138 15.6% 0.9x 5.6x
LUKoil 51,370 3,886 55,256 80,680 14.0% 0.7x 4.9x
Valero Energy 42,993 2,605 45,598 81,003 5.9% 0.6x 9.5x
Petrobras (Petróleo Brasileiro SA) 65,081 74,579 139,660 76,562 27.6% 1.8x 6.6x
Gazprom 46,029 32,582 78,611 88,962 22.7% 0.9x 3.9x
Marathon Petroleum Corporation 31,592 8,563 40,155 64,414 8.1% 0.6x 7.7x
PTT Public Company Limited 39,305 7,707 47,012 51,811 17.6% 0.9x 5.2x
Rosneft 61,970 50,147 112,117 79,868 10.6% 1.4x 13.2x
Equinor ASA (Statoil) 77,712 20,586 98,299 52,552 36.8% 1.9x 5.1x
Indian Oil Corporation 19,828 6,497 26,325 63,554 8.5% 0.4x 4.9x
Enterprise Products Partners L.P. 54,194 21,172 75,366 25,204 19.1% 3.0x 15.7x
Repsol S.A. 27,358 9,685 37,043 41,242 12.6% 0.9x 7.1x
OMV 15,710 3,414 19,124 20,222 17.7% 0.9x 5.3x
Saipem SPA 4,570 1,367 5,937 9,038 19.3% 0.7x 3.4x
Petrofac 2,431 527 2,959 5,512 4.4% 0.5x 12.2x
Schlumberger Limited 79,549 14,135 93,685 26,237 10.6% 3.6x 33.8x
Average 1.3x 8.8x
Median 0.9x 6.9x
Source: Annual Reports, Orbis
26 IMAPOIL & GAS
About IMAP
IMAP Sector Expertise
Global IMAP Energy & Utilities Group
North America ALEKSANDER KARLSEN
IMAP Norway
PELINO COLAIACOVO aleksander.karlsen@imap.com
IMAP CANADA – Toronto
pelino.colaiacovo@imap.com ALEXANDER S. AGUILERA
IMAP Norway
MAEGAN EVANS asa@imap.com
35
IMAP USA – Naples
maegan.evans@imap.com MAXIM URYASH
IMAP Russia
KERRY DUSTIN maxim.uryash@imap.com
IMAP USA – Naples
COUNTRIES kerry.dustin@imap.com OYVIND SOLVANG
IMAP Norway
350
Joel Schneyer oyvind.solvang@imap.com
IMAP USA – Denver
joel.schneyer@imap.com
Latin America
Raymond McCormick
IMAP USA – Dallas SERGIO MILIC
ADVISORS IMAP Chile
rmccormick@imap.com
sergio.milic@imap.com
Europe GUSTAVO JUNQUEIRA
IMAP Brazil
IMAP is a global merger and acquisition gustavo.junqueira@imap.com
JAN-PIETER BORST
advisory organization with a presence IMAP Netherlands
in 35 countries. IMAP closed over 2,100 jan-pieter.borst@imap.com
transactions valued at USD 90 billion Africa
in the last 10 years and is consistently FRANK RUIJGROK
ranked among the world´s top M&A IMAP Netherlands ABDELLATIF IMANI
advisors (Thomson Reuters) for mid- frank.ruijgrok@imap.com IMAP Morocco
market transactions. abdellatif.imani@imap.com
GIOVANNI MAUTONE
www.imap.com IMAP Italy
giovanni.mautone@imap.com
IMAP 27IMAP october 2018
Oil & Gas Sector Report Authors:
Contact
IMAP Netherlands
Javastraat 8
3016 CE Rotterdam
The Netherlands
Gustav Mahlerplein 2
1082 MA Amsterdam JAN-PIETER BORST FRANK RUIJGROK WOUTER MOSTERT TJALIE STEENBERGEN
The Netherlands IMAP Netherlands IMAP Netherlands IMAP Netherlands IMAP Netherlands
www.imap.nl jborst@imap.nl fruijgrok@imap.nl wmostert@imap.nl tsteenbergen@imap.nlYou can also read