October 2019, Revised August 2021 - National Bureau of Economic Research
←
→
Page content transcription
If your browser does not render page correctly, please read the page content below
NBER WORKING PAPER SERIES

                     SUBSIDY TARGETING WITH MARKET POWER

                                       Maria Polyakova
                                       Stephen P. Ryan

                                     Working Paper 26367
                             http://www.nber.org/papers/w26367

                    NATIONAL BUREAU OF ECONOMIC RESEARCH
                             1050 Massachusetts Avenue
                               Cambridge, MA 02138
                          October 2019, Revised August 2021

We are grateful to David Card, Keith Ericson, Mark Shepard, and Pietro Tebaldi for their
discussions of the paper, and seminar participants at Daniel McFadden 80th Birthday Conference,
Junior Health Economics Summit, Ohlstadt Workshop, Stanford University, London School of
Economics, American Society of Health Economists, Yale University, University of Connecticut,
Columbia University, Bates White Life Sciences Symposium, University of Munich, 2018
REStud Reunion Conference, Rice University, University of Utah, University of Leuven, Georgia
State University, UNC Chapel Hill, SUNY Stony Brook, University of Toronto, MIT, 2019 Penn
State-Cornell Econometrics & IO Conference, Stanford University, University of Wisconsin
Madison, NBER Health Care Meetings, and NBER Public Economics Meetings for helpful
comments. We thank Alan Jaske, Lynn Hua, and Vinni Bhatia for excellent research assistance.
Support of preliminary work related to this research by the Agency for Healthcare Research and
Quality is gratefully acknowledged (grant R03-HS024800). The views expressed herein are those
of the authors and do not necessarily reflect the views of the National Bureau of Economic
Research.

NBER working papers are circulated for discussion and comment purposes. They have not been
peer-reviewed or been subject to the review by the NBER Board of Directors that accompanies
official NBER publications.

© 2019 by Maria Polyakova and Stephen P. Ryan. All rights reserved. Short sections of text, not
to exceed two paragraphs, may be quoted without explicit permission provided that full credit,
including © notice, is given to the source.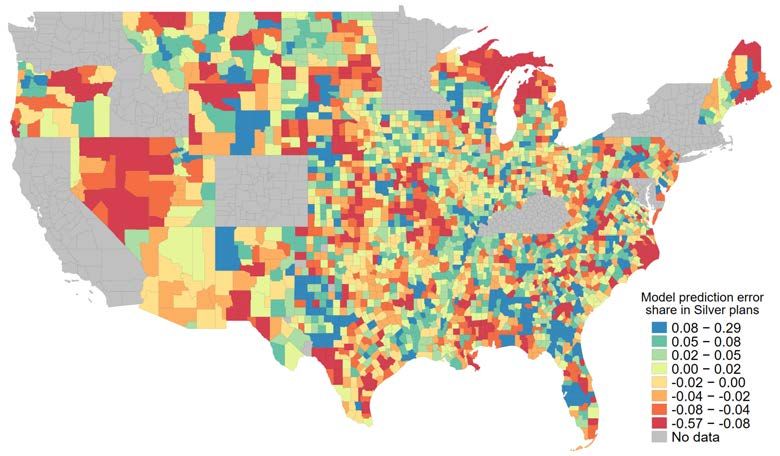
Subsidy Targeting with Market Power
Maria Polyakova and Stephen P. Ryan
NBER Working Paper No. 26367
October 2019, Revised August 2021
JEL No. H0,H2,H20,H21,H22,H23,H31,H41,H5,H51,I1,I10,I11,I13,I18,I38,L0

                                         ABSTRACT

Public programs frequently use observable characteristics of recipients, such as income, to target
benefits. We show theoretically that when the provision of the subsidized good is decentralized to
intermediaries with market power, targeting of subsidies induces a “demographic externality” that
can distort the incidence and efficiency of public transfers. We examine this possibility
empirically in the context of means-tested subsidies for privately-provided health insurance under
the Affordable Care Act (ACA). We estimate that the overall incidence of premium subsidies on
consumers in ACA Marketplaces is less than 50 percent, and a third of net government spending
on premium subsidies is a deadweight loss. Market power in the presence of means-tested
subsidies leads to regressive redistribution, lowering consumer surplus and rates of insurance in
the poorer population targeted by subsidies. Under sufficiently high social preferences for
redistribution, however, means-tested subsidies still dominate income-invariant transfers.

Maria Polyakova
Center for Health Policy
Stanford School of Medicine
Encina Commons, Room 182
615 Crothers Way
Stanford, CA 94305
and NBER
maria.polyakova@stanford.edu

Stephen P. Ryan
Olin Business School
Washington University in St. Louis
Campus Box 1133
One Brookings Drive
St. Louis, MO 63130
and NBER
stephen.p.ryan@wustl.edu
1       Introduction
Many public programs, such as housing assistance, food stamps, health insurance, free school
lunch, and energy assistance, are in-kind government transfers targeted to recipients based
on observable characteristics such as income, age, employment, family, or disability status
(Akerlof, 1978; Nichols and Zeckhauser, 1982; Smeeding, 1984; Currie and Gahvari, 2008;
Hoynes and Schanzenbach, 2016). The literature studying the economic costs and benefits of
such transfers has almost exclusively focused on potential distortions in recipients’ behavior,
while assuming that the subsidized goods or services are provided by a benevolent government
or perfectly competitive firms (recent examples include Jacob and Ludwig, 2012; Allcott et
al., 2015; Lieber and Lockwood, 2019; Basurto et al., 2017; Hendren and Sprung-Keyser,
2020). In practice, however, governments are increasingly relying on imperfectly competitive
intermediaries to deliver subsidized benefits.1 The fiscal magnitude of this shift is staggering.
In health insurance alone, for example, the US government spends $0.6 trillion annually
in subsidies for products provided by private firms (CBO, 2019a,b,c), with an expansion
projected under the Biden administration for 2021 onward.2 Yet, despite the importance of
understanding the economics of such environments for policy-making, the existing literature
provides little guidance on how the presence of profit-maximizing intermediaries may affect
the productive efficiency and the allocative properties of targeted in-kind transfers.
    In this paper, we seek to close this gap by extending the literature along two dimen-
sions. First, we combine insights from both public economics and industrial organization to
outline a set of fundamental economic forces that characterize the equilibrium outcomes of
subsidy targeting under market power. Second, we apply these insights to the subsidized
health insurance market that was launched under the Affordable Care Act in 2014 (hereafter:
“ACA Marketplaces”), an important empirical setting that provides insurance to nearly ten
million people in the United States and costs the federal government more than $40 bil-
lion in annual outlays. Conceptually, we show that in addition to the standard imperfect
pass-through of subsidies to consumers, a subsidy-induced “demographic externality” arises.
Targeted transfers change the relative importance of different consumers in the firm’s profit-
maximization problem and the equilibrium price a given consumer faces becomes a function
    1
     Private provision is frequently motivated by the desire to improve program efficiency through competition
as well as to reduce fiscal uncertainty for federal and state program budgets.
   2
     Contracting with private firms to provide public benefits is particularly common in health care. Poterba
(1996) outlines the stark differences in the choice of public policy instruments between education and health
care, highlighting the much more common payment to private agents—rather than direct provision—in the
health domain.

                                                      1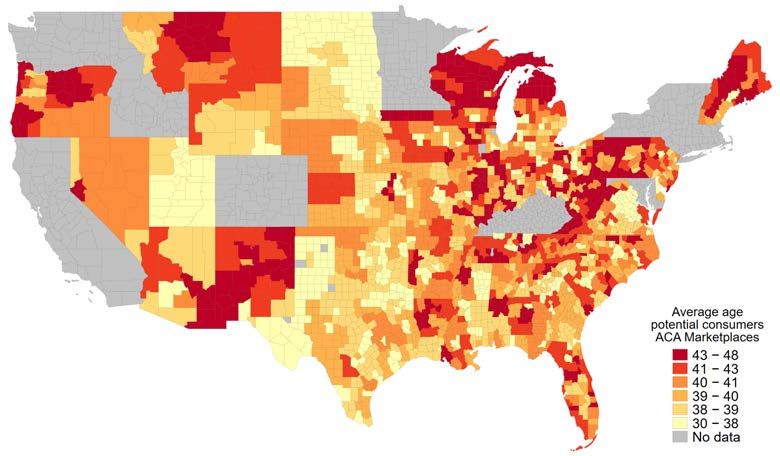
of her neighbors’ eligibility for transfers.3 This externality can distort both which consumers
benefit from subsidies and aggregate efficiency. In our ACA setting, we find that only 50%
of surplus generated by subsidies is passed through to consumers, while the rest is captured
by firms. Critically, we find that the interaction of market power with targeting generates
regressive distributional effects in ACA markets, leading to disproportionately lower con-
sumer surplus and insurance rates among lower income and older consumers relative to an
environment with perfect competition, working counter to the policy-makers’ targeting goals.
    The subsidy-driven interdependency of consumers belongs to a broader class of mecha-
nisms where equilibrium outcomes are a function of the distribution of heterogeneous con-
sumers in the same market. An extensive literature has studied several distinct types of
such mechanisms. The classic notion of adverse or advantageous selection, for example, is
a cost-driven demographic externality in which consumers are linked through risk pooling
(Rothschild and Stiglitz, 1976). Tebaldi (2017), which is the closest work to our paper, both
methodologically and in terms of the empirical context, examines such cost-based externality
in the California ACA market. He estimates efficiency distortions that arise because insurers
pool risks across consumers of different ages that have different costs, but are constrained in
how much they can price-discriminate based on age. Demand-driven demographic externali-
ties can arise due to the pooling of consumers with heterogeneous preferences. For example,
features of differentiated products available to a consumer may depend on the preferences of
the consumer’s neighbors (George and Waldfogel, 2003; Waldfogel, 2003). In general, when
price discrimination is prohibited, the price a given group pays is a function of the distribu-
tion of other demand types (Stole, 2007). In markets with selection, differences in consumer
demand types may correlate with differences in costs, combining preference-based and cost-
based spillovers (Finkelstein and McGarry, 2006; Handel et al., 2019; Shepard, 2016). In this
paper, we develop a modeling strategy that encompasses these disparate effects in a unified
framework. This allows us to assess the equilibrium interactions of the cost, demand, and
subsidy spillover channels with market power.
    The aggregate direction of distortions attributable to the interaction of market power and
targeted transfers is theoretically ambiguous and is thus an empirical question in any given
setting. In this paper, we ask this empirical question in the context of a publicly subsidized
health insurance market. We consider ACA Marketplaces facilitated through the federal
online platform www.healthcare.gov that operates in 36 states. The ACA Marketplaces
   3
    The externality does not arise if firms are able to perfectly price-discriminate and set a different price
for each group of differentially targeted consumers. Such perfect price discrimination is rarely possible in
practice. In our empirical context, for instance, insurers are regulated to set one price per market.

                                                      2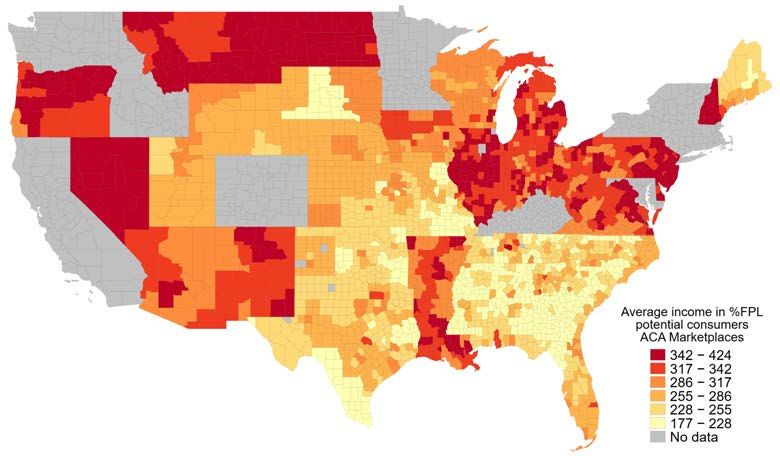
provide a fruitful empirical laboratory for studying the impact of market power on targeted
transfers for several reasons. First, it is an important market with nearly 10 million enrolled
consumers that is expected to grow in the future. Second, targeted transfers are a first-order
feature of the market: the vast majority (85%) of consumers receive a means-tested tax
credits to help defray premium costs. The generosity of the tax credit is a declining function
of a consumer’s income, reaching zero for higher-income consumers. Third, the significant
exercise of market power in this environment is likely, as many geographic markets are
highly concentrated. Fourth, firm pricing is regulated and premiums cannot vary by income.
Given these institutional features, we anticipate the interaction between means-tested public
transfers and market power in this setting to be quantitatively important.
    To quantify this interaction, we formulate and estimate a structural model of supply and
demand for ACA Marketplace insurance plans. On the demand side, we utilize the institu-
tional setting of the Marketplaces to implement a within-market identification strategy that
leverages price variation generated across consumers by the regulatory design of subsidies.
On the supply-side, we derive equilibrium first-order conditions that link prices and marginal
costs, incorporating the demographic externality, risk-sorting, and regulatory constraints on
prices.
    With the estimates of demand and supply in hand, we perform several counterfactual
simulations of the market equilibrium that allow us to measure the impact of market power
on subsidies. We start by simulating a counterfactual environment without subsidies, holding
all else equal. This allows us to measure the aggregate efficiency of existing subsidies and
their incidence between consumers and producers. We report three major findings: subsidies
make consumers and firms better off by an additional $14.8 billion; firms capture $7.9 billion
of that surplus, or 53 percent; and the program generates a deadweight loss of $5.7 billion,
as it requires $20.5 billion in additional (net) government expenditures.4
    The distribution of surplus from targeted subsidies is highly heterogeneous across con-
sumer types. While all subsidized consumers are better off with subsidies than without, the
lowest-income consumers experience up to a four-fold higher increase in consumer surplus
than partially-subsidized consumers, while unsubsidized consumers are modestly worse-off
with subsidies than without. A similar pattern characterizes the effect of subsidies on the
rate of insurance coverage. Subsidies increase insurance take-up among the lowest income
consumers by up to 80 percentage points, while reducing coverage rates slightly among un-
   4
    We compute government expenditures on subsidies net of savings on publicly paid uncompensated care.
Further, if raising extra $20.5 billion cost taxpayers 30 cents on a dollar, then the deadweight loss of the
program accounting for the cost of public funds would be $11.9 billion.

                                                     3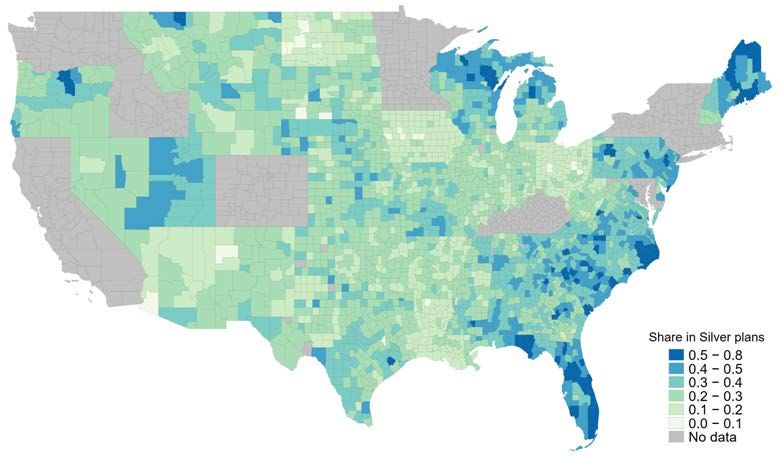
subsidized consumers. Dovetailing with our theoretical framework, subsidies exert counter-
vailing forces on the equilibrium prices in this market, simultaneously attracting inherently
more elastic, lower-income consumers with higher marginal costs while also directly lowering
demand elasticity.
    Next, we turn to the question of how much market power exerted by firms on ACA Mar-
ketplaces affects the distributional outcomes of means-tested transfers. As this is a central
question of the paper, we pursue two complementary measurement approaches. First, we
compare the level of consumer surplus and insurance rates among different consumers types
under the observed regime with subsidies and imperfect competition and a counterfactual
regime that holds subsidies fixed but removes market power. We find that in the presence of
subsidies market power reduces overall consumer surplus by 21 percent and aggregate rate
of insurance by nearly 15 percentage points (from 59 to 45 percent insured). The largest rel-
ative decline in consumer surplus form market power occurs among the poorest consumers:
we estimate a decline in consumer surplus of 18 percent on average among unsubsidized
consumers with income over 400% FPL and a decline of 46 percent among consumers with
incomes between 150% and 200% FPL. Similarly, while consumers with incomes over 400%
FPL experience a ten percentage point drop in insurance rate, consumers with incomes in
between 200% to 300% FPL see nearly a 25 percentage drop in the coverage rate.
    Our second approach measures the difference in gains from subsidies with and without
market power. We compare two scenarios. The first scenario assumes that means-tested
subsidies are rolled out into a perfectly competitive market. We measure gains in consumer
surplus and insurance coverage rates by consumer type. This variation in gains across con-
sumer types reveals the distributional effects of transfers under perfect competition.5 We
then contrast this to the gains in consumer surplus and insurance rates in the scenario where
means-tested transfers are rolled out into an imperfectly competitive market. Comparing
the gains from means-tested subsidies (relative to no subsidies) by different consumer types
between the competitive and imperfectly competitive scenarios allows us to assess how much
market market power distorts the distributional effects of subsidies. We find that market
power lowers the average gain from subsidies across all consumers by $270 per capita (from
$613 to $343), or 44 percent, while disproportionately harming the lowest-income and oldest
consumers. The gains in consumer surplus from subsidies are on average ca. $1,000 (or 46
percent) lower among consumers age 60 or older with income under 300% FPL when markets
   5
     If all consumer types have equal marginal costs, as is the case in most product markets, this incidence
will be equal to the schedule of subsidies, subject to a zero-price lower bound. With risk sorting, even under
perfect competition subsidies may change insurer costs and affect unsubsidized consumers.

                                                      4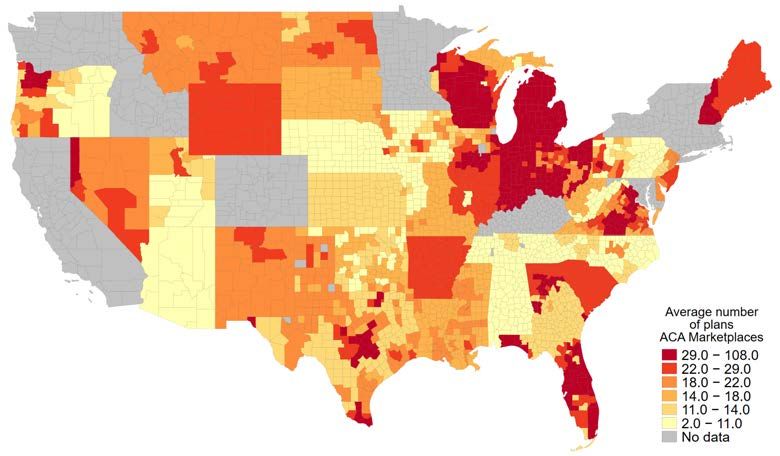
are imperfectly competitive. Thus market power redistributes the marginal subsidy dollar
away from the intended means-tested schedule.
    The take-away from our results is that when imperfectly competitive intermediaries pro-
vide a subsidized good, the market power of these intermediaries can interfere with distri-
butional objectives of the policy-maker. These results cast doubt on the effectiveness of
the common approach of incorporating distributional policy instruments into environments
where a publicly subsidized good is privately provided.
    A natural question is whether there are alternative subsidy mechanisms that still pro-
vide incentives for consumers to buy insurance, but reduce efficiency distortions from market
power. We consider this question in the last section of the paper by examining one commonly-
proposed alternative mechanism: “flat” subsidies that remove means-testing completely but
keep net government spending the same. We find that flat subsidies lead to substantially
higher subsidy pass-through to consumers and reduce the deadweight loss. However, if the
society has preferences for redistribution, then the choice between means-testing versus flat
subsidies generates a stark equity-efficiency tradeoff. In the absence of preferences for redis-
tribution, means-testing is a strictly dominated mechanism in this market. As we estimate
higher marginal utility of income among lower-income households, our model implies that
these households have low willingness to pay for health insurance, preferring cash transfers
to in-kind subsidies for insurance.6 This results does not hold, however, if we allow for a
welfare function that puts value on redistribution per se. We use the Atkinson (1970) welfare
function with constant relative inequality aversion, which assigns higher welfare weights to
consumers with lower income, to illustrate this point. We estimate that from the consumer
surplus perspective, means-testing becomes preferred to flat vouchers once the preference for
redistribution is relatively strong, with the inequality aversion parameter higher than 1.3,
implying that the society values transferring $1 to a household with income of $17,820 (150%
FPL in 2017 for a single person household) as much as transferring to $3.6 to a household
with income of $47,520 (400% FPL in 2017 for a single person household).
    Our work relates closely to the growing literature on the design of subsidies for health
insurance in general (Curto et al., 2015; Jaffe and Shepard, 2018; Decarolis, 2015; Decarolis
et al., 2020; Miller et al., 2019; Einav et al., 2019) and in the ACA Marketplaces more
specifically (Aizawa, 2019; Aizawa and Fang, 2020; Aizawa and Fu, 2020; Tebaldi, 2017;
   6
     This finding is not unique to ACA Marketplaces, or even health insurance more generally, and has been
documented in other health insurance settings (Finkelstein et al., 2019), as well as other markets such as
subsidized housing (Rosen, 1985).

                                                    5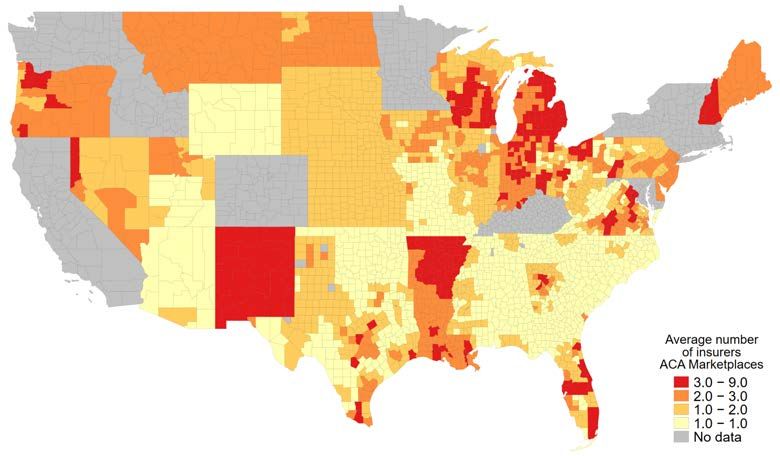
Tebaldi et al., 2019).7 Our results also speak to the optimal design of rating areas (a
regulatory grouping of markets where prices must be set equally for a given plan), which has
been investigated in Dickstein et al. (2015). Alternative rating areas would lead to different
pooling of demographics and would thus generate different equilibrium outcomes under the
mechanism that we investigate in this paper.
    Outside of health insurance, our paper is conceptually similar to a set of recent papers
that have examined the strategic motives of private firms delivering goods that are publicly
subsidized for some consumers but not others, across a variety of domains. For example,
Cellini and Goldin (2014) and Fillmore (2019) have examined the relationship between federal
grants that only some students are eligible for and college tuition; Rothstein (2010) examined
how firms set wages in the presence of the Earned-Income Tax Credit; Goldin et al. (2018);
Meckel (2019); Meckel et al. (2020) consider the effects of food assistance programs on the
pricing and entry of grocery stores; and Rosen (1985); Eriksen and Ross (2015); Collinson
and Ganong (2018); Waldinger (2018) examine the efficiency of housing vouchers and how
they may change housing prices. We seek to generalize the insights from this literature into
a framework that is likely to be applicable in a variety of settings, including health insurance
that accounts for by far the largest share of such transfers in the US.
    The paper proceeds as follows. Section 2 discusses the theoretical framework. Section
3 gives a brief primer on the ACA Marketplaces and describes our data sources. Sections
4.1, 4.2, and 4.3 lay out the empirical models of demand and supply, and describe how
we measure welfare. 4.4 reports estimation results. Section 5 then proceeds to simulate
counterfactual equilibria to measure the efficiency and incidence of observed transfers and
the role of market power. Section 6 briefly concludes.

2       Theory
We are interested in the interaction between targeted transfers and market power in general
economic settings. Consider a market that is populated with consumers that have a distribu-
tion of types, D, which encapsulates salient consumer characteristics such as endowments,
    7
    More broadly, our work also relates to the literature that has considered the incidence of tax exclusions
that are effectively subsidies for employer-sponsored health insurance plans (e.g., Gruber and Washington,
2005; Gruber, 2005; Gruber and Poterba, 1996) as well as the design of employer rather than government
subsidies for health insurance (Cutler and Reber, 1998; Ho and Lee, 2019). Further, Saltzman et al. (2015);
Taylor et al. (2015) used the RAND Corporations model of employer-sponsored insurance to simulate an
extensive set of alternative subsidy designs for ACA Marketplaces in a stylized framework with no strategic
firms.

                                                     6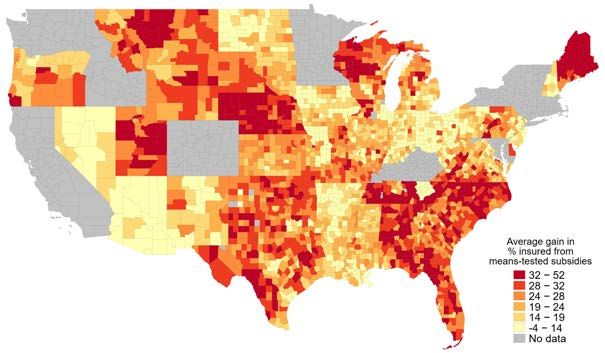
preferences, or risk. On the supply side, firms offer a set of products to consumers and
compete under a set of market rules, r, set by the policymaker. Such rules might include
restrictions on the minimum set and types of products firms must offer or limits to price
discrimination. Let θ ∈ Θ represent the current market structure out of the set of all possible
market structures; we normalize θ0 to represent perfect competition. The government sets a
subsidy schedule, Z(D), which gives targeted transfers to consumers based on demographics
for the sole purpose of purchasing a product in this market.
    Within this environment, define the distribution of an equilibrium outcome—such as a
social welfare function, some measure of the efficiency of government spending, or subsidy
incidence—as:
                                     H(Z(D), θ, D, r),                                      (1)

which takes the subsidy schedule, market structure, demographic distribution, and market
rules as arguments.
    Various strands of the literature have examined components of Equation 1, but often in
isolation from each other. For example, the extensive literature investigating the equilibrium
effects of asymmetric information is often concerned with assessing the role that D plays in
Equation 1. The vast majority of this literature has assumed that θ = θ0 . For example,
Rothschild and Stiglitz (1976) and Azevedo and Gottlieb (2017) examine conditions under
which an equilibrium with adverse selection will exist while assuming perfectly competitive
insurance markets. Hendren et al. (2020) analyze the value of choice in insurance settings
with adverse selection and moral hazard and derive optimal Pigouvian subsidies under the
assumption of no market power. However, as highlighted by Mahoney and Weyl (2017),
failing to account for the interaction of selection and market power can potentially lead to
misleading policy conclusions.8
    In contrast, the literature on optimal subsidy design has primarily focused on the role of
Z(D). A central object of interest in this literature is the effect on equilibrium outcomes of
introducing a subsidy:
                                H(Z(D), θ, D, r) − H(0, θ, D, r),                           (2)

where H would be, for example, the distribution of surplus across firms and consumers.
The vast majority of this literature examines subsidy design in the environment of perfect
competition or a benevolent government. A notable exception is a series of papers that have
considered the optimal subsidy design problem in the context of health insurance markets
   8
     A small but growing empirical literature has started examining the role of market power in markets with
selection (e.g. Crawford et al., 2018).

                                                     7
(e.g., Curto et al., 2015; Jaffe and Shepard, 2018; Decarolis, 2015; Tebaldi, 2017; Decarolis
et al., 2020; Miller et al., 2019; Einav et al., 2019). These papers keep the market structure
environment fixed and focus on the changes in equilibrium outcomes with respect to the
subsidy schedule given by the following functional derivative:

                                            ∂H(Z(D), θ, D, r)
                                                              .                                         (3)
                                                ∂Z(D)
   In this paper, we extend this prior literature by investigating how the distribution of
equilibrium outcomes H depends on the interaction between market structure θ and the
subsidies’ dependence on consumer type D. The change in outcomes going from the observed
market structure to perfect competition that we are interested in is:

                                H(Z(D), θ, D, r) − H(Z(D), θ0 , D, r).                                  (4)

By interacting this difference with the calculation in Equation 2, we can assess how market
power, ceteris paribus, changes the distribution of equilibrium outcomes in the presence of
targeted subsidies:

          (H(Z(D), θ, D, r) − H(0, θ, D, r)) − (H(Z(D), θ0 , D, r) − H(0, θ0 , D, r)) .                 (5)
          |              {z                } |                  {z                  }
         Subsidy Effect with Observed Market Structure       Subsidy Effect under Perfect Competition

   A primitive that drives the outcome of 5 is the elasticity of the objective function with
respect to the distribution of demographics:

                                     ∂H(Z(D), θ, D, r)
                                                       .                                  (6)
                                            ∂D
In settings where perfect price discrimination is either not possible or prohibited by regu-
lation, Equation 6 will typically be non-zero on its support. We term the dependence of
equilibrium outcomes on the distribution of types as a “demographic externality,” as gener-
ically a consumer’s outcome will depend on the distribution of its neighbors’ types.
    We note that the effects captured by Equations 4, 5, and 6 do not necessarily depend on
any notion of asymmetric information in D; a market setting can have non-trivial interactions
between market power and subsidy targeting without suffering from either adverse selection
or moral hazard. The fact that Z(D) depends on D directly has the possibility of generating
economically-relevant demographic externalities. To illustrate these forces in more detail,
we turn to a simple worked example of a monopolist selling in an insurance market.

                                                         8
Monopoly Example Consider a market where a single good is sold at a uniform price.
Suppose that there is a unit mass of consumers and each of them has the following utility
for the good:
Ui = u(p; di , θi , i ), (7)
where i indexes the consumer, p is the product’s price, di are consumer characteristics,
θi is a vector of utility parameters, and i is a vector of preference shocks. Consumers
purchase a unit amount of the good if and only if Ui > 0. Denoting the distribution of
consumer characteristics by D and the joint set of preferences and shocks by F , market-level
demand—share of consumers buying the good s(p)—is formed by aggregating individual
demands: Z Z
s(p) = 1(u(p; d, θ, ) > 0)dF dD = sd (p; d)dD, (8)
where sd (p; d) is the share of consumers within group d who buy the good.
Now suppose the government introduces a schedule of targeted subsidies, Z(D), where
consumers of type d receive a transfer equal to zd if they buy the good and do not receive any
transfer if they do not. An extensive literature going back at least to Hylland and Zeckhauser
(1981) and Nichols and Zeckhauser (1982) discusses when in-kind targeted transfers may
improve target efficiency of distributional policies and be preferred by the government to
unrestricted cash transfers. For the moment we sidestep the issue of the optimality of
transfer design per se, and take the choice of the policy instrument Z(D) as given. We come
back to the question of subsidy design and the tradeoff between efficiency and redistribution
in the context of our empirical application in Section 5.
Given the subsidy schedule Z(D), demand shifts outward:
Z
s(p, Z(D)) = sd (p − zd ; d)dD. (9)
Next, consider the supply side of the market. Under perfect competition, prices are set
equal to average marginal cost. Denoting the marginal cost of each consumer type by cd ,
the competitive price solves the following equation:
Z
1
p= cd · sd (p − zd ; d)dD. (10)
s(p, Z(D))
If marginal costs are equal across all consumer types, as is the case in many product markets,
Equation 10 reduces to the familiar p = c formulation.
When a private intermediary with market power is introduced to the model, there are
9additional changes in equilibrium. Rather than setting price at average marginal cost, the
firm sets prices to maximize profits:
Z
π(p) = sd (p − zd )(p − cd )dD. (11)
The equilibrium price equalizes marginal revenue and marginal cost:
∂sd (p − zd ) ∂sd (p − zd )
Z Z
sd (p − zd ) + p · dD = cd · dD. (12)
∂p ∂p
In general, the equilibrium price under both market structures depends on the distribu-
tion of demographics D—a relationship that we label a “demographic externality.” Formally,
it is the functional derivative of (consumer-facing) price with respect to the distribution of
demographics:
∂(p − z)
. (13)
∂D
While the demographic externality encompasses many mechanisms that generate interde-
pendencies across consumers in a market, in our setting we focus on the demographic exter-
nality driven by means-tested public subsidies. To the first order, such subsidies change the
demand curve for lower-income consumers, reducing demand elasticity of these consumers
and increasing incentives for the firm to raise prices. In addition, subsidies change the rel-
ative importance of different consumer types in the firms’ profit function, with ambiguous
effects on the equilibrium price. For example, if lower-income highly-subsidized consumers
also have very elastic demand, attracting these consumers into the market could dampen
incentives to raise prices.
We highlight the mechanism of the demographic externality in the context of means-
tested public transfers because it may generate negative (and potentially ironic) equilibrium
outcomes. For example, suppose that consumers are all identical except for income. If the
government sets up a schedule of means-tested subsidies for the good that decline in income,
consumers in the middle of that income distribution will end paying more out-of-pocket for
the good when they are surrounded by relatively more poor consumers. This is a type of
price discrimination effect that is inverted from the standard model, where being surrounded
by high-income, low-elasticity neighbors can lead to an increase in prices. The demographic
externality that stems from targeted subsidies generates inequality in consumption across
markets solely due to demographic composition, which is an undesirable consequence of the
regulatory design.
103 Institutional Primer and Data
Institutions Our empirical application is the US market for non-group health insurance
plans that was launched in 2014 under the Affordable Care Act (ACA). The ACA “Mar-
ketplaces” platform allows consumers to purchase health insurance plans for themselves and
their families. Insurance plans sold on this market are high dimensional products, offering
a variety of cost-sharing levels and provider networks. The financial characteristics of plans
are frequently summarized by its actuarial value that measures the fraction of costs that a
plan would cover for a standardized population. Plans are grouped into “metal levels” on the
basis of how much risk is borne by the insurer versus the consumer: Bronze (60% actuarial
value), Silver (70%), Gold (80%), and Platinum (90%); there is also a “catastrophic” level,
characterized by low premiums and high deductibles, that is only available to consumers
under 30. While several US states have created their own ACA Marketplace programs, most
states (37) use an online federal platform, www.healthcare.gov, to facilitate the purchase of
insurance; we focus on these so-called “federally-facilitated’ states in our analysis. About 9
million enrollees bought insurance on the Marketplaces in these states in 2017, which is the
year of our data. Figure 1 provides an example of the user interface on the healthcare.gov
platform.
Insurers selling on the ACA Marketplaces set premiums for their plans subject to several
regulatory restrictions. First, insurers are not allowed to reject enrollees based on pre-existing
health conditions and are not allowed to price-discriminate based on individual health risk.
Insurers can collect different premiums from consumers based on age, but the age gradient
in premiums has to follow a pre-specified regulatory age curve.9 Second, insurers have to
charge the same premiums in all counties that belong to the same “rating area.” Rating
areas are collection of counties pre-specified by each state. In practice, while insurers have
to charge the same price if they offer their product in all counties in a rating are, they do not
have to serve all counties in a rating area. Thus, following Fang and Ko (2018) we consider a
county to be the relevant market boundary in this market. Finally, insurer premiums have to
satisfy the medical loss ratio (MLR), which requires them to spend at least 80% of revenue
on medical reimbursement, constraining markups to be at most 25 percent. The MLR has
been documented to be binding for the majority of insurance contracts in this market (Cicala
et al., 2019).
9
Insurers are also allowed to underwrite consumers’ smoking status; however, whether someone smokes
is hardly verifiable and very few consumers in the data are flagged as smokers. Consequently, we do not
consider prices for smokers in our analysis.
11Figure 1: Consumer interface on healthcare.gov
Notes: Screenshot of healthcare.gov for one of 121 plans that were offered to 40-year old individuals in
Cook County, IL in 2015. The premium that individuals see displayed incorporates the premium subsidy if
individuals enter their income information during the selection process.
12The key institutional feature of ACA Marketplaces are means-tested subsidies that can
be used by low income families to defray the cost of the insurance premium.10 Formally,
premium subsidies are known as Advanced Premium Tax Credits (APTC).11 The APTC is
calculated in several steps. First, the Modified Adjusted Gross Income (MAGI) for a tax
family is converted to the percent of the Federal Poverty Level (FPL).12 The FPL varies
with family composition and allows comparing incomes of families of different sizes using the
same scale. The MAGI relative to the FPL measure then determines the maximum dollar
amount that the (tax) household “should be” paying for insurance premiums. Let us call
this amount a CAP. The CAP is based on a non-linear sliding schedule specified by the
IRS.13 For example, in 2017, if a household’s income was 200 percent of the FPL, then this
household’s CAP was 6.34 percent of household income, while if income was 270 percent
FPL, the CAP was 8.7 percent. Subsidies phase out at 400 percent FPL, so that households
at or above this income threshold are not subsidized.
Once the CAP has been computed, the next step is to calculate the total premium
that a household would owe for a benchmark plan in the absence of subsidies. The bench-
mark insurance plan is set to be the second-lowest cost plan with 70 percent actuarial value
(“second-lowest cost silver plan,” or SLCSP) in the household’s county of residence. “Pre-
mium owed” is the total list premium that the household would have to pay to enroll all
family members who would like to be insured in the benchmark plan (known as “coverage
family”). If the household’s CAP is lower than the list premium that the household would
have had to pay for the benchmark plan, then the household gets an APTC that is equal
to the difference between “premium owed” and the CAP. If the list price of the plan that
the household actually buys is lower than the full APTC that the household is eligible for,
APTC is reduced to the actual cost of the plan, so that the final consumer-facing premium
can be zero, but cannot be negative. To summarize, the subsidy that household h receives
10
In addition, low income families qualify for cost-sharing reduction subsidies. These subsidies reduce the
out of pocket liability from deductibles, co-pays, and co-insurance. We take these subsidies as given and do
not alter them in our counterfactual analyses.
11
The APTC can be claimed concurrently with enrollment based on projected household income and then
adjusted (if necessary) when consumers file taxes. Consumers can also choose to forgo receiving advanced
credit and instead claim the subsidy as a regular tax credit in their tax return.
12
MAGI is reported on US tax form 1040. The AGI is the total income that includes wages, tips, self-
employment income, etc., as well as taxable interest, dividends, taxable parts of the social security income,
IRA, pension, and annuity distributions that is adjusted for a variety of deductions specific to the income
source, such as, for example, student loan interest deduction. MAGI modifies the AGI by adding back certain
deductions.
13
See IRS Form 8962 “Premium Tax Credit.”
13as a function of its income Yh is:
( )
X
zh = max 0, bi,SLCSP − CAP (Yh ) , (14)
i∈h
P
where i∈h bi,SLCSP is the total list premium that the coverage household would have to
pay for the benchmark plan. This mechanism both induces means-tested subsidies, as CAP
varies with income, and also ties the level of generosity for that subsidy to equilibrium price
through the price of the second-lowest cost silver plan. The out-of-pocket premium that that
household pays for plan j is then:
( )
X
phj = max 0, bij − zh . (15)
i∈h
Data and summary statistics Our analysis relies on a combination of several data
sources. First, we use 2017 Marketplace Public Use Files (PUF) that record detailed infor-
mation on which plans were offered in each geographic market of the federally-facilitated
Marketplaces, plan features, and list premiums. Second, we use data provided by the Cen-
ter for Consumer Information and Insurance Oversight (CCIIO) that reports Marketplace
enrollment counts.14 Enrollment is reported in several ways. First, we have enrollment re-
ported at the plan level, where plans may be offered in several markets. Second, we also
observe enrollment at the county level aggregated by different levels of plan actuarial values
(i.e. metal levels). For example, we observe how many individuals purchased a plan with
70 percent actuarial value (“Silver” plans) in Cook County, IL. Finally, we also observe the
market-level counts of consumers that enrolled in any plan by seven age and seven income
buckets.15 We enrich enrollment data with a dataset, provided by Kaiser Family Foundation,
that computes the number of potential ACA Marketplaces consumers for each geographic
region.16
Next, we use the 2017 American Community Survey (ACS) to create a representative sam-
ple of potential ACA Marketplace consumers in each county. For these potential consumers
14
CCIIO data is public and can be accessed at www.cms.gov/CCIIO/Resources/Data-Resources.
15
The age categories are: under 18, 18-25, 26-34, 34-44, 45-54, 55-64, and over 65. The income categories
are: below 100 FPL, 100-150 FPL, 150-200 FPL, 200-250 FPL, 250-300 FPL, 300-400 FPL, and over 400
FPL.
16
This data was requested in 2017 and underlies computations of Marketplaces take-up that Kaiser Family
Foundation (KFF) has been reporting continuously in its briefings “Marketplace Enrollment as a Share of the
Potential Marketplace Population.” KFF analysis, in turn, is based on the counts of uninsured individuals
from the American Community Survey.
14we observe household composition, household income relative to FPL, and age.17 Finally, we
use Optum database of claims and demographic information for the commercially insured
under-65 population to estimate the gradient in average healthcare costs across different age
and income groups. We use this database to create marginal cost multipliers as a function
of of age and income; these multipliers are then used in the marginal cost inversion below
to obtain plan-type specific marginal costs, which is key for accounting for selection in this
market.18 Appendix B provides details.
Table 1 summarizes the data. In 2017, consumers faced on average a choice of 21 plans.
2.2 large insurers operated in an average county. The annual list premium for a 40-year
old consumer ranged from $3,978 (10th percentile) to $6,351 (90th percentile) with an un-
weighted average of $5,160. The average number of potential enrollees per county was close
to 8,000 individuals, although markets differed dramatically in their size, ranging from fewer
than 479 potential enrollees at the 10th percentile of counties to more than 15,000 at the
90th percentile. On average across markets, 60 percent of potential enrollees chose not to
purchase a Marketplace plan; among those that did purchase, plans with 70 percent actuarial
value were by far the most popular, accounting for almost 75 percent of choices conditional
on enrollment. In an average market, the average plan had 3,156 enrollees, but plan sizes
varied substantially from plans covering fewer than 50 consumers to plans with more than
6,000 enrollees within a county. Potential enrollees based on our ACS sample were on aver-
age 39 years old and had an average household income of 295 percent FPL. About a third of
potential consumers had income under 200% FPL, making them eligible for the most gener-
ous subsidy levels, 37 percent had income over 200% FPL but under 400%FPL making them
eligible for partial subsidies, and another third of potential consumers had household in-
come over 400% FPL, making them ineligible for subsidies. On average, potential consumers
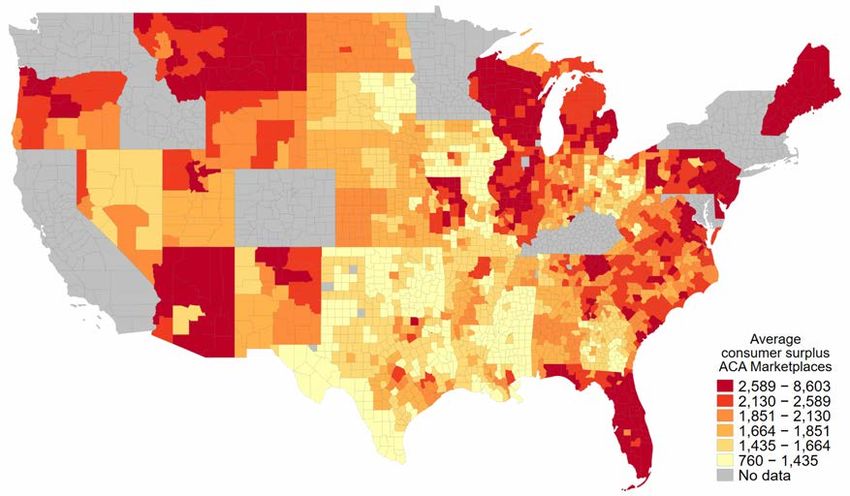
qualified for $2,349 in annual premium subsidies.19
17
To construct the sample of potential consumers we keep individuals in ACS who do not report having
employer-sponsored or public health insurance coverage. We further exclude individuals from our set of
potential consumers if they report having no health insurance coverage, but would likely be eligible for
Medicaid based on their household income in states that expanded Medicaid under the ACA.
18
Tebaldi (2017) uses multiplier from the MEPS database in a similar fashion.
19
We divide the household-level subsidy by the number of individuals that would need insurance in the
household to compute average subsidy per “coverage family” member.
154 Empirical Model
4.1 Demand
Utility function We estimate demand for health insurance plans on ACA Marketplaces
using a semi-parametric discrete choice random utility model. The unit of choice is a “cov-
erage family,” f , consisting of i = {1, . . . , Nf } members of the same tax household who are
in need of insurance coverage. Within each family, we assume that each consumer i obtains
the following utility of consuming insurance plan j:
uij = −αi pij + φij , (16)
where φij is the utility of plan j, pij is the plan’s out-of-pocket price, and αi is the marginal
disutility of price. We assume that the family f chooses a single insurance plan that maxi-
mizes the average utility across members of the family:
1 X 1 X
f j + uij > f k + uik , ∀k ∈ J s.t. k 6= j, (17)
Nf i∈f Nf i∈f
where f j is a family-level idiosyncratic taste shock for plan j, or chooses the outside option
of no purchase, which has a normalized payoff of zero.
We make several assumptions about αi and φij to arrive at an empirically-tractable
version of utility. First, we replace individual-specific αi with a coarser schedule of marginal
utilities of income. We allow α to vary across nine demographic groups, d. The demographic
groups are defined as the cross product of three age categories—age under 25, age between 25
and 40, age above 40—and three income categories—income under 200 percent FPL, income
between 200 percent and 400 percent FPL, and income above 400 percent FPL. Second, we
decompose φijt , the utility that a consumer gets from plan j, into several additively-separable
components:
φij = ψa(i) + γAVij + δj . (18)
The first component, ψa(i) , captures the average level of utility that consumers get from
purchasing any insurance plan. We allow this intercept parameter to vary across the same
three age groups as the price coefficient to capture the idea that the value of insurance may
vary across ages, all else equal.20 The second component, AVij , captures the deviations in
20
We also allow for a separate intercept for the group of consumers with income under 100 percent FPL.
While this group of consumers should not be participating in ACA Marketplaces, as they are commonly
16the generosity of plan j that consumers may face if they have sufficiently low income. For
these consumers, cost-sharing reduction subsidies change the actuarial value (AV) of plans.21
Finally, we include a plan-specific constant δj for each plan j that captures the average utility
that all consumers get from purchasing that plan.
Identification We briefly sketch out an intuitive identification argument for the param-
eters of our model given the type of data that we have. First, we note that Berry et al.
(1995) established that, after integrating out individual-specific utility components, there
exists a unique vector of mean product utilities, δ, for any vector of product shares within
a market. A complication arises in our setting because CMS reports enrollments at the
plan level, where plans are often offered in several markets. Therefore, we cannot construct
plan-market level shares. However, as we know where each product is offered we are able to
aggregate across individual markets to predict plan-level enrollments whenever a product is
offered in more than one local market. Under the assumption that the common component
of a plan’s utility is the same across all markets in which it is offered, there exists a unique
δj that rationalizes observed plan-level enrollments reported in the data.22
This establishes that δ is one-to-one in plan level enrollments conditional on individual-
level variation in utility. To establish the identification of the parameters governing these
individual-level utility components, we note that there are several dimensions of residual
variation in our data that δ alone cannot account for. We consider each of these sets of
parameters in turn.
Recalling that CMS reports metal-level enrollment by market, we can identify the marginal
willingness to pay for actuarial value, γ, through the variation in the share of enrollment
in Silver plans (the only plans that qualify for cost-sharing reductions) across markets with
different demographic compositions but the same set of plan choices. For example, Alabama
has a single set of plans offered to all consumers in the state. Demographic variation across
markets makes Silver plans more attractive in places with more consumers that qualify for
cost-sharing reductions; the degree to which Silver plans are more popular in those locations
eligible for Medicaid and are in theory not eligible for ACA subsidies, we observe some enrollees from this
group in the data; a separate intercept for this group allows the model to rationalize a very low, but non-zero,
inside share for this group.
21
To be eligible for cost-sharing reduction subsidies, consumers need to enroll in “Silver” plans, i.e. plans
with 70% actuarial value, and then the AV of the plan gets increased depending on consumers’ household
income.
22
This follows from a simple modification of the definition of a share to span multiple markets in Berry
et al. (1995)’s original proof, which shows that the difference equation defining δ is a contraction mapping,
which is a sufficient condition for uniqueness.
17identifies γ under the assumption that δ does not vary across markets.
Two additional sets of parameters vary across consumers: the disutility of price, αd(i) , and
the baseline valuation of insurance plans, ψa(i) . In our data, we do not observe individual-
level purchases; however, we do observe two moments of the data that are not usually present
in Berry et al. (1995) style models: at the market level, we observe the share of consumers
buying any product by intervals of age and income. While δ identifies the average level of
enrollments, and therefore the aggregate share of the inside option, it cannot rationalize the
within market variation in enrollments across ages or incomes. Within a given market, the
rate at which enrollments decline as income increases across income bins gives a local estimate
of α. Similarly, variation in the enrollment in the inside option across age bins identifies ψ,
the baseline willingness-to-pay for any insurance plan. As with γ, one could also use variation
across markets to identify those parameters; as the demographic distribution of consumers
in two markets varies by age and income, the patterns in overall enrollments identify both
sets of parameters.
Finally, we note that, in principle, both α and ψ can be flexible functions of income
and age, respectively. Analogous to a local linear regression, one can estimate slopes in a
neighborhood of any given age or income. Cross-market differences in the distribution of
demographics creates rich variation allowing for the flexible recovering of local estimates of
these two sets of coefficients.
Price Endogeneity A major concern in product markets is price endogeneity; the typical
issue is that price is correlated with unobserved quality or demand shocks within a market,
creating an inference problem. The usual solution to this problem in settings with aggregate
cross-sectional data is to search for instruments that move prices across markets (Hausman,
1996; Berry and Haile, 2016). Here, however, the regulatory design itself provides an innova-
tive solution to this issue. The key observation is that the subsidy schedule generates vari-
ation in prices across consumers within a market that is, by regulatory fiat, independent of
demand shocks or unobserved product quality. Subsidies vary across income levels according
to a pre-specified administrative formula, generating a non-decreasing relationship between
income and effective premiums, as discussed in Section 3. The statutory age-adjustment
curve does the same for consumers of different ages. These exogenous sources of variation
stemming from the regulatory design allow us to estimate α and ψ using a within-market
estimator while conditioning on δ. This approach is valid as long as consumers are not
systematically sorting themselves across markets on the basis of these regulatory-induced
18changes in prices.
4.2 Supply
Profit function Insurers on ACA Marketplaces decide which geographic markets to enter,
how to design their plans, and how to price them. In this paper we are interested in how the
targeting of subsidies to lower-income consumers may affect equilibrium prices, conditional
on entry and contract design decisions; hence, we keep insurers’ entry and product design
fixed. To fix ideas, we first start with a brief accounting of payment flows in the market.
For each consumer i, plan j collects premium pij from the consumer. For consumers who
are not eligible for premium subsidies, this premium is equal to the full list price, bij .23 For
consumers who are eligible for subsidies, the insurer collects pij < bij from the consumer and
a subsidy from the federal government. Together, the consumer premium and the subsidy
add up to bij .24 On the expenditure side, the insurer pays for consumers’ healthcare bills
and any administrative costs. Let the total expected healthcare spending of consumer i in
plan j be hij . In general, this spending is a function of a consumer’s underlying health risk,
ri , and the plan’s contract features, φj .
Plan j’s expected cost for consumer i is usually not equal to hij . Instead, the plan expects
to pay a portion of hij , net of consumer cost-sharing in the form of deductibles, co-pays, and
co-insurance. Consumer cost-sharing, in turn, is either paid directly by the enrollee or can
be paid by the government in the form of cost-sharing subsidies. Let cij (ri , φj ) ≤ hij denote
the plan’s expected cost for offering insurance coverage to individual i. Plan j’s expected
profit from enrolling consumer i is then:
πij = bij − cij (ri , φj ). (19)
There are several features of the environment that allow us to simplify this very gen-
eral formulation. On the revenue side, recall that plans are not allowed to perfectly price-
discriminate across consumers. Insurers can collect higher premiums from older consumers;
23
Recall that the list price of plan j is the same in all markets t where plan j is offered and that fall
into the same rating area. If a consumer is eligible for subsides, then the price that consumers pay for j in
two different counties may differ, since subsidies depend on the prices of other plans in the same market.
Consumers not eligible for subsidies pay the same price for j in all markets.
24
If the subsidy is higher than the list price, the consumer pays zero and does not receive the cash value
of the “unused” subsidy. In addition to premiums, insurers may receive revenue from three risk-equalization
programs run by the federal government or the states that aim to reduce the ex post volatility in realized
profits from unexpectedly high or low healthcare spending realizations.
19however, this age-based underwriting is regulated—insurers set the base rate for a 20 year
old consumer and then have to follow a pre-specified regulatory age curve. This regulatory
restriction implies that revenue does not vary across consumers of age a and can be written
as a product of the baseline list price for a 20 year old consumer bj and a set of regulatory
age-specific multipliers τ a that do not vary across plans, i.e. bij = τ a(i) bj .
On the cost side, we parametrize cij to make the problem empirically tractable. We
preserve the idea that costs may vary across consumers, which is important for allowing risk
sorting to exist in this insurance market, but we discretize this variation. Using a commercial
claims database from Optum, we start by estimating how much average healthcare spending
varies across individuals with age and income in the general population. We fit smooth
functions of healthcare costs in age for three levels of income (see Section B in the Appendix
for details). Three income levels correspond to the income brackets that were defined for
demand estimation. These estimates recover a matrix of age-income cost multipliers κd . Now
suppose that each plan has a plan-specific baseline cost cj —the cost that plan j expects to
incur for a 20 year old consumer in the lowest income bracket. This cost may vary across
plans due to differences in benefit design and negotiated prices with providers. We make a
simplifying assumption that income-age cost multipliers do not vary across plans. In other
words, we assume that in expectation enrolling a 20 year old versus a 40 year old in the
lowest income bracket is κ40 times more expensive for any plan. Under this assumption, cij
can be written as a product of the baseline cost cj and the age-income cost multiplier κd that
does not vary across plans, i.e. cij = κd(i) cj . Allowing demand and cost to both vary by age
and income allows for adverse or advantageous selection in our model, as cost systematically
varies with willingness to pay.
With this additional structure, we can re-write the profit equation for firm f offering
plan portfolio Ff as:
X X
(bj τ d − cj κd )sdj (p(b))M d ,
Πf (b) = (20)
j∈Ff d∈D
where sdj (p(b)) is the share of consumers in age-income group d that buys plan j among all
consumers in this age-income group M d , p(b) is the link function between the out-of-pocket
price that a consumer pays and the firm’s list price (Equation 15 above), τ d = τ a for any
income level, bj is the baseline list premium for a 20 year old that does not vary with income,
and cj is the baseline cost for a 20 year old consumer in the lowest-income bracket.25
25
The share equation is defined over all markets for which the plan is offered (i.e. its rating area). For
20First-order conditions Each insurer f chooses a vector of baseline list prices to maximize
profits; subject to the MLR constraint, for each plan j, the optimal list price bj satisfies the
following first-order condition:
X X d
∂πf (b) d d ∂sk (p(b)) d d d d
= (bk τ − ck κ ) M + 1(j = k) · τ sj (p(b))M = 0. (21)
∂bj k∈F d∈D
∂b j
f
The first-order condition highlights how the theoretical demographic externality mechanism
discussed in Section 2 enters our empirical model. Note that while the firm sets on baseline
list price bj , it is maximizing the sum of marginal profits with respect to bj across all age-
income groups d. This implies that if one consumer group d is affected by a targeted subsidy
that changes its elasticity of demand, this will affect the list price not only for this group
of consumers, but for all other demographic groups d. This interdependence of demands in
the firms’ profit function gives rise to the subsidy-induced demographic externality in our
empirical model.
As in Nevo (2001), the first-order conditions can be written in the vector form:
S − Ω(B − C) = 0, (22)
where row j of vector S is given by Sj = d τ d sdj (p(b))M d and row j of vector (B − C) is
P
given by (B − C)j = d (bj τ d − cj κd ), while row k, column j of matrix Ω is:
P
X ∂sdj (p(b))
Ωkj = − Md (23)
d
∂bk
for plans k and j offered by firm f . This expression is useful as one can invert Equation 22
to obtain the baseline marginal cost cj for each plan as a function of observed equilibrium
prices and the elasticity of demand that is given by the demand parameters from Section 4.1.
We constrain our estimates of marginal cost to conform to the MLR restriction described
above.26
Subsidies enter the first-order condition in two ways. One, they directly change the share
equation s(p(b)) by changing out-of-pocket prices faced by a subset of consumers. Second,
∂sd (p(b))
they also change the derivative of the market share with respect to price: j∂bd . This
k
expositional clarity, we do not write out this dependence explicitly, but we do account for this in our empirical
estimation and counterfactual simulations.
26
As marginal cost is additively separable in the first-order conditions, one can invert all marginal costs
and impose the MLR without having to adjust the other non-binding marginal costs.
21You can also read