Nutrition Education and Obesity Prevention in Los Angeles County
←
→
Page content transcription
If your browser does not render page correctly, please read the page content below
Nutrition Education and
Obesity Prevention in Los
Angeles County

Final Report for the Evaluation of the Local
Supplemental Nutrition Assistance Program
Education (SNAP-Ed) Efforts

Prepared for:

Los Angeles County Department of Public Health, Division of
Chronic Disease and Injury Prevention

January 2018

 1
Nutrition Education and
Obesity Prevention in Los
Angeles County
Final Report for the Evaluation of the Local
Supplemental Nutrition Assistance Program
Education (SNAP-Ed) Efforts
Susan H. Babey, Christopher Lee, Ying-Ying Meng, Xiao Chen, Gerald Kominski,
Nadereh Pourat

UCLA Center for Health Policy Research

January 2018

ACKNOWLEDGEMENTS
This report was supported in part by a contract from the Los Angeles County Department of Public
Health (No. PH 002796 W-1) to the UCLA Center for Health Policy Research. The analysis, interpretation,
and conclusions contained within this report are the sole responsibility of the authors.
The authors thank the LA Team at the Los Angeles County Department of Public Health for their
guidance and contributions to this report. The LA Team comprises the Division of Chronic Disease and
Injury Prevention’s Special Projects Unit (Jack Thompson, MPH, JD, Katherine Sutton, MPH), the
Nutrition and Physical Activity Program (Dipa Shah-Patel, MPH, RD), and Office of the Associate Director
(Tony Kuo, MD, MSHS). The authors also thank May Wang, DrPH, for her guidance on Agent-Based
Modeling.

Suggested Citation:
Susan H. Babey, Christopher Lee, Ying-Ying Meng, Xiao Chen, Gerald Kominski, Nadereh Pourat. Nutrition
Education and Obesity Prevention in Los Angeles County. Final Report for the Evaluation of the Local Supplemental
Nutrition Assistance Program Education (SNAP-Ed) Efforts. Los Angeles, CA: UCLA Center for Health Policy
Research, January 2018.

 2
Contents
Executive Summary......................................................................................................................... 7
 Local Efforts in Nutrition Education and Obesity Prevention in Los Angeles County ................ 7
 Evaluation Approach ................................................................................................................... 7
 Key Findings ................................................................................................................................ 8
 Conclusions and Implications...................................................................................................... 8
Table of Acronyms ........................................................................................................................ 10
Supplemental Nutrition Assistance Program Education (SNAP-Ed): Context and Overview ....... 11
 Obesity Prevalence and Trends in the U.S., California, and Los Angeles County ..................... 11
 Variation by Race/ethnicity .............................................................................................. 12
 Variation by Income .......................................................................................................... 13
 Access to Healthy Food Options ....................................................................................... 13
 Overview of SNAP-Ed Intervention Efforts ............................................................................... 14
 Nutrition Education........................................................................................................... 14
 Farmers’ Markets .............................................................................................................. 14
 Healthy Retail .................................................................................................................... 15
 Community Gardens ......................................................................................................... 16
 Food and Beverage Standards .......................................................................................... 16
SNAP-Ed Evaluation Approach ...................................................................................................... 17
 Methodology to Assess SNAP-Ed Impact .................................................................................. 17
 Progress Indicators.................................................................................................................... 18
 Agent-Based Modeling Approach ............................................................................................. 18
 Overview of Models .......................................................................................................... 19
 Data Source ....................................................................................................................... 21
 Analyses ............................................................................................................................ 22
 Probability for Participating in a SNAP-Ed Intervention ................................................... 23
SNAP-Ed Implementation ............................................................................................................. 25
 Prevalence of Health Conditions and Burden of Obesity in Los Angeles County Service
 Planning Areas .......................................................................................................................... 25
 SNAP Eligibility and Poverty Rates .................................................................................... 25
 Health Conditions ............................................................................................................. 26
 SNAP-Ed Implementation in SPA 4 and SPA 6 .......................................................................... 28
 Implementation of Policy, Systems, and Environmental (PSE) Change Strategies .................. 29
 Farmers’ Markets .............................................................................................................. 30
 Community or “Edible” Gardens ...................................................................................... 30
 Healthy Food and Beverage Standards ............................................................................. 31
 Healthy Retail .................................................................................................................... 31
 Nutrition Education Services .................................................................................................... 33
 Potential Reach Estimates ........................................................................................................ 36
 3

SNAP-Ed Impact on Obesity and Costs ......................................................................................... 37
 SNAP-Ed Estimated Exposure Rates Over Time ........................................................................ 37
 Estimated Changes in Health Behaviors and Weight ............................................................... 40
 Estimated Changes in Obesity Rates Over Time ....................................................................... 43
 Return on Investment ............................................................................................................... 44
Conclusions and Implications........................................................................................................ 47
Appendix : Detailed Methodology ................................................................................................ 49
 Population Health Indicators by SPA ........................................................................................ 49
 Data Source ....................................................................................................................... 49
 Analyses ............................................................................................................................ 49
 Agent-Based Modeling.............................................................................................................. 50
 Data Source ....................................................................................................................... 50
 Analyses ............................................................................................................................ 50
References .................................................................................................................................... 64

 4

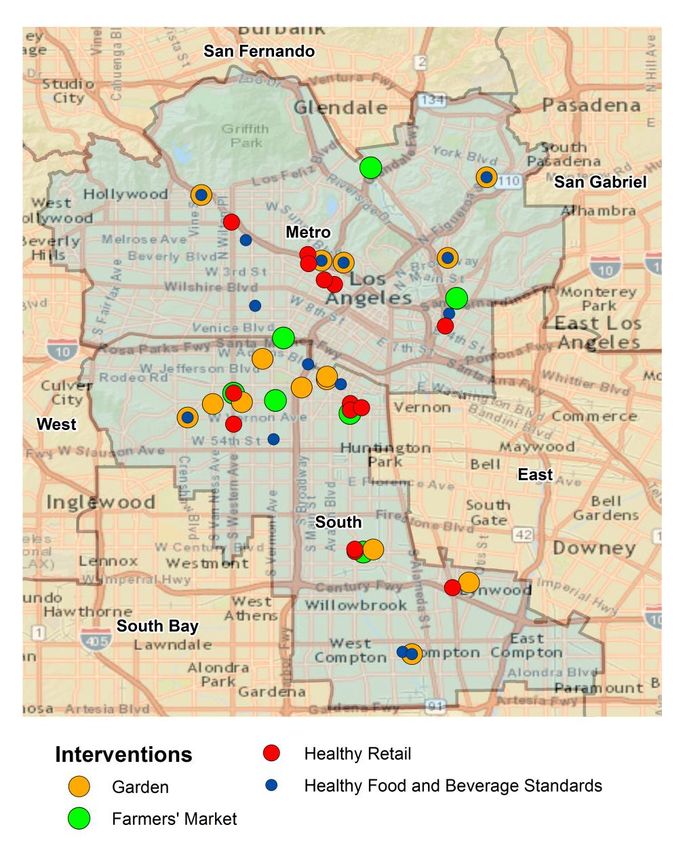
List of Exhibits
Exhibit 1. Prevalence of Obesity in Los Angeles County and California, Adults age 18 and over,
2001-2014 ..................................................................................................................................... 12
Exhibit 2 Prevalence of Obesity by Race and Ethnicity, Adults age 18 and over, Los Angeles
County and California, 2013-14 .................................................................................................... 13
Exhibit 3. Prevalence of Obesity by Income as Percent of Federal Poverty Level, Adults age 18
and over, Los Angeles County and California, 2013-14 ................................................................ 14
Exhibit 4. Causal Pathway for the Agent-Based Model ................................................................ 19
Exhibit 5. General Approach Utilized for the SNAP-Ed Agent-Based Model ................................ 20
Exhibit 6. Interaction of Family Network and Social Network with Interventions ....................... 22
Exhibit 7. Percent Eligible for SNAP and Percent Below the Federal Poverty Line, Adults age 18
and over, Los Angeles County, California, 2013-14 ...................................................................... 25
Exhibit 8. SNAP status by Service Planning Area (SPA), Adults age 18 and over, Los Angeles
County, California, 2013-14 .......................................................................................................... 26
Exhibit 9. Health Outcomes by Service Planning Area (SPA), Adults age 18 and over, Los Angeles
County, California, 2013-14 .......................................................................................................... 27
Exhibit 10. Health-related Behaviors by Service Planning Area (SPA), Adults age 18 and over, Los
Angeles County, California, 2013-14............................................................................................. 27
Exhibit 11. SNAP-Ed PSE Intervention Sites in SPA 4 (Metro) and SPA 6 (South), Los Angeles
County ........................................................................................................................................... 29
Exhibit 12. SNAP-Ed Policy, Systems, and Environmental (PSE) Change Strategies Implemented
in SPA 4 and SPA 6 ........................................................................................................................ 32
Exhibit 13. Nutrition Education Programs Implemented in SPA 4 and SPA 6 .............................. 34
Exhibit 14. Potential Reach Estimates for SPA 4 ........................................................................... 36
Exhibit 15. Potential Reach Estimates for SPA 6 ........................................................................... 36
Exhibit 16. Average Overall Estimated Rate of Exposure by Intervention, SPA 4 ........................ 38
Exhibit 17. Average Estimated Rate of Exposure by Intervention Over Time, SPA 4, 2015-2040 38
Exhibit 18. Average Overall Estimated Rate of Exposure by Intervention, SPA 6 ........................ 39
Exhibit 19. Average Estimated Rate of Exposure by Intervention Over Time, SPA 6, 2015-2040 40
Exhibit 20. Average Annual Behavior and Bodyweight Estimated Changes in SPA 4 ................... 41
Exhibit 21. Average Annual Behavior and Body Weight Estimated Changes, SPA 6 .................... 42
Exhibit 22. Estimated Cohort Obesity Rates in SPA 4, Intervention vs. Control Scenario ............ 43
Exhibit 23. Estimated Cohort Obesity Rates in SPA 6, Intervention vs. Control Scenario ............ 43
Exhibit 24. Return of Investment for SNAP-Ed Strategy Interventions in SPA 4 and SPA 6, 2015-
2040 .............................................................................................................................................. 46
Exhibit 25. CHIS Adult Sample Size by Service Planning Area (SPA), Adults age 18 and over, Los
Angeles County, 2001-2014 .......................................................................................................... 50
Exhibit 26. Illustration of Population Cohort Included in Agent-Based Model ............................ 51

 5
Exhibit 27. Illustration of Population Cohort in ABM and Population Included in Re-analysis of
Entire Adult Population................................................................................................................. 51
Exhibit 28. Parameter Page for the SNAP-Ed Agent-Based Model ............................................... 53
Exhibit 29.Intervention State-Based Models for the SNAP-Ed Agent-Based Model .................... 54
Exhibit 30. Illustration of Logistic Growth Curves Used to Model Behavior Change ................... 58
Exhibit 31. Effect Sizes Used for Each Parameter in the SNAP-Ed Agent-Based Model ............... 59

 6
Executive Summary
Nutrition Education and Obesity Prevention in Los
Angeles County: The Local Supplemental Nutrition
Assistance Program Education (SNAP-Ed) Efforts
The Los Angeles County Department of Public Health (LACDPH), Division of Chronic Disease and
Injury Prevention receives United States Department of Agriculture (USDA) funding through the
California Department of Public Health to implement the Supplemental Nutrition Assistance
Program Education (SNAP-Ed) project in Los Angeles County. SNAP-Ed, formerly known as the
Nutrition Education and Obesity Prevention (NEOP) program, supports strategies that promote
healthy eating, active living, and healthy and safe environments. Alongside traditional nutrition
education services, recent SNAP-Ed efforts have sought to identify complementary ways to
improve health, through policy, systems, and environmental (PSE) change strategies that
promote healthy behaviors among adults and children who have limited access to nutritious
foods. Interventions are tailored to these strategies with the intent to empower and enable
underserved residents with limited resources to select healthy foods and beverages, and to
increase their physical activity levels.

Evaluation Approach
SNAP-Ed involves the implementation of traditional nutrition education services and a series of
policy, systems, and environmental (PSE) change strategies. These PSE strategies are achieved
through community-based interventions that were implemented in Los Angeles County during
the Federal Fiscal Year 2014-2016 grant cycle. They include: establishing childcare policies,
implementing school wellness policies, entering into shared use agreements, creating healthy
retail or restaurant environments, building community gardens, establishing farmers’ markets,
developing healthy worksite programs, creating structured physical activity programs,
promoting active transportation, and establishing healthy food and beverage standards in large
food venues. In the present program evaluation, five strategies were examined: nutrition
education, farmers’ markets, healthy retail, community gardens, and healthy food and
beverage standards. LACDPH contracted with the UCLA Center for Health Policy Research
(CHPR) to conduct this evaluation. The evaluation assessment focuses on two of the high needs
Service Planning Areas (SPAs) in Los Angeles County, SPA 4 and SPA 6. It addresses the following
questions:

 1. What is the prevalence of chronic health conditions, including obesity and related health
 behaviors in Los Angeles County by SPA, especially in the two selected high needs areas?
 Executive Summary 7
2. What are the size, scope, investment and estimated reach of the SNAP-Ed strategies implemented to date in SPA 4 and SPA 6? 3. What is the estimated impact of these strategies in SPAs 4 and 6 if they were sustained over the next 25 years? 4. What, if any, economic gains are expected from the investment in these strategies in SPA 4 and SPA 6? To answer these questions, CHPR analyzed population-based survey data, synthesized program data provided by LACDPH, developed agent-based models (ABM) to simulate impacts, and conducted a return of investment analysis of SNAP-Ed. CHPR’s final report to LACDPH describes the methods and results of these analyses. Key Findings In overall county comparisons, the prevalence of obesity is highest in SPA 6 where 40% of adults are obese, as compared to the lowest prevalence in SPA 5 (18% of adults are obese). SPAs 4 and 6 have the highest poverty rates in Los Angeles County (both around 28 percent) as well as the highest rates of SNAP eligibility (46 and 51 percent, respectively). One hundred eight sites in SPAs 4 and 6 provided direct nutrition education services, reaching more than 12,000 program participants. A total of seven farmers’ markets implemented farmers’ market strategies in SPAs 4 and 6. Healthy corner store makeovers were implemented at 18 stores in the two SPAs (4 and 6). Seventeen community gardens were developed in SPAs 4 and 6. Healthy food and beverage standards were established at 23 organizations in SPAs 4 and 6 In SPA 4, the estimated prevalence of obesity in 2040 is 50% in the control scenario, as compared to 45% in the SNAP-Ed intervention scenario. In SPA 6, the estimated prevalence of obesity in 2040 is 58% in the control scenario, as compared to 54% in the SNAP-Ed intervention scenario. Cost analyses estimate a return on investment (ROI) of 29.75 for strategy interventions implemented in SPA 4 and 8.37 for strategy interventions implemented in SPA 6. Conclusions and Implications The SNAP-Ed project in Los Angeles County has the overarching goal of reducing obesity and other diet-related chronic diseases among Supplemental Nutrition Assistance Program (SNAP) participants and SNAP-eligible populations. The ABM results suggest that the SNAP-Ed strategy interventions that were examined would result in lower rates of obesity by 2040 relative to the control scenarios in which these strategy interventions were not implemented. Specifically, the estimated prevalence of obesity in 2040 for the two high needs, low-income areas of Los Angeles County (SPAs 4 and 6) was 50% and 58%, respectively, in the control scenarios, but Executive Summary 8
were 45% and 54%, respectively, in the SNAP-Ed intervention scenarios. These results also
suggest that the interventions implemented in SPAs 4 and 6 would result in savings relative to
program costs. Combined with traditional evaluation methods, ABM was used in these
analyses. In general, ABM provides a useful tool for understanding interactions and outcomes
of these multi-faceted interventions within complex dynamic systems. Estimating impacts of
these complex interventions, especially over the long term, is an important endeavor and can
help inform existing and future prevention program planning and investments.

 Executive Summary 9
Table of Acronyms
ABM – Agent-Based Model
CDPH – California Department of Public Health
CHIS – California Health Interview Survey
FPL – Federal Poverty Level
LACDPH – Los Angeles County Department of Public Health
PSE – Policy, Systems, and Environmental Change(s)
SNAP – Supplemental Nutrition Assistance Program
SNAP-Ed – Supplemental Nutrition Assistance Program Education
SPA – Service Planning Area
USDA – United States Department of Agriculture

 Table of Acronyms 10
Supplemental Nutrition Assistance
Program Education (SNAP-Ed): Context
and Overview
In response to the national obesity epidemic and its broad impact on population health and
health care expenditures, the Los Angeles County Department of Public Health (LACDPH),
Division of Chronic Disease and Injury Prevention received USDA funding through the California
Department of Public Health to support the Supplemental Nutrition Assistance Program
Education (SNAP-Ed) project in Los Angeles County. SNAP-Ed supports local partners to
implement strategies that promote healthy eating, active living, and healthy and safe
environments. Alongside traditional nutrition education services, recent SNAP-Ed efforts have
sought to identify complementary ways to improve health, through policy, systems, and
environmental (PSE) change strategies that promote healthy behaviors among adults and
children who have limited access to nutritious foods. Interventions are tailored to these
strategies with the intent to empower and enable underserved residents with limited resources
to select healthy foods and beverages, and to increase their physical activity levels.

Obesity Prevalence and Trends in the U.S., California, and
Los Angeles County
Over the past 30 years, obesity prevalence among both adults and youth in the United States
has increased significantly.1 In the 1970s, approximately 15 percent of adults were obese; by
2004, the rate had increased to 32 percent.1 Although the prevalence of obesity among youth is
lower than among adults, children and adolescents have experienced considerably larger
increases in obesity prevalence. Between the early 1970s and 2003-2004, the prevalence of
obesity nearly tripled among youth ages 12 to 19, from 6 percent to 17 percent, and more than
quadrupled among children ages 6 to 11, rising from 4 percent to 19 percent. 1-4 Nationally, the
prevalence of obesity among adults and youth has not changed significantly since 2004, but
rates remain high.5 The most recent data from the National Health and Nutrition Examination
Survey indicated that among adults, approximately 38 percent were obese in 2013-14. Among
youth, 18 percent of those ages 6 to 11 were obese in 2013-14, as were 21 percent of those
ages 12 to 19.

Obesity is a significant risk factor for serious health conditions, including type 2 diabetes, heart
disease, stroke, and some cancers. In addition to increasing the risk for serious health
conditions, obesity is costly. In 2008, the Centers for Disease Control and Prevention estimated

 Supplemental Nutrition Assistance Program Education (SNAP-Ed): Context and Overview 11
the annual medical costs of obesity in the United States at $147 billion.6 In California alone,
overweight and obesity are estimated to cost more than $21 billion each year.7

In California, the prevalence of obesity among adults increased by more than 34 percent
between 2001 and 2014 (

Exhibit 1). In 2013-14, more than one quarter of adults (26 percent) were obese, significantly
higher than in 2001 (19 percent). A similar pattern is seen in Los Angeles County, where 26
percent of adults were obese in 2013-14 compared to one-fifth of adults (20 percent) in 2001.

Exhibit 1. Prevalence of Obesity in Los Angeles County and California, Adults age 18 and over,
2001-2014
 30%

 25%

 20%

 15%

 10%

 5%

 0%
 2001 2003 2005 2007 2009 2011 2013
 Year
 Los Angeles County California

Source: California Health Interview Survey, 2001-2014.

Variation by Race/ethnicity
Nationally, obesity disproportionately affects African Americans and Latinos.8 Among California
adults, the prevalence of obesity was higher among American Indians, African Americans, and
Latinos than among whites, and the prevalence was lower among Asians than whites (Exhibit
2). Similar disparities are observed in Los Angeles County. Specifically, African-American and
Latino adults had higher obesity prevalence than white adults.

 Supplemental Nutrition Assistance Program Education (SNAP-Ed): Context and Overview 12
Exhibit 2 Prevalence of Obesity by Race and Ethnicity, Adults age 18 and over, Los Angeles
County and California, 2013-14

 44%
 Los Angeles County California

 40% 40%
 36%
 34%
 32%

 23%
 20% 21%

 10% 11%
 * * *

 Latino White African AIAN Asian NHOPI Two or More
 American Races
Source: 2013-14 California Health Interview Survey.
Note: * Indicates the estimate was not statistically reliable. AIAN refers to American Indian or Alaska Native. NHOPI
refers to Native Hawaiian or Pacific Islander.

Variation by Income
Obesity disproportionately affects California’s poorest individuals. Adults living below 100% FPL
had a higher prevalence of obesity (31 percent) than their higher income counterparts (21
percent). A similar pattern is seen in Los Angeles County (Exhibit 3).

Access to Healthy Food Options
Some of these disparities in obesity may be related to differences in the availability of healthy
food options in the neighborhood.9 Poor dietary behaviors are associated with higher rates of
obesity, and a number of research studies have found that access to healthy food options is
associated with healthier eating behaviors.10-16 For example, studies have found that the
presence of supermarkets, grocery stores, and produce markets is associated with greater
consumption of fresh fruits and vegetables.13,16 Research has also shown that availability of
farmer’s markets is positively associated with consumption of fruits and vegetables.15
Moreover, availability of stores that regularly offer fresh produce varies with neighborhood
income and racial/ethnic composition.17-19 Research suggests that residents of low-income
neighborhoods or those living in communities of color have fewer options for purchasing
healthy foods.17-19 These findings suggest that residents of low-income neighborhoods may be
at greater risk for obesity in part because they lack access to healthier food options.

 Supplemental Nutrition Assistance Program Education (SNAP-Ed): Context and Overview 13
Exhibit 3. Prevalence of Obesity by Income as Percent of Federal Poverty Level, Adults age 18
and over, Los Angeles County and California, 2013-14

 Los Angeles County California
 30% 31%
 29% 29%
 28%
 26%

 21% 21%

 0-99% FPL 100-199% FPL 200-399% FPL 400% FPL and above

Source: 2013-14 California Health Interview Survey.
Note: Income is presented as percent of Federal Poverty Level (FPL).

Overview of SNAP-Ed Strategy Intervention Efforts
Nutrition Education
LACDPH has implemented community-based Nutrition Education with the goal of improving
food and physical activity choices by delivering evidence-based nutrition education to
participants where they live, learn, work, play, pray and shop.20 LACDPH partners with schools,
public agencies, faith-based and community organizations, and grocery stores to provide
effective obesity prevention programming. Educating community members about new health
resources, including new access points to healthy foods, is an important step in establishing
sustainability. In addition to increasing awareness about new resources, formal education
about how to prepare a healthy meal and the importance of eating healthy foods can increase
the likelihood of changing eating habits.21-23 Research suggests that class-based nutrition
education can be a cost-effective means of increasing consumption of fresh fruits and
vegetables,22,24 and that these types of community-based education interventions can be
effective among low-income populations.24,25

Farmers’ Markets
The USDA defines a farmers’ market as a space where at least two farmer-producers “sell their
own agricultural products directly to the general public at a fixed location, which includes fruits
and vegetables, meat, fish, poultry, dairy products, and grains”.26 In the U.S., there has been a
383% increase in farmers’ markets from 1994 to 2015, primarily concentrated in densely
 Supplemental Nutrition Assistance Program Education (SNAP-Ed): Context and Overview 14
populated areas of the country.27 Farmers’ markets have been shown to increase access to
fresh fruits and vegetables, as well as to increase the purchase28 and consumption29 of fresh
fruits and vegetables. People who participate in incentive programs designed to help defray
costs of produce for low-income shoppers are more likely to increase fruit and vegetable
consumption and are more likely to return to a farmers’ market.28,30

The focus of SNAP-Ed farmers’ market strategies in Los Angeles County is threefold: 1) establish
new Certified Farmers’ Markets or produce stands, 2) actively promote and accept electronic
benefit transfer (EBT)/Women, Infants, Children (WIC) food and nutrition service, and 3) offer a
Market Match healthy food incentive. While the acceptance of EBT is becoming more
widespread with new policies at the state, county, and city levels, fresh fruits and vegetables
can often still be cost prohibitive at farmers’ markets. Market Match is a program that
incentivizes the purchase of fresh fruits and vegetables by offering matching funds to EBT users
at a farmers’ market. This effectively doubles the purchasing power of low income shoppers,
allowing them both physical and financial access to locally produced fresh produce.

Healthy Retail
The SNAP-Ed strategies portfolio also includes healthy retail interventions. These interventions
entail improving the availability of healthy foods sold as well as signage promoting healthy
options at traditional corner stores and supermarkets in underserved areas. Transforming
traditional corner stores and supermarkets into healthy retailers typically involves three steps:
1) increasing access to fresh fruits and vegetable, 2) training store owners on the purchase,
storage, maintenance, and sale of fresh fruits and vegetables, and 3) introducing new
marketing to educate consumers about healthier options such as fresh fruit instead of candy, or
water instead of sugar sweetened beverages. These interventions, often called corner store
conversions or market makeovers, can be as simple as the introduction of less perishable fresh
fruits and vegetables such as onions, garlic, bananas, and apples, or as elaborate as a total store
transformation including the addition of new refrigeration for fresh fruits and vegetables, and
the rearranging of unhealthy items as a focal point of the store. Corner store conversions are an
intervention born from the observation that there is a lack of full-service grocery stores in many
low income, urban communities. Transforming corner stores into healthy retailers provides an
opportunity to improve the food environment while leveraging existing resources in a
community.

Most people shopping at corner stores purchase beverages or snacks, making these two items
the most likely to impact health behaviors.31 Although corner store conversions are a relatively
new intervention, there is some evidence that they can change the health behaviors of people
shopping at the stores. For example, small store interventions lead to increased sales of healthy
food items and greater availability of fruits and vegetables in small neighborhood stores is
associated with higher consumption of fruits and vegetables.32-34 In addition, research suggests
that in-store marketing strategies including availability, price, placement and promotion can
increase purchase and consumption of healthy items including fruits and vegetables. 35

 Supplemental Nutrition Assistance Program Education (SNAP-Ed): Context and Overview 15
Community Gardens
Another strategy employed as part of SNAP-Ed is identifying and providing opportunities to
develop and sustain edible gardens in schools and communities. An edible garden is a parcel of
land where a group of people grows plants for food. These garden interventions can include
shared, individual, or mixed plots. The land can be privately or publicly owned and is often
leased to a group of gardeners. Edible gardens can range greatly in size and scale. Often edible
gardens exist for a defined group of people (defined through membership, living in an
affordable housing complex, etc.), but some edible gardens are planted in public spaces such as
city owned parks.

There is limited research evaluating the impact of community gardens on nutrition-related
outcomes.36 However, a handful of studies suggest that community gardens may impact
consumption of fresh fruits and vegetables.37-39 For example, participation in a community
garden is associated with higher fresh fruit and vegetable consumption,38,40 including in one
study among low-income Californians.39 Furthermore, other adults living in the same household
as a community garden participant are likely to consume more fresh fruits and vegetables than
adults who are not living with a community gardener.37 Community (“edible”) gardens also
provide a space and opportunity for nutrition and gardening education.

Food and Beverage Standards
The final strategy examined in this report is the use of healthy food and beverage standards.
This strategy involves promoting standards within public housing units, city parks and
recreation facilities, vending machines, and Los Angeles County department facilities. Creating
healthy food and beverage standards or policies in workplaces and other gathering locations
such as faith-based organizations can help increase access to healthy options and shape
behavior and choices about nutrition. Research suggests that establishment of healthy food and
beverage standards in schools are associated with greater availability of healthy food options
and better dietary behaviors.41 In addition, healthy food procurement policies in worksites,
health care settings and government organizations are usually effective interventions for
increasing availability of healthy food options and decreasing availability of unhealthy options. 42

 Supplemental Nutrition Assistance Program Education (SNAP-Ed): Context and Overview 16
SNAP-Ed Evaluation Approach
LACDPH contracted with the UCLA Center for Health Policy Research (CHPR) to conduct an
evaluation of specific components of the SNAP-Ed program. The evaluation focuses in particular
on two Service Planning Areas (SPAs) in Los Angeles County, SPA 4 and SPA 6. The evaluation
addresses the following questions:

 1. What is the prevalence of chronic health conditions, including obesity and related health
 behaviors in Los Angeles County by SPA, especially in the two selected high needs areas?
 2. What are the size, scope, investment, and estimated reach of the SNAP-Ed strategies
 implemented to date in SPA 4 and SPA 6?
 3. What is the estimated impact of these strategies in SPAs 4 and 6 if they were sustained
 over the next 25 years?
 4. What, if any, economic gains are expected from the investment in these strategies in
 SPA 4 and SPA 6?

Methodology to Assess SNAP-Ed Impact
As a first step in assessing the impact of SNAP-Ed strategy interventions, we synthesized
program data provided by LACDPH to describe progress indicators for the nutrition education
services and four of the PSE strategies (farmers’ markets, healthy retail, community gardens,
and healthy food and beverage standards) implemented as part of SNAP-Ed in SPA 4 and SPA 6.
These progress indicators include the size, scope, investments and estimated reach of these
services and strategy interventions.

To estimate the potential population health impact of the SNAP-Ed strategy interventions that
are implemented in Los Angeles County in SPA 4 and SPA 6, we use agent-based modeling
(ABM) to simulate scenarios about the lasting effects of the strategy interventions singularly
and in combination. ABM has been widely used in different research and evaluation fields
including health care policy research. This method allows evaluators to model the interaction of
individuals with their environments and provides a platform to integrate information from
multiple sources in one model to simulate the effects of individuals’ interactions with their
environments on outcomes. The approach serves as an effective means for evaluating various
strategy interventions based on the specific implementation factors within each target area.

Finally, to assess whether the Los Angeles County SNAP-Ed project would likely result in
economic gains over the long-term, we conduct a return on investment analysis. This analysis
draws on LACDPH program data covering investments made in each SPA along with the results
estimating the prevalence of obesity from the ABM. A more detailed description of the
methods and data sources are provided in the Appendix.
 SNAP-Ed Evaluation Approach 17
Progress Indicators
The strategy interventions examined in this evaluation have the potential to reach the existing
SNAP-eligible population living nearby. For instance, the opening of a new farmer’s market may
attract people to shop there. However, program data do not tell us how many of the program
participants were SNAP-eligible. This information should be estimated. We estimated potential
reach (beyond SNAP recipients) based on geographic proximity to the programs and
interventions. Based on the CDC recommendations of DCH programs: An Introduction to
Estimating Reach, a buffer was drawn around the location of each intervention: farmers'
market has a 5 mile buffer, all other interventions have 1 mile buffer.43 We used the estimated
SNAP-eligible population within the buffer as the numerator and the total estimated SNAP-
eligible population within the SPA as the denominator provided by the Los Angeles Department
of Public Health. Thus, the potential reach for a healthy retail intervention in SPA 4 was
calculated as the estimated number of SNAP-eligible within a 1 mile buffer of the retail location
divided by the estimated total number of SNAP-eligible in SPA 4.

Agent-Based Modeling Approach
Public health issues like the obesity epidemic are the result of complex, multifaceted processes
in which environmental and biological factors interact and create feedback to one another. One
simple example of these dynamic interactions is how a community’s consumption of fresh fruits
and vegetables is both influenced by the availability of such food and a factor in determining its
availability, as retailers tend to stock the products that sell best. Traditional regression-based
analyses have difficulty in adequately accounting for problems that involve several dynamic
interactions. In addition, the lack of available data on the impact of specific health interventions
on health behaviors and health outcomes over time make it even more difficult to evaluate
using traditional regression-based modeling. Because of these methodological and data issues,
this evaluation uses computational modeling to simulate the impact of health behavior
interventions on the prevalence of adult obesity. ABM in particular is used in order to allow
persons - represented as agents - to operate autonomously in the model.

ABM allows evaluators to integrate information from multiple sources into one model that
simulates the effect of individuals’ interactions with their environments on outcomes. In this
way, ABM may be able to more accurately illustrate the complexities of real world problems
that are bi-directionally influenced by social, environmental and biological factors. It provides a
conceptualization of the real world with an intervention in place as well as the counter-factual
scenario without intervention. In particular, for evaluating the effect of SNAP-Ed, the ABM
developed here attempts to simulate the impact of the interventions through their effect on
health-related behaviors, which in turn affect body weight, which in turn leads to a change in
the prevalence of obesity (Exhibit 4).

 SNAP-Ed Evaluation Approach 18
Exhibit 4. Causal Pathway for the Agent-Based Model

Overview of Models
The models developed for this evaluation examine five strategy interventions that have been
implemented as part of SNAP-Ed in Los Angeles County: nutrition education, farmer’s markets,
healthy retail, community gardens, and healthy food and beverage standards. This analysis
focused on two geographical areas within the county, SPA 4 and SPA 6. These two SPAs have
high rates of poverty, SNAP eligibility, and obesity, and as a result, there has been a high level
of investment to address the high obesity rates in these areas. We developed a model intended
to simulate the effects of each intervention in isolation or in combination. Exhibit 5 displays the
general approach used in the ABM developed for this project. Very broadly, individual residents
of Los Angeles County have a probability of participating in the interventions within their SPA.
Participation in an intervention can lead to change in three health behaviors: consumption of
fruits and vegetables, consumption of sugar-sweetened beverages (SSB), and physical activity.
Changes in these health behaviors lead to changes in weight. Changes in weight are then
reflected in population-level prevalence of obesity. Although separate simulations are
conducted for each SPA, the same underlying models are applied. As both models are identical
except for the population and interventions used, this section covers the standard model
developed for both SPAs.

 SNAP-Ed Evaluation Approach 19
Exhibit 5. General Approach Utilized for the SNAP-Ed Agent-Based Model
 Family or social
 Person 1 network relationships Person 2
 impact participation

 Probability of participating in intervention

 Intervention

 Exposure to intervention leads to changes in health behaviors

 Fruits and Sugary Drinks Physical
 Vegetables Activity

 Changes in health behaviors lead to changes in weight

 Weight

Each arrow in Exhibit 5 represents a parameter in the model that describes the effect. These
parameters provide a platform for evaluators to test different scenarios and different
assumptions. The team performed literature reviews of the available research to estimate
feasible values for these parameters. For example, let’s assume the intervention being modeled
is farmer’s markets. The arrow from the intervention (farmer’s market) to consumption of fresh
fruits and vegetables (FV) representing the effect of the farmer’s market interventions on FV
consumption needs to be operationalized. Whenever possible, these parameters are defined
based on published peer-reviewed literature. However, some of the necessary parameters are
not available in the published literature (e.g., the effect of farmer’s markets on physical
activity). In these cases, parameters are defined based on information available in the gray
literature and consultation with program experts. Parameters that lacked evidence in the
published literature are included as sliders on the model parameter page (described below).
This is done to allow for the adjustment of these parameters as new information becomes
available. The specific parameters used for the model results in this report are shown in the
Appendix.

 SNAP-Ed Evaluation Approach 20
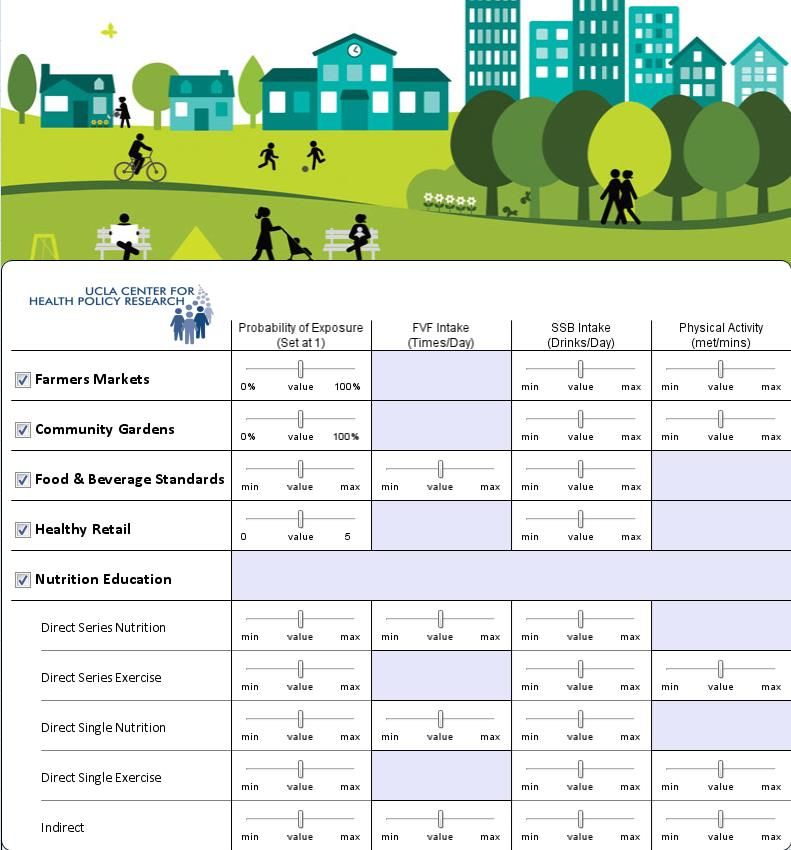
Data Source
A synthetic data set of adults (age >18) was created for each of the two SPAs being modeled,
SPA 4 and SPA 6. The data are at the individual (agent) level and are based on 2012 CHIS public
data, which provides health behavior measures, body weight, height and calculated body mass
index (BMI) as well as demographic variables. We overlaid geographical information on the
individuals to match with 2010 Census block level population data. The sampling weights were
ranked to match with 2015 SPA-specific distributions of key demographic variables, including
race/ethnicity, age, gender, poverty level and population totals. In addition, two social network
structures were created for modeling families and general social connections and interactions.
The family network is generated based on the household size. The social network structure is
generated as a random network overlaying on the participants with an average size of 5
members. Exhibit 6 illustrates these two social networks and how they impact the interaction
of agents with interventions.

 SNAP-Ed Evaluation Approach 21
Exhibit 6. Interaction of Family Network and Social Network with Interventions

CG = Community (“Edible”) Garden Intervention
FM = Farmer’s Market Intervention

Analyses
The ABM simulation model is conducted as a cohort analysis. Adults, ages 18 and older, in 2015
were followed for 25 years from 2015 to 2040. We evaluated a closed population that assumes
persons did not change residency and were only removed from the simulated system upon
death. Population totals for the 2015 adult cohort are calculated at each simulation year and
the final results are reweighted each year to reflect the initial population demographics and
 SNAP-Ed Evaluation Approach 22
population change due to death over time. Population growth is taken into consideration based
on the Los Angeles County population projection provided by the Department of Finance of
California. The annual sampling weight variables were generated to modify the sample so that
it reflects the population for the year. Based on this reconstructed sample, annual population
level obesity rates are calculated and reported in the results. This allows us to infer population-
level effects based on the results of the cohort analysis conducted by the ABM.

Persons - represented as agents - operate in a GIS environment defined by each SPA. On this
level, many person variables are established and updated according to what is around them. At
the agent level, which is unique for each person, the agents move through interventions, gain
and lose exposure to interventions, have changes made to their health behaviors and changes
made to their bodyweight based on their health behavior change. Agents also have model-
defined family and social networks that influence how they interact with the interventions and
how their health behaviors change due to their exposure to the interventions. Variables for
agents are created twice in order to allow two states of the same agent - one set of variables is
modifiable according to the effects of the intervention, and another is not. The second set
serves as a control. These two states allow for the evaluation to use a true counterfactual,
where the only difference between the intervention and control scenario populations is the
presence of the intervention.

Interventions are also operationalized in the model as agents and interact with the person
agents to modify their participation and behavior. However, intervention agents behave
differently than person agents, as their characteristics do not change over time and
intervention agents do not interact with each other, meaning the interaction between
interventions are not modeled explicitly. Each intervention is read into the model as a separate
population of agents with their own unique parameters. Interventions with multiple sites are
represented in the model as separate locations.

Probability for Participating in a SNAP-Ed Intervention
Most of the interventions are location-based. The probability for participating in an
intervention for an individual depends on three factors: 1) distance to the location of the
intervention, 2) if the individual has been exposed to the intervention or the members of the
social networks have been exposed to the intervention, and 3) very importantly, the actual
participation rates data collected by Los Angeles County (see SNAP-Ed Implementation section
for detail). Roughly speaking, the probability for participating in an intervention is inversely
proportional to the distance from the geographic location of the individual to the geographic
location of the intervention and positively correlated with exposure to the intervention.

While participation probabilities are used to expose persons to each intervention, one key
aspect of the models uses participation data to create caps on the number of persons able to
participate in an intervention each year. For example, participation data may indicate that a
retail store had an average of 50 visitors per day during the last week. In order to create a cap
on unique individuals exposed to the retail store on a year timescale we use research on the
frequency of retail store visits to produce an estimate which is then used as the intervention
 SNAP-Ed Evaluation Approach 23
cap. Participation data for each intervention undergoes similar transformations, except for
healthy food and beverage standards where it is assumed that the entire membership for the
church or community center is exposed to the intervention.

 SNAP-Ed Evaluation Approach 24
SNAP-Ed Implementation
This section provides an overview of health conditions and the burden of obesity in Los Angeles
County Service Planning Areas (SPAs) along with detailed information about the specific SNAP-
Ed strategy interventions implemented in SPA 4 and SPA 6. The first section describes the
prevalence of SNAP status, obesity and other health conditions, and health behaviors by SPA.
The second section provides descriptive information about nutrition education services and
policy, systems and environmental (PSE) change strategies implemented in SPA 4 and SPA 6.
This information includes the number and type of programs and services implemented, as well
as information about their locations, and their estimated reach.

Prevalence of Health Conditions and Burden of Obesity in
Los Angeles County Service Planning Areas
Using data from the 2013-14 California Health Interview Survey (CHIS) we examined population
health indicators for adults living in Los Angeles County and each of the eight Service Planning
Areas (SPAs).

SNAP Eligibility and Poverty Rates
Exhibit 7 displays the estimated proportion eligible for SNAP benefits and the percent with
incomes below the Federal Poverty Level (FPL) by SPA. SNAP-eligible residents were identified
based on income (below 185% FPL) and receipt of Medicaid. SPAs 4 and 6 have the highest
poverty rates in Los Angeles County (both around 28 percent) as well as the highest rates of
SNAP eligibility (46 and 51 percent, respectively).

Exhibit 7. Percent Eligible for SNAP and Percent Below the Federal Poverty Line, Adults age 18
and over, Los Angeles County, California, 2013-14
 SNAP eligible Below Federal Poverty Line
 % 95% CI % 95% CI
 Los Angeles County 35.9 34 - 37.8 18.4 16.8 - 20.0
 SPA 1 - Antelope Valley 22.7 15 - 30.3 20.0 10.5 - 29.6
 SPA 2 - San Fernando 34.8 30.2 - 39.3 14.5 11.1 - 17.9
 SPA 3 - San Gabriel 35.6 30.4 - 40.7 14.5 11.5 - 17.5
 SPA 4 - Metro 45.7 39.1 - 52.3 28.6 22.9 - 34.3
 SPA 5 - West 14.4 10.2 - 18.6 4.1* 1.6 - 6.5
 SPA 6 - South 50.6 43.9 - 57.4 28.4 22.1 - 34.8
 SPA 7 - East 38.0 31.1 - 44.8 21.7 16.2 - 27.3
 SPA 8 - South Bay 32.9 27.8 - 37.9 17.7 13.2 - 22.3
Source: 2013-14 California Health Interview Survey
Note: * Statistically unreliable. SNAP-eligible defined as income below 185% FPL or on Medicaid and
does not include those who reported receiving SNAP

 SNAP-Ed Implementation 25
Overall, approximately 8% of adults in Los Angeles County reported receiving SNAP benefits and
36% met the eligibility requirements based on income and receipt of Medi-Cal (Medicaid), but
did not report receiving SNAP benefits. However, these rates varied considerably by SPA.
Exhibit 8 shows that the percent reporting receiving SNAP benefits ranged from less than 2% in
SPA 5 to 19% in SPA 1 and was 11% and 13% in SPAs 4 and 6, respectively. SNAP eligibility rates
ranged from 14% in SPA 5 to 51% in SPA 6. SPA 4 had the second highest rate of eligibility at
46%.

Exhibit 8. SNAP status by Service Planning Area (SPA), Adults age 18 and over, Los Angeles
County, California, 2013-14
 SNAP recipient SNAP eligible Not eligible
 % 95% CI % 95% CI % 95% CI
Los Angeles County 7.7 6.7 - 8.6 35.9 34 - 37.8 56.4 54.7 - 58.1
SPA 1 - Antelope Valley 19.1 9.9 - 28.3 22.7 15 - 30.3 58.3 48.1 - 68.4
SPA 2 - San Fernando 5.4 3.4 - 7.5 34.8 30.2 - 39.3 59.8 55.3 - 64.4
SPA 3 - San Gabriel 5.1 2.5 - 7.8 35.6 30.4 - 40.7 59.3 54.2 - 64.4
SPA 4 - Metro 11.1 7.0 - 15.2 45.7 39.1 - 52.3 43.2 36.5 - 50.0
SPA 5 - West 1.8* 0 - 3.6 14.4 10.2 - 18.6 83.8 79.5 - 88.2
SPA 6 - South 13.1 8.1 - 18.0 50.6 43.9 - 57.4 36.3 30.5 - 42.1
SPA 7 - East 10.6 6.3 - 15.0 38.0 31.1 - 44.8 51.4 45.2 - 57.6
SPA 8 - South Bay 5.1 2.3 - 7.9 32.9 27.8 - 37.9 62.0 57.5 - 66.5
Source: 2013-14 California Health Interview Survey.
Note: The SNAP-eligible population was defined as having income below 185% FPL or receiving Medi-
Cal benefits and does not include those who reported receiving SNAP benefits. Receiving SNAP benefits
was only asked of adults with household incomes below 300% FPL. Adults with incomes above 300% FPL
were coded as not eligible for SNAP.

Health Conditions
The prevalence of obesity and related health conditions also vary considerably within Los
Angeles County (Exhibit 9). The prevalence of obesity is highest in SPA 6 where 40% of adults
are obese and lowest in SPA 5 where 18% of adults are obese. SPAs 3, 6, and 8 all have diabetes
rates over 12%. SPA 5 has the lowest diabetes prevalence at 7%. The pattern for hypertension is
slightly different. In SPAs 4, 6, and 8 the prevalence of hypertension is above 30% and SPA 2 has
the lowest prevalence at 23%.

 SNAP-Ed Implementation 26
Exhibit 9. Health Outcomes by Service Planning Area (SPA), Adults age 18 and over, Los Angeles
County, California, 2013-14
 Diabetes Hypertension Overweight Obese
 % 95% CI % 95% CI % 95% CI % 95% CI
Los Angeles County 10.4 9.2 - 11.6 27.4 25.7 - 29.0 35.7 33.7 - 37.7 26.3 24.3 - 28.4
SPA 1 - Antelope Valley 7.9 4.7 - 11.2 27.8 18.4 - 37.3 33.7 24.1 - 43.3 27.1 18.0 - 36.1
SPA 2 - San Fernando 8.1 5.8 - 10.3 22.9 19.1 - 26.7 36.7 32.3 - 41.1 23.6 19.3 - 27.8
SPA 3 - San Gabriel 12.1 8.7 - 15.6 25.9 22.1 - 29.7 37.3 32.7 - 42.0 22.4 18.8 - 26.0
SPA 4 - Metro 9.7 5.9 - 13.6 31.3 26.0 - 36.6 37.7 30.9 - 44.4 22.5 16.6 - 28.3
SPA 5 - West 7.2 3.9 - 10.4 25.3 19.5 - 31.0 29.5 22.7 - 36.2 17.7 12.5 - 22.8
SPA 6 - South 12.3 7.5 - 17.1 30.3 23.0 - 37.6 38.5 30.3 - 46.8 40.2 31.7 - 48.6
SPA 7 - East 11.2 7.2 - 15.3 25.5 19.8 - 31.2 33.8 28.1 - 39.6 32.7 26.7 - 38.6
SPA 8 - South Bay 12.4 8.4 - 16.3 32.9 27.9 - 38.0 34.0 28.6 - 39.5 27.7 22.7 - 32.7
Source: 2013-14 California Health Interview Survey.
Note: Diabetes and hypertension are based on self-report responses to ever being diagnosed with the
condition. Overweight and obesity are based on body mass index (BMI) which is calculated from self-
reported height and weight. Overweight has BMI of 25.0 to 25.99 and obese has BMI of 30 or above.

Exhibit 10 displays the prevalence of four related health behaviors: walking for transportation,
walking for leisure, consumption of sugar-sweetened beverages, and fast food consumption. In
Los Angeles County, more than half of adults (56%) reported walking for transportation and
65% reported walking for fun or exercise. The prevalence of walking for transportation ranged
from 41% in SPA 1 to 72% in SPA 4 and the prevalence of walking for leisure ranged from 63% in
SPA 4 to 71% in SPA 5. Overall, 15% of adults in Los Angeles County consumed at least one
sugar sweetened beverage (SSB) per day and 44% had fast food at least twice a week. The
percent consuming at least on SSB per day ranged from 9% in SPA 5 to 24% in SPA 6; and the
percent eating fast food at least twice per week ranged from 29% in SPA 5 to 54% in SPA 6.
In summary, SPA 4 and SPA 6 have the highest rates of SNAP-eligibility among the SPAs in Los
Angeles County and they have the second and third highest rates of SNAP participation. In
addition, SPA 4 and SPA 6 have high rates of obesity and chronic conditions as well as high rates
of poor dietary behaviors that can contribute to obesity and chronic conditions.

Exhibit 10. Health-related Behaviors by Service Planning Area (SPA), Adults age 18 and over, Los
Angeles County, California, 2013-14
 Fast food 2 or
 Walked for Walked for One or more more times per
 Transport Leisure SSB per day week
 % 95% CI % 95% CI % 95% CI % 95% CI
Los Angeles County 55.7 53.3 - 58.0 64.9 62.7 - 67.0 15.2 13.5 - 17.0 43.6 41.5 - 45.7
SPA 1 - Antelope Valley 41.4 30.9 - 51.9 67.6 58.7 - 76.5 21.3 12.2 - 30.4 48.9 38.7 - 59.1
SPA 2 - San Fernando 52.8 47.8 - 57.9 65.8 60.6 - 70.9 13.2 9.5 - 17.0 42.1 36.7 - 47.5
SPA 3 - San Gabriel 48.6 43.3 - 53.9 64.7 60.3 - 69.2 13.5 10.2 - 16.8 42.5 37.1 - 48.0
SPA 4 - Metro 71.5 65.3 - 77.6 62.9 56.6 - 69.1 12.6 8.3 - 16.8 34.8 28.4 - 41.1

 SNAP-Ed Implementation 27
SPA 5 - West 60.3 53.6 - 67.0 71.4 64.0 - 78.8 8.7 4.6 - 12.8 29.0 22.2 - 35.9
SPA 6 - South 62.2 53.8 - 70.6 64.3 56.6 - 72.1 23.9 18.0 - 29.8 53.9 46.4 - 61.3
SPA 7 - East 54.8 48.3 - 61.4 63.6 56.8 - 70.4 18.4 13.4 - 23.5 51.2 44.3 - 58.2
SPA 8 - South Bay 54.3 49.5 - 59.2 63.1 58.5 - 67.7 15.6 11.0 - 20.2 46.0 40.1 - 51.9
Source: 2013-14 California Health Interview Survey.
Note: Walked for transport includes adults who reported walking to get someplace in the past week.
Walked for leisure includes adults who reported walking for fun, relaxation, or exercise in the past week.
Sugar-Sweetened Beverages (SSB) include soda, sports drinks, energy drinks, and sweetened fruit drinks,
but does not include diet drinks.

SNAP-Ed Implementation in SPA 4 and SPA 6
Through the Los Angeles County SNAP-Ed efforts, LACDPH funded local partners to
implement PSE strategies and provide nutrition education services to community
residents to promote healthy eating and prevent obesity. Because of their high number
of SNAP-Ed eligible census tracts, a high concentration of interventions has been
implemented in SPA 4 and SPA 6, and these two SPAs are the focus of this evaluation
report.

 Service Planning Area 4, or SPA 4, services the communities
 of Boyle Heights, Central City, Downtown LA, Echo Park, El
 Sereno, Hollywood, Mid-City Wilshire, Monterey Hills,
 Mount Washington, Silverlake, West Hollywood, and
 Westlake.

 Service Planning Area 6, or SPA 6, services the
 communities of Athens, Compton, Crenshaw, Florence,
 Hyde Park, Lynwood, Paramount, and Watts.

 SNAP-Ed Implementation 28
You can also read