Numerical Simulation of the Effects of Groundwater Withdrawal and Injection of High-Salinity Water on Salinity and Groundwater Discharge ...
←
→
Page content transcription
If your browser does not render page correctly, please read the page content below
Prepared in cooperation with the National Park Service

Numerical Simulation of the Effects of Groundwater
Withdrawal and Injection of High-Salinity Water on
Salinity and Groundwater Discharge, Kaloko-Honokōhau
National Historical Park, Hawaiʻi

Scientific Investigations Report 2021–5004

U.S. Department of the Interior
U.S. Geological Survey
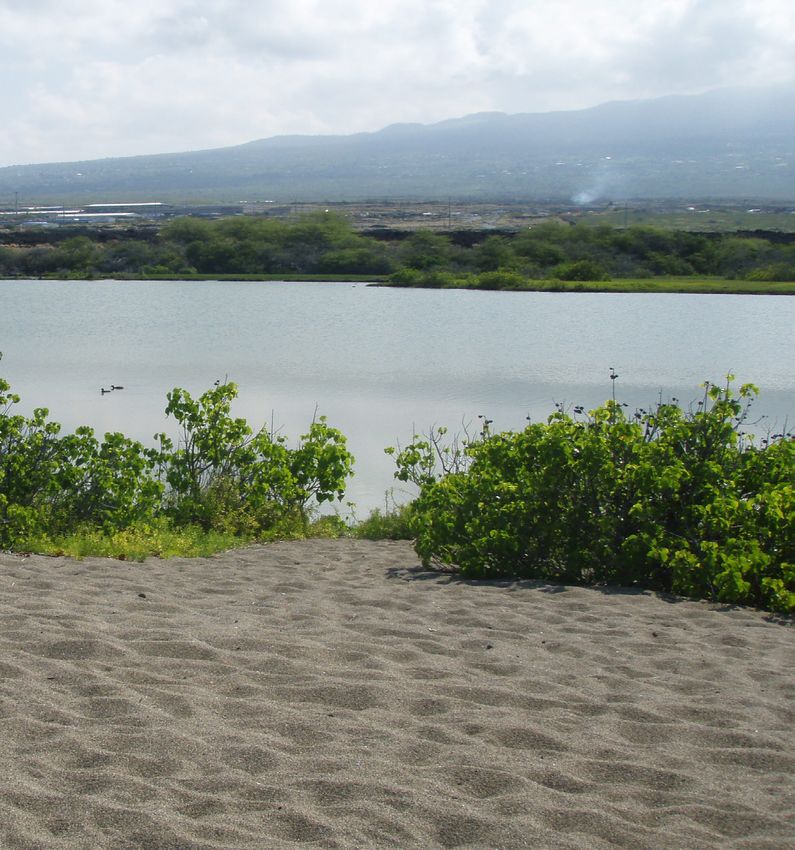
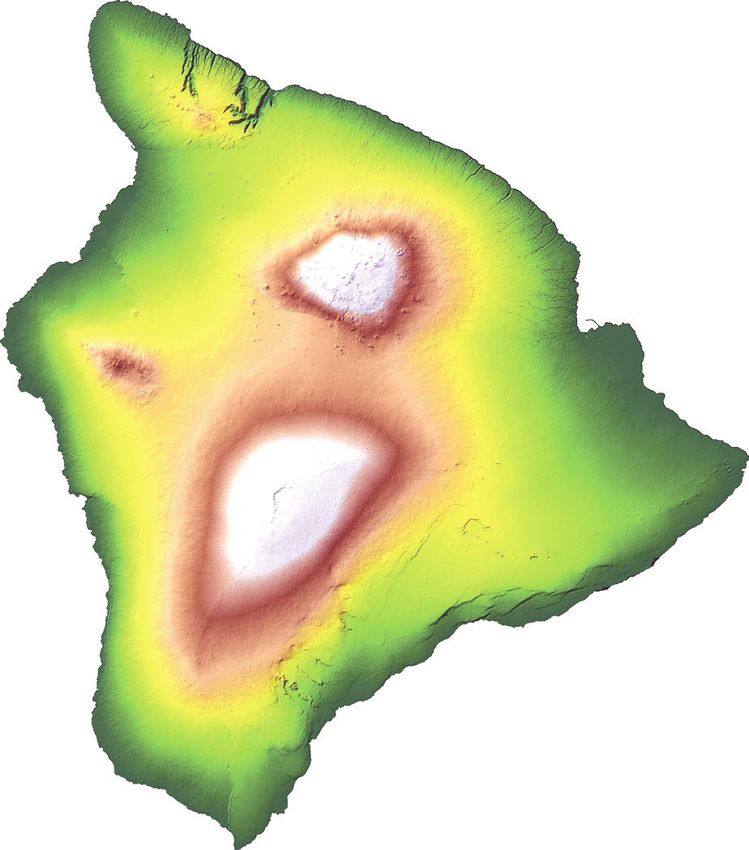
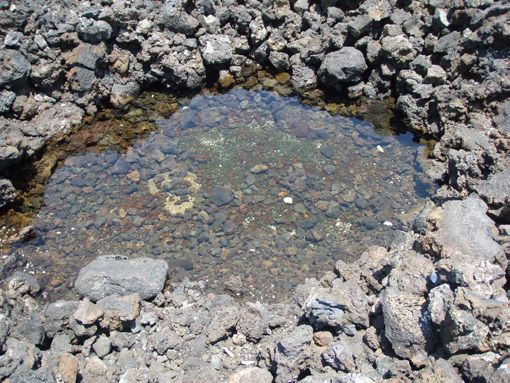
Cover. Groundwater in Kaloko-Honokōhau National Historical Park, Hawaiʻi, forms ʻAimakapā fishpond—a land-locked coastal water body
that provides habitat for endangered native waterbirds and that is separated from the ocean by a sand berm—and smaller anchialine pools
(inset; pool is about 3 feet wide and a few inches deep), which occur in surface depressions in the volcanic rocks that extend below the
groundwater table. Photographs by Delwyn S. Oki, U.S. Geological Survey, May 14, 2012.
Numerical Simulation of the Effects of Groundwater
Withdrawal and Injection of High-Salinity Water on
Salinity and Groundwater Discharge, Kaloko-
Honokōhau National Historical Park, Hawaiʻi
By Delwyn S. Oki

Prepared in cooperation with the National Park Service

Scientific Investigations Report 2021–5004

U.S. Department of the Interior
U.S. Geological Survey
U.S. Geological Survey, Reston, Virginia: 2021

For more information on the USGS—the Federal source for science about the Earth, its natural and living
resources, natural hazards, and the environment—visit https://www.usgs.gov or call 1–888–ASK–USGS.
For an overview of USGS information products, including maps, imagery, and publications,
visit https://store.usgs.gov.

Any use of trade, firm, or product names is for descriptive purposes only and does not imply endorsement by the
U.S. Government.

Although this information product, for the most part, is in the public domain, it also may contain copyrighted materials
as noted in the text. Permission to reproduce copyrighted items must be secured from the copyright owner.

Suggested citation:
Oki, D.S., 2021, Numerical simulation of the effects of groundwater withdrawal and injection of high-salinity water on
salinity and groundwater discharge, Kaloko-Honokōhau National Historical Park, Hawaiʻi: U.S. Geological Survey
Scientific Investigations Report 2021–5004, 59 p., https://doi.org/10.3133/sir20215004.

Associated data for this publication:
Oki, D.S., 2021, SUTRA model used to evaluate the effects of groundwater withdrawal and injection, Kaloko-
Honokōhau National Historical Park, Hawaiʻi: U.S. Geological Survey data release, https://doi.org/10.5066/P9IZ3EVJ.

ISSN 2328-0328 (online)
iii

Acknowledgments
Funding for this study was provided by the National Park Service (NPS), Water Rights Branch
and Kaloko-Honokōhau National Historical Park (KAHO). Paula Cutillo, Sallie Beavers, Rebecca
Most, and Lindsey Kramer from NPS assisted with field logistics, data collection, and other
aspects of the study. Ed Carlson from the National Geodetic Survey determined altitudes of
reference marks near wells using global positioning system methods. Tom Nance (Tom Nance
Water Resource Engineering) provided data from wells near KAHO that were invaluable for
understanding the groundwater-flow system. Keith Olson from the Natural Energy Laboratory
of Hawaii Authority (NELHA) provided water-quality and water-quantity information related to
the NELHA facility; Norris Uehara from the Hawaiʻi Department of Health, Safe Drinking Water
Branch, provided data from injection wells in the study area; Patrick Casey and Robert Chenet
from the Hawaiʻi Commission on Water Resource Management provided water-level, salinity-
profile, and groundwater-withdrawal data from wells in and near the study area. Jeff Perreault,
Sarah Rosa, Adam Johnson, Maoya Bassiouni, and Craig Senter from the U.S. Geological
Survey (USGS) and Kolja Rotzoll, at the time with the University of Hawaiʻi (currently with
USGS), helped in collection of water-level data and surveying.
iv

     Contents
     Acknowledgments........................................................................................................................................ iii
     Abstract......................................................................................................................................................... 1
     Introduction.................................................................................................................................................... 2
           Purpose and Scope.............................................................................................................................. 4
     Setting ......................................................................................................................................................... 4
           Climate ................................................................................................................................................. 6
           Geology................................................................................................................................................ 6
                  Extrusive Volcanic Rocks............................................................................................................. 6
                  Intrusive Volcanic Rocks.............................................................................................................. 8
                  Sedimentary Deposits.................................................................................................................. 8
                  Faults ........................................................................................................................................ 8
           Ocean Temperatures............................................................................................................................ 9
     Groundwater-Flow System.......................................................................................................................... 10
           Groundwater Recharge...................................................................................................................... 10
           Coastal Freshwater-Lens System....................................................................................................... 10
                  Tidal Effects............................................................................................................................... 14
                  Synoptic Water-Level Distribution.............................................................................................. 18
                  Salinity ...................................................................................................................................... 22
                  Temperature............................................................................................................................... 22
           Coastal Confined-Groundwater System............................................................................................. 23
                  Kamakana Well, 3959–01.......................................................................................................... 23
                  Keopu 1 Deep Monitor Well, 3858–01....................................................................................... 23
                  Keopu 2 Deep Monitor Well, 3858–02....................................................................................... 24
           Inland High Water-Level Area............................................................................................................. 24
                  Water Levels.............................................................................................................................. 24
                  Salinity and Temperature........................................................................................................... 24
           Conceptual Model of Groundwater Flow ........................................................................................... 24
           Groundwater Discharge Through KAHO............................................................................................ 26
           Factors Affecting Groundwater Discharge Through KAHO................................................................. 26
     Simulation of Groundwater Flow................................................................................................................. 27
           Water Properties................................................................................................................................. 28
           Rock Properties.................................................................................................................................. 28
           Unsaturated Zone............................................................................................................................... 29
           Two-Dimensional Cross-Section Model.............................................................................................. 29
                  Model Mesh............................................................................................................................... 29
                  Representation of the System.................................................................................................... 29
                  Boundary Conditions ................................................................................................................. 30
                          Specified Pressure............................................................................................................ 30
                          Specified Temperature...................................................................................................... 30
                          Heat Flux........................................................................................................................... 31
                          Recharge and Withdrawal................................................................................................. 31
                  Estimation of Aquifer Hydraulic Properties................................................................................. 31
                  Simulation Results..................................................................................................................... 32
v
Sensitivity Analysis..................................................................................................................... 33
Exclusion of Temperature ................................................................................................. 33
Dip of Confining Units....................................................................................................... 34
Presence of Thick Upper Confining Unit........................................................................... 34
Exclusion of Confining Units and Recharge from Inland Vertical Boundary...................... 34
Three-Dimensional Regional Model................................................................................................... 34
Model Mesh............................................................................................................................... 34
Representation of the System.................................................................................................... 37
Boundary Conditions ................................................................................................................. 37
Specified Pressure............................................................................................................ 37
Recharge and Withdrawal................................................................................................. 37
Estimation of Aquifer Hydraulic Properties................................................................................. 38
Simulation Results..................................................................................................................... 39
Simulation of Selected Withdrawal and Injection Scenarios........................................................................ 39
Scenario 1—Withdrawal of 0.5 Mgal/d............................................................................................... 41
Change in Salinity of Damselfly Anchialine-Pool Habitat in KAHO............................................ 44
Change of Freshwater Discharge Through KAHO..................................................................... 44
Scenario 2—Withdrawal of 1.0 Mgal/d............................................................................................... 44
Change in Salinity of Damselfly Anchialine-Pool Habitat in KAHO............................................ 44
Change of Freshwater Discharge Through KAHO..................................................................... 47
Scenario 3—Injection of 1.0 Mgal/d.................................................................................................... 47
Change in Salinity of Damselfly Anchialine-Pool Habitat in KAHO............................................ 47
Change of Freshwater Discharge Through KAHO..................................................................... 50
Implications of Scenarios.................................................................................................................... 52
Limitations................................................................................................................................................... 52
Summary..................................................................................................................................................... 53
References Cited......................................................................................................................................... 54
Figures
1. Map of the island of Hawaiʻi, Hawaiʻi, showing Kaloko-Honokōhau National Historical Park
within the Keauhou aquifer system and other selected geographic features............................... 2
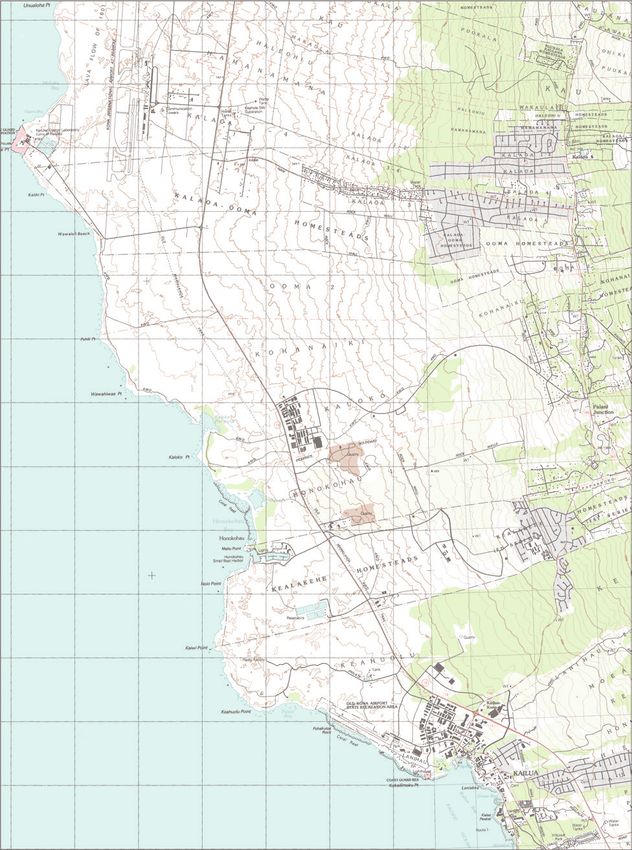
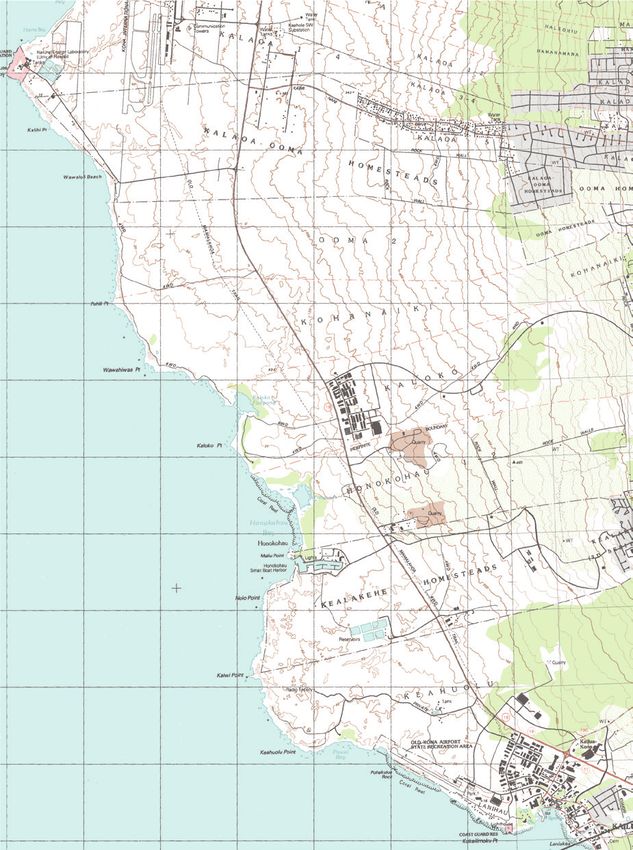
2. Map of Kaloko-Honokōhau National Historical Park showing wells, fishponds, and anchialine
pools in and near the park, island of Hawaiʻi, Hawaiʻi.................................................................. 3
3. Map of the island of Hawaiʻi, Hawaiʻi, showing generalized surficial geology and geologic
features......................................................................................................................................... 5
4. Map of the island of Hawaiʻi, Hawaiʻi, showing mean annual rainfall distribution during
1978–2007.................................................................................................................................... 7
5. Line graph showing ocean temperature profiles offshore from the Keauhou area, western
Hawai‘i and from ALOHA station 1 offshore from O‘ahu, Hawai‘i................................................. 9
6. Diagram showing conceptual models of groundwater occurrence in the Keauhou aquifer
system, island of Hawai‘i, Hawai‘i............................................................................................... 11
7. Map showing the approximate boundary between coastal freshwater-lens system and inland
high water-level area in the Keauhou aquifer system and wells, island of Hawai‘i, Hawai‘i....... 12
8. Map showing mean annual recharge distribution for 1984–2008 in the Kona area, island of
Hawai‘i, Hawai‘i........................................................................................................................... 13vi
9. Map showing tidal efficiency during 2009–10, estimated from groundwater levels recorded
in selected wells and anchialine pools in the Keauhou aquifer system, island of
Hawai‘i, Hawai‘i........................................................................................................................... 19
10. Map showing the daily average groundwater levels on August 7, 2009; May 18 and
October 2, 2009; and April 18, 2009 in selected wells and anchialine pools in the Keauhou
aquifer system, island of Hawai‘i, Hawai‘i......................................................................................20
11. Map showing magnitude and direction of estimated average hydraulic gradient during the
period from September 21 to October 20, 2009......................................................................... 21
12. Line graph showing fluid specific-conductance profiles from wells in the Keauhou area,
Hawai‘i........................................................................................................................................ 22
13. Schematic cross sections showing possible geologic structures that may impound
groundwater to high levels in the inland part of the Keauhou area, Hawai‘i............................... 25
14. Graph showing groundwater withdrawals during the period 1970 through 2016 in the State
Keauhou aquifer system, Hawai‘i............................................................................................... 27
15. Vertical cross section of the two-dimensional model mesh that represents the area near
Kaloko-Honokōhau National Historical Park, Hawai‘i................................................................. 30
16. Line graphs showing observed, simulated, and sensitivity-analysis salinity and temperature
profiles for the Kamakana well 3959–01, Hawai‘i....................................................................... 32
17. Line graph showing observed and simulated transient groundwater levels for selected wells
in, and inland from, Kaloko-Honokōhau National Historical Park, Hawai‘i.................................. 33
18. Map showing top view of three-dimensional model mesh, zones, and boundary conditions
in the Keauhou area, Hawai‘i...................................................................................................... 35
19. Vertical cross section of the three-dimensional model mesh on the south boundary of the
model domain, Hawai‘i................................................................................................................ 36
20. Map showing observed and simulated water levels in the Keauhou area, Hawai‘i.................... 40
21. Line graph showing observed and simulated salinity profiles for selected wells, Hawai‘i........... 41
22. Map of the Keauhou area, Hawai‘i, showing the location of sites where salinity samples
were collected, and scatterplot showing observed and simulated salinity values...................... 42
23. Map showing simulated increase in salinity, caused by the withdrawal of an additional
0.5 million gallons per day from the coastal freshwater-lens system, at the anchialine-pool
habitat for the orangeblack Hawaiian damselfly in Kaloko-Honokōhau National Historical
Park, Hawai‘i............................................................................................................................... 43
24. Map showing simulated reduction in the freshwater component of groundwater discharge
through Kaloko-Honokōhau National Historical Park caused by the withdrawal of an
additional 0.5 million gallons per day from the coastal freshwater-lens system, Hawai‘i............ 45
25. Map showing simulated increase in salinity, caused by the withdrawal of an additional
1.0 million gallons per day from the coastal freshwater-lens system, at anchialine-pool
habitat for the orangeblack Hawaiian damselfly in Kaloko-Honokōhau National Historical
Park, Hawai‘i............................................................................................................................... 46
26. Map showing simulated reduction in the freshwater component of groundwater discharge
through Kaloko-Honokōhau National Historical Park caused by the withdrawal of an
additional 1.0 million gallons per day from the coastal freshwater-lens system, Hawai‘i............ 48
27. Map showing simulated change in salinity, caused by the injection of an additional
1.0 million gallons per day of high-salinity water into the coastal freshwater-lens
system, at anchialine-pool habitat for the orangeblack Hawaiian damselfly in Kaloko-
Honokōhau National Historical Park, Hawai‘i............................................................................. 49
28. Map showing simulated reduction in the freshwater component of groundwater discharge
through Kaloko-Honokōhau National Historical Park caused by the injection of an additional
1.0 million gallons per day of high-salinity water into the coastal freshwater-lens
system, Hawai‘i........................................................................................................................... 51vii
Tables
1. Estimated tidal efficiencies from groundwater-level records at selected wells and anchialine
pools and corresponding analysis periods, Keauhou area, Hawaiʻi........................................... 14
2. Withdrawal rates and values of top and bottom altitudes assigned to wells represented in
the three-dimensional numerical groundwater model, Keauhou area, Hawaiʻi........................... 38
Conversion Factors
U.S. customary units to International System of Units
Multiply By To obtain
Length
inch (in.) 2.54 centimeter (cm)
inch (in.) 25.4 millimeter (mm)
foot (ft) 0.3048 meter (m)
mile (mi) 1.609 kilometer (km)
Area
square foot (ft )
2
0.09290 square meter (m2)
square mile (mi ) 2
259.0 hectare (ha)
square mile (mi ) 2
2.590 square kilometer (km2)
Volume
gallon (gal) 3.785 liter (L)
gallon (gal) 0.003785 cubic meter (m3)
million gallons (Mgal) 3,785 cubic meter (m3)
cubic foot (ft3) 0.02832 cubic meter (m3)
Flow rate
foot per second (ft/s) 0.3048 meter per second (m/s)
foot per day (ft/d) 0.3048 meter per day (m/d)
foot per year (ft/yr) 0.3048 meter per year (m/yr)
gallon per day (gal/d) 0.003785 cubic meter per day (m3/d)
million gallons per day (Mgal/d) 0.04381 cubic meter per second (m3/s)
inch per year (in/yr) 25.4 millimeter per year (mm/yr)
Mass
ounce, avoirdupois (oz) 28.35 gram (g)
pound, avoirdupois (lb) 0.4536 kilogram (kg)
Pressure
atmosphere, standard (atm) 101.3 kilopascal (kPa)
bar 100 kilopascal (kPa)
pound-force per square inch (lbf/ 6.895 kilopascal (kPa)
in2)
pound per square foot (lb/ft2) 0.04788 kilopascal (kPa)
pound per square inch (lb/in ) 2
6.895 kilopascal (kPa)viii
Conversion Factors—Continued
Multiply By To obtain
Density
pound per cubic foot (lb/ft )
3
16.02 kilogram per cubic meter (kg/m3)
Hydraulic conductivity
foot per day (ft/d) 0.3048 meter per day (m/d)
Hydraulic gradient
foot per mile (ft/mi) 0.1894 meter per kilometer (m/km)
Temperature in degrees Celsius (°C) may be converted to degrees Fahrenheit (°F) as follows:
°F = (1.8 × °C) + 32.
Temperature in degrees Fahrenheit (°F) may be converted to degrees Celsius (°C) as follows:
°C = (°F – 32) / 1.8.
Datum
Vertical coordinate information is referenced to local mean sea level.
Horizontal coordinate information is referenced to the North American Datum of 1983 (NAD 83).
Altitude, as used in this report, refers to distance above the vertical datum.
Supplemental Information
Specific conductance is given in microsiemens per centimeter at 25 degrees Celsius (µS/cm at 25 °C).
Concentrations of chemical constituents in water are given in either milligrams per liter (mg/L) or
micrograms per liter (µg/L).
Abbreviations
CTD conductivity-temperature-depth
CWRM Hawaiʻi Commission on Water Resource Management
EPA U.S. Environmental Protection Agency
KAHO Kaloko-Honokōhau National Historical Park
NELHA Natural Energy Laboratory of Hawaii Authority
NPS National Park Service
USGS U.S. Geological SurveyNumerical Simulation of the Effects of Groundwater
Withdrawal and Injection of High-Salinity Water on
Salinity and Groundwater Discharge, Kaloko-
Honokōhau National Historical Park, Hawaiʻi
By Delwyn S. Oki
Abstract Model results also indicate that withdrawal of additional
groundwater from the coastal freshwater-lens system will
Kaloko-Honokōhau National Historical Park (KAHO) affect the groundwater discharge, in terms of the freshwater
is located on the west coast of the island of Hawaiʻi and component (water with zero salinity) of the discharge, through
contains water resources exposed in fishponds, anchialine KAHO. Greater withdrawal rates cause greater reductions in
pools, and marine waters that are cultural resources and freshwater discharge through KAHO. For a given withdrawal
that provide habitat for threatened, endangered, and other rate, the greatest reduction in freshwater discharge through
culturally important native species. KAHO’s water resources KAHO is associated with wells near the north boundary of
are sustained by and dependent on groundwater discharge. In KAHO and the least reduction is associated with wells near
1978, the year of KAHO authorization, the lands immediately the coast to the north and south of KAHO.
surrounding KAHO were undeveloped and zoned for Injection of high-salinity water that is denser than ocean
conservation purposes; at present, most surrounding lands water can affect the salinity of damselfly habitat in KAHO, with
are either developed or zoned for industrial, commercial, or the magnitude of the effect dependent on the location of the
residential use. Urbanization of the North Kona District has injection. Model results indicate that salinity may either increase
increased the need for additional drinking and nonpotable or decrease in the anchialine pools that provide damselfly habi-
(irrigation) water. Because KAHO’s water resources may be tat in KAHO, depending on the site of injection. Injection inland
affected by existing and proposed groundwater withdrawals of KAHO and at sites immediately north and south of KAHO
and injections of high-salinity water in the surrounding area, causes a simulated decrease in salinity at the damselfly habitat,
the U.S. Geological Survey, in cooperation with the National whereas injection farther north and south of KAHO causes an
Park Service, undertook this study to refine the understanding increase in salinity. Injection of high-salinity water also causes
of how groundwater withdrawals and injection of high-salinity a reduction in freshwater discharge through KAHO, with the
water may affect KAHO’s water resources. greatest reduction associated with distant injection wells to the
Changes in KAHO water resources, in terms of changes north and south of KAHO and the least reduction associated
in salinity and groundwater discharge, were modeled for with wells located near and immediately inland from KAHO.
selected scenarios of groundwater withdrawal and high- The numerical groundwater models developed for this
salinity water injection in the aquifer. The numerical model study have a number of limitations. Lack of understanding
was developed using the model code SUTRA, which accounts of the subsurface geology constrains the ability to accurately
for density-dependent flow and salinity transport, and model the groundwater-flow system. The models developed
included the coastal-confined groundwater system beneath for this study are nonunique, cannot account for local-scale
the coastal freshwater-lens system. Model results indicate heterogeneities in the aquifer, and contain uncertainties related
that withdrawal of additional groundwater from the coastal to recharge, boundary conditions, assigned parameter values in
freshwater-lens system will affect the salinity of KAHO’s the model, and representations of the different hydrogeological
anchialine pools, which provide habitat for the endangered features. Confidence in model results can be improved by
orangeblack Hawaiian damselfly (Megalagrion xanthomelas). addressing these and other limitations. In spite of these
The magnitude of the effect is dependent on the amount and limitations, the three-dimensional numerical model developed
location of the withdrawal. Greater withdrawal rates cause for this study provides a useful conceptual understanding of
greater increases in salinity in KAHO, other factors being the potential effects of additional withdrawals and injections
equal. For a given withdrawal rate, the greatest increase on groundwater resources in KAHO. Further evaluation of
in salinity in KAHO is associated with wells withdrawing the ecologic effects of the simulated changes in groundwater
groundwater in an area inland of KAHO and the least quality and quantity in KAHO is needed but is beyond the
increase in salinity is associated with wells near the coast. scope of this study.2 Numerical Simulation of Groundwater Withdrawal and Injection in Kaloko-Honokōhau National Historical Park
Introduction to demonstrate historical land-use patterns, and to provide a
resource for the education, enjoyment, and appreciation of
Kaloko-Honokōhau National Historical Park (KAHO), traditional Native Hawaiian activities and culture (Public Law
established in 1978, is located on the west coast of the island 95-625, section 505, November 10, 1978).
of Hawaiʻi, about 3 miles (mi) north of the town of Kailua The waters in KAHO represent an important resource
Kona and within the Keauhou aquifer system, as defined by that made it possible for Native Hawaiians to settle in the arid
the Hawaiʻi Commission on Water Resource Management area. KAHO contains two large traditional Hawaiian fishponds
(CWRM) (fig. 1). KAHO was established by the Federal (Kaloko and ʻAimakapā fishponds) with large associated wet-
government to provide a center to preserve, interpret, and lands, more than 180 known anchialine pools, and more than
perpetuate traditional Native Hawaiian activities and culture, 600 acres of marine waters (fig. 2). Each of these water bodies
Upolu 160° 158° 156°
Point
22° HAWAIIAN
Kaua‘i
Hāwī ISLANDS
Ni‘ihau
Moloka‘i
O‘ahu
Waipi‘o
155°30’
Maui
Bay Lāna‘i
PAC Kaho‘olawe
5,480 ft IFI
20° C
Honoka‘a OC
Kawaihae tide gage 1617433 Kohala EA Map
N area
Kawaihae Pa‘auilo Hawai‘i
Bay Waimea
20°
Waikoloa
Honomū
00
10 Mauna Kea
156°
2000
13,796 ft
3000 Pāpa‘ikou
Hilo
Bay 155°
0
400 Wainaku
Keahole Hualālai
00
Point
50
Kalaoa 8,271 ft Hilo
00
KALOKO- 60
100
HONOKŌHAU Kealakehe
200
0
3000
No
NATIONAL Kailua Kona Kea‘au
4000
0
HISTORICAL
rth boun
500
PARK 70
60
Ko dar
0
80 00
00
Kaiwi 00
na y
900 Mountain View Cape
Point 0
Dis
Keauhou 100 Kumukahi
1100 00
12000 0
tric
Pahoa
t
19°30’ Captain Cook 13,679 ft
Kealakekua
Bay
Mauna Loa Kīlauea
Pāhala
EXPLANATION
Line of equal altitude—Contour interval is 1,000 feet
Nā‘ālehu State Keauhou aquifer-system boundary
Major road
Base modified from U.S. Geological Survey 19°
National Hydrography Dataset, 1:24,000
scale. Shaded relief from U.S. Geological
Survey digital elevation model data. Universal 0 5 10 15 20 MILES
Transverse Mercator projection, zone 4, North
American Datum of 1983 Kalae 0 5 10 15 20 KILOMETERS
Figure 1. Map of the island of Hawaiʻi, Hawaiʻi, showing Kaloko-Honokōhau National Historical Park within the Keauhou aquifer system and other
selected geographic features. Color shading added to the map to enhance perception of topography indicated by the altitude contours.Introduction 3
156°03' 156°02' 156°01' 156° 155°59'
4459–02
4459–01
4463–04 4462–02
4458–01
4463–01 to –03
4461–01 4458–02
19°44' 4363–26 to –28
Approximate boundary between coastal fresh
4363–32,–33 4462–06,–07 4461–02
4363–34 4462 –05
4363–35 to –37 Keahole power plant
4363–24,–25 injection well (UH–1776)
4363–21 to –23
4363–13 4361–01
4363–14 to –16 4360–01
4363–01 to –12 4358–01
4363–17 to –19
4363–29 to –31
4262–07
19°43' 4262–04 to –06
4262–08 to –10
O‘oma makai well
water-le
4161–09 4258–03
O‘oma mauka well
4262–03
4262–01
ns sys
4262–02
4161–04
19°42' Kohanaiki injection
4161–05
tem an
4161–06 4160–02
well (UH–2594) 4161–07
4161–10 4160–01
4161–08
d
4162–07
inlan
4162–01 4161–12
4162–05
d hig
4161–11
4162–06
4162–04
h wa
4161–01
ter-le
Kaloko
Fishpond 4161–02
vel a
19°41'
rea
KALOKO-HONOKŌHAU 4061–01
NATIONAL HISTORICAL PARK 4060–03
4060–02
‘Aimakapā
Fishpond 4060–01
Kealakehe 4059–01
monitor well 2
Disposal pit—Kealakehe
19°40' Wastewater Treatment Plant 3959–01
HAWAIIAN
ISLANDS
Map area
EXPLANATION
Growth opportunity area—
Modified from County of
19°39' Hawai‘i (2019)
4161–01
Well and number
Injection well
Anchialine pool
Dry well
Base modifed from U.S. Geological Survey Digital Raster 0 0.5 1 1.5 2 MILES
19°38' Graphics topographic map, 1:24:000 scale. Universal 3859–01
Transverse Mercator projection, zone 4, North American 0 0.5 1 1.5 2 KILOMETERS
Datum of 1983
Figure 2. Map of Kaloko-Honokōhau National Historical Park showing wells, fishponds, and anchialine pools in and near the park,
island of Hawaiʻi, Hawaiʻi.
men20-4011_fig024 Numerical Simulation of Groundwater Withdrawal and Injection in Kaloko-Honokōhau National Historical Park
is a cultural resource and also provides habitat for threatened, freshwater and saltwater, and a reduction of natural groundwater
endangered, and other culturally important native species. discharge to surface-water bodies. The extent to which water
Kaloko fishpond is located near the northern part of KAHO, levels decline and the transition zone rises is dependent on
has an area of about 11.5 acres, and has a restored rock factors including the distribution and rates of withdrawals and
seawall forming its coastal boundary; ʻAimakapā fishpond is the hydraulic characteristics of the aquifer system. Oki and
located near the southern part of KAHO, has an area of about others (1999) modeled the effects of groundwater withdrawals
12 acres, and has a sand berm forming its coastal boundary. on freshwater flow through KAHO relative to average 1978
Native Hawaiians traditionally maintained the fishponds for conditions (the year KAHO was established). Model results
cultivation of edible fish. The wetlands and fishponds are nest- indicated that increasing withdrawals, relative to 1978
ing and feeding habitat for two species of endangered water- conditions, by 56.8 million gallons per day (Mgal/d) distributed
birds, the Hawaiian coot (Fulica americana alai Peale, 1848) along the western part of Hawaiʻi will cause a 47 percent
and the Hawaiian stilt (Himantopus mexicanus knudseni), and reduction of fresh groundwater discharge through KAHO and
represent a substantial fraction of the available waterbird and groundwater-level declines of about 0.6 ft (see fig. 6 of Oki and
shorebird habitat on the island of Hawaiʻi. KAHO’s water others [1999]). The model developed by Oki and others (1999)
resources are sustained by, and in the case of the anchia- did not account for the presence of a recently discovered body
line pools and ʻAimakapā fishpond are mainly dependent of coastal confined groundwater that exists beneath the coastal
on, groundwater discharge for freshwater input. Anchialine freshwater-lens system. Furthermore, the model was not capable
pools are rare brackish-water ecosystems that lack a surface of simulating water-quality changes caused by anthropogenic
connection to the ocean and are hydrologically connected factors. Additional study was needed to refine the understanding
to groundwater and the ocean through a permeable aquifer of how anthropogenic factors, including increased groundwater
(Holthuis, 1973; Brock and Kam, 1997). KAHO contains withdrawals and injection of high-salinity water, may affect
about 25 percent of the estimated 700 anchialine pools in the KAHO’s water resources.
State (Mitchell and others, 2005). Hawaiian anchialine pools
support rare endemic species, some of which remain unde- Purpose and Scope
scribed, and two species listed as endangered by the U.S. Fish
and Wildlife Service (USFWS): the orangeblack Hawaiian The purpose of this report is to provide information
damselfly (Megalagrion xanthomelas) and an anchialine pool related to how anthropogenic factors may affect water
shrimp (Procaris hawaiana). Some anchialine pool species resources in Kaloko-Honokōhau National Historical Park.
prefer a specific range of salinity (Tango, 2010), and salinity Specifically, this report presents estimates of changes in
preference may be dependent on species and life stage. The salinity and groundwater discharge in KAHO caused by
anchialine pools in KAHO generally have irregular shapes and selected scenarios of groundwater withdrawal and injection
depths that vary with ocean tide, and although several are large of high-salinity water, such as reverse-osmosis concentrate,
(surface areas exceeding 300 square feet [ft2]), the majority are into the aquifer. To meet the objectives of the study, available
small (surface areas less than 100 ft2) and shallow (less than hydrologic and geologic data were compiled, additional
1.5-ft deep) (Brock and Kam, 1997). During low-tide condi- groundwater-level data were collected, and a numerical
tions, some anchialine pools completely drain. Anchialine pool groundwater model that accounts for the deep coastal confined-
shrimp can withdraw into rock openings in the aquifer during groundwater system was constructed. Previously published
periods when a pool completely drains, and later reemerge into groundwater-recharge estimates were used to construct a
the pool as the pool fills with water during a rising tide. numerical, density-dependent groundwater flow and transport
The resident population in the North Kona District of model capable of simulating changes in groundwater level,
western Hawaiʻi increased from 13,748 in 1980 to 37,875 in salinity, and discharge caused by anthropogenic factors.
2010, representing an increase of about 175 percent (State of
Hawaiʻi, 2001, 2011). In 1978, the year of KAHO authoriza- Setting
tion, the lands immediately surrounding KAHO were unde-
veloped and zoned for conservation purposes; at present, most The island of Hawaiʻi, the largest of the Hawaiian
surrounding lands are either developed, or zoned for indus- Islands, has an area of about 4,030 mi2 (Juvik and Juvik,
trial, commercial, or residential use. Numerous dry wells near 1998) between latitude 18º54’–20º17’ N. and longitude
KAHO reflect the need to control surface runoff and protect 156º04’–154º48’ W. (fig. 1). The island is formed primarily
developed areas from flooding (fig. 2). The urbanization of by the shield-stage volcanic rocks of Mauna Loa and Kīlauea
the North Kona District is increasing the need for additional volcanoes and the shield- and postshield-stage volcanic
drinking and nonpotable (irrigation) water. KAHO’s water rocks of Kohala, Hualālai, and Mauna Kea volcanoes (fig. 3;
resources may be affected by existing and proposed ground- Langenheim and Clague, 1987). Much of the western (Kona)
water withdrawals and injections of high-salinity water in the part of the island is formed by volcanic rocks from Hualālai
surrounding area. and Mauna Loa volcanoes (Stearns and Macdonald, 1946).
In a freshwater-lens system, increased withdrawals (all Although KAHO is the primary area of interest, the larger
other factors being equal) will result, in the long term, in a study area for the modeling analysis is within the Keauhou
decline in water levels, a rise in the transition zone between aquifer system as defined by CWRM.Setting 5
160° 158° 156°
Upolu
Point
22° HAWAIIAN
Kaua‘i
ISLANDS
Hāwī Ni‘ihau
Moloka‘i
O‘ahu
Maui
Waipi‘o Lāna‘i
Bay 155°30’
Kohala PAC Kaho‘olawe
IFI
20° C
Honoka‘a OC
EA Map
5,480 ft N area
Hawai‘i
Kawaihae Pa‘auilo
Bay Waimea
20°
Waikoloa
Honomū
156°
Mauna Kea
13,796 ft Pāpa‘ikou
Hilo 155°
Wainaku Bay
Keahole Hualālai
Point Kalaoa Hilo
8,271 ft
KALOKO- Kealakehe
HONOKŌHAU Kea‘au
NATIONAL
HISTORICAL Kailua
PARK State Keauhou aquifer-
Kaiwi system boundary Mountain View
Point Keauhou
Cape
Pahoa Kumukahi
19°30’ Captain Cook
13,679 ft
Kealakekua
Bay Mauna Loa
Kīlauea
Kealakekua fault system
0 5 10 15 20 MILES
0 5 10 15 20 KILOMETERS
Pāhala
EXPLANATION
Alluvium, landslide deposit, fill Mauna Loa volcano
Nā‘ālehu Pyroclastic deposit Kau Basalt
Caldera wall rocks Kahuku Basalt
19°
Volcanic vent Ninole Basalt
Kohala volcano Kīlauea volcano
Hāwī Volcanics Puna Basalt
Kalae
Pololū Basalt Hilina Basalt
Mauna Kea volcano Regional pyroclastic deposit—
Laupāhoehoe Volcanics Modified from Wentworth (1938a)
Hāmākua Volcanics Generalized rift zone—Approximately
located on the basis of vents
Hualālai volcano
Base modified from U.S. Geological Survey National Fault
Hydrography Dataset, 1:24,000 scale. Hualālai Volcanics
Universal Transverse Mercator projection, zone 4, Well with trachyte, ash, or artesian
North American Datum of 1983 conditions
Figure 3. Map of the island of Hawaiʻi, Hawaiʻi, showing generalized surficial geology and geologic features (modified from Wentworth, 1938a;
Langenheim and Clague, 1987; Sherrod and others, 2007).
men20-4011_fig036 Numerical Simulation of Groundwater Withdrawal and Injection in Kaloko-Honokōhau National Historical Park
The Keauhou aquifer system is bounded on the north- to the mountain slopes, commonly resulting in precipitation in
east by the northwest rift zone of Hualālai volcano (hereafter the afternoon hours. In the Kona area, rainfall is greater during
referred to as Hualālai), on the southeast by the approximate the summer months (May through October), characterized by
surface contact between volcanic rocks from Hualālai and more intense heating and persistent trade winds, than during
Mauna Loa, and on the west by the coast. Thus, the Keauhou the winter months (November through April). This seasonal
aquifer system mainly is formed by volcanic rocks from pattern of rainfall in the Kona area differs from other areas in
Hualālai (fig. 3). Within the Keauhou aquifer system, land- Hawaiʻi (particularly dry areas), which have greater rainfall
surface altitudes range from 0 ft at the coast to about 8,271 ft during the winter months.
near a volcanic vent within the northwest rift zone of Hualālai. Mean annual rainfall for the period 1978–2007 in the
Below an altitude of 1,000 ft, the land-surface slopes range Keauhou aquifer system was less than 15 inches (in.) at the
from nearly flat in coastal areas to about 9 degrees near the coast near the northwest boundary, between 15 and 25 in.
southern part of the area; between altitudes of 1,000 and within KAHO, greater than 50 in. between altitudes of about
3,000 ft, slopes generally range from 6 to 9 degrees; above an 1,000 and 3,000 ft, and less than 35 in. above an altitude of
altitude of 3,000 ft, slopes commonly exceed 9 degrees but are 5,000 ft (fig. 4) (Giambelluca and others, 2013).
less than 5 degrees in places, particularly toward the southern
part of the Keauhou aquifer system near the saddle between Geology
Hualālai and Mauna Loa. KAHO lies on the west flank of
Hualālai below an altitude of about 80 ft. The overall geology of Hawaiʻi has been described by
numerous investigators (for example, Stearns and Macdonald,
Climate 1946; Macdonald and others, 1983; Stearns, 1985).
Langenheim and Clague (1987) described and renamed
Near Keahole Point, north of KAHO, computed climate the stratigraphic framework of volcanic rocks on Hawaiʻi.
conditions for 1981–2010 (Arguez and others, 2011) indicate Volcanic rocks from Hualālai mainly are relevant to this study.
an average annual temperature of 77.4 degrees Fahrenheit (ºF;
25.2 degrees Celsius [ºC]), and average monthly temperatures Extrusive Volcanic Rocks
ranging from 73.8 ºF (23.2 ºC) in February to 80.4 ºF (26.9 ºC)
in August (National Climatic Data Center, 2013b). During Hualālai is one of five volcanoes that form the island of
1981–2010, minimum monthly temperatures near Keahole Hawaiʻi (fig. 3) and is inferred to have started forming about
Point have dropped below 65 ºF (18.3 ºC) and maximum 800,000 years ago (800 ka; Moore and others, 1987; Moore
monthly temperatures commonly exceeded 85 ºF (29.4 ºC) and Clague, 1992; Yamasaki and others, 2009). The summit
(National Climatic Data Center, 2013a). Below an altitude of Hualālai, at an altitude of 8,271 ft, is about 10 mi east of
of 3,900 ft, the average temperature lapse rate in Hawaiʻi is KAHO. Extrusive volcanic rocks cover the surface of Hualālai
estimated to be 3.6 ºF per 1,000 ft, and above an altitude of and consist mainly of lava flows that effused from fissures
3,900 ft, the average temperature lapse rate decreases to 3 ºF and vents. Extrusive volcanic rocks also include pyroclastic
per 1,000 ft (Nullet and Sanderson, 1993). material, such as ash and cinder, which generally forms less
Climate within the Keauhou aquifer system is very than 1 percent of the mass of Hawaiian volcanoes (Wentworth
diverse. Using the Koeppen classification, which is based and Macdonald, 1953).
mainly on temperature, climate is classified as hot semi-arid The southeastern part of Hualālai is covered by younger
desert near the coast (including KAHO); humid tropical lava flows from Mauna Loa volcano (Lipman and Coombs,
(continuously wet) between altitudes of about 1,000 and 2006). About 55 percent of the volcanic rocks on the surface
3,000 ft; and temperate (continuously wet warm temperature) of Hualālai are less than 3,000 years old (Moore and others,
above an altitude of 3,000 ft (Juvik and others, 1978). 1987). The most recent flow from Hualālai is an 1801 flow
Using the Thornthwaite climatic classification, which north of KAHO that destroyed villages and filled coastal
considers the relation between precipitation and potential fishponds (Kauahikaua and Camara, 2000). Surface volcanic
evapotranspiration, climate is classified mainly as subhumid rocks in KAHO are 10,000–1,500 years old (Wolfe and
to semiarid, except between altitudes of about 1,000 and 3,000 Morris, 1996).
ft where climate is classified as humid (Giambelluca and Shield-stage tholeiitic basalt built most of Hualālai but
Sanderson, 1993). is not exposed on the land surface. Tholeiitic rocks have
Rainfall in the Kona area is affected by topography been recovered from dredges and submersible dives (Clague,
and ocean-land temperature and pressure gradients related 1982; Moore and Clague, 1987, 1992; Garcia and others,
to heating of the west-facing slopes of Hualālai and Mauna 1989; Clague and Moore, 1991; Lipman and Coombs, 2006;
Loa. In the Kona area, heating of the land surface during the Hammer and others, 2006; Yamasaki and others, 2009) and
day generates sea breezes that may converge with the trade from drilled wells (Moore and others, 1987; Clague, 1987). A
winds diverted around the high volcanoes, producing a zone of change in lava chemistry from tholeiitic basalt to trachyte and
convergence on west-facing slopes (Giambelluca and others, alkalic basalt about 130 to 100 ka marks the transition from
1986). The sea breezes bring moisture-laden air from offshore the shield stage to the postshield stage of Hualālai.Setting 7
The entire subaerial surface of Hualālai consists the flanks of Hualālai, mapped dips of the Hualālai Volcanics
of postshield-stage alkalic basalt, with minor hawaiite typically are about 2 to 15 degrees (Stearns and Macdonald,
and trachyte, collectively named the Hualālai Volcanics 1946). Trachyte lavas, which are rare in Hawaiʻi, are exposed
(Langenheim and Clague, 1987; Wolfe and Morris, 1996). On at the surface on Hualālai and also have been found in rock
160° 158° 156°
Upolu
Point
22° HAWAIIAN
Kaua‘i ISLANDS
Ni‘ihau
50 Moloka‘i
65 O‘ahu
80 Lāna‘i
Maui
Waipi‘o
0
155°30’
12
Bay
140
Kohala PAC Kaho‘olawe
IFI
80 20° C
5,480 ft OC
10 EA Map
0 N area
0
Hawai‘i
10
Kawaihae
80
100
Bay
6
505
20°
120
15
35
14
18
0
0
160
10 0
16
20
0
15 240
25 15 Mauna Kea
14
28
10 0
0
156°
25
13,796 ft
0 Hilo 155°
26 Bay
Keahole Hualālai
140
Point
160
8,271 ft
180
200
220
240
240
KALOKO-
120
50
100
HONOKŌHAU
NATIONAL
80
35
HISTORICAL 50
65
PARK
State Keauhou aquifer-
35
system boundary
25
50
Cape
15 Kumukahi
10
140
19°30’
13,679 ft
120
100
Kealakekua
Bay Mauna Loa
Kīlauea
20
65
65
180
0
160
14
1
80 00
0
80
35
80
65
50
65
80 0 5 10 15 20 MILES
100 0 5 10 15 20 KILOMETERS
50
35
25
35
35
25 EXPLANATION
Annual rainfall, in inches
19°
300 25 Line of equal mean annual rainfall,
240 in inches— Contour interval varies
200
160
Kalae 120
80
65
Base modified from U.S. Geological Survey National Hydrography 50
Dataset, 1:24,000 scale. Universal Transverse Mercator projection, 35
zone 4, North American Datum of 1983 25
15
10
0
Figure 4. Map of the island of Hawaiʻi, Hawaiʻi, showing mean annual rainfall distribution during 1978–2007 (modified from
Giambelluca and others, 2013).8 Numerical Simulation of Groundwater Withdrawal and Injection in Kaloko-Honokōhau National Historical Park
samples from wells drilled into Hualālai (Cousens and refraction data and indicated that a dense structure with high
others, 2003; Bauer, 2003). Trachyte lavas from Hualālai seismic velocity lies parallel to the Kona coast in the vicinity
have estimated ages of about 114–92 ka (Cousens and others, of the positive gravity anomaly and probably represents a
2003). The shift from trachyte to alkalic basalt eruptions was buried rift zone. The buried rift may extend south of surface
marked by an increase in eruption rate (Moore and others, exposures of Hualālai volcanic rocks (Lipman and Coombs,
1987; Cousens and others, 2003). Trachyte lavas generally 2006). On the basis of the presence of an intervening gravity
are very viscous and form thick and massive flows. Trachyte saddle, Lipman and Coombs (2006) indicated that this buried
lavas may be hydrologically important because they have Hualālai rift probably does not merge with the south rift zone
low permeability and may form confining units that impede of Mauna Loa, as interpreted by Holcomb and others (2000).
groundwater movement.
Pyroclastic deposits consist of fragmental material, Sedimentary Deposits
including cinder and ash, that originated from volcanic
eruptions and were deposited from the air. Pyroclastic deposits Within the study area, terrestrial sedimentary deposits
vary in fragment size, with coarse material typically deposited on the relatively youthful subaerial surface of Hualālai are
closer to the source eruption than fine material. Fine ash limited. Thin calcareous sand and gravel deposits form
deposits composed of material less than 0.08 in. (2 millimeters) beaches and overlie volcanic rocks in coastal areas, parti-
in diameter can be widespread and blanket the land surface cularly in the northern part of the study area, including
at large distances from the source eruption. However, wind KAHO (see for example, Richmond and others, 2008).
and rain can erode ash deposits, especially if the deposits are Marine sedimentary deposits associated with coral reefs
recent and thin. On the island of Hawaiʻi, ash deposits range in generally are preserved only after a volcano has completed
thickness from less than 1 ft to greater than 10 ft (Wentworth, its shield-building stage because the high frequency of lava
1938a). Volcanic ash can be weathered and consolidated flows tends to inhibit reef development (Moore and Clague,
into tuff, which may have low permeability. Laboratory 1992). Hualālai is in the post-shield stage and coral reefs have
permeability tests of five weathered-ash core samples from developed offshore in places. Coral reefs and sand deposits
Oʻahu indicated hydraulic-conductivity values ranging from have been mapped immediately offshore of KAHO lands
0.002 to 300 feet per day (ft/d; Wentworth, 1938b). (Gibbs and others, 2007) and also can be found in coastal
Wentworth (1938a) mapped tuff deposits over large areas areas outside of KAHO. Modern living coral generally is
of Hualālai (fig. 3). Tuff deposits in the subsurface can be found in depths shallower than about 30 meters (m; Moore
hydrologically important if they are spatially continuous and and Fornari, 1984). Moore and Clague (1992) describe six
widespread by forming low-permeability perching or confin- submerged reefs north of the study area at depths of about 500
ing units that impede groundwater flow. A number of wells to 4,400 ft. The shallowest of these submerged reefs (500 ft)
on Hualālai have penetrated trachyte flows (Bauer, 2003), ash extends for about 60 mi along the west coast of Hawaiʻi,
layers, or undescribed low-permeability layers that potentially from the northern tip of the island to just south of Kealakekua
can form perching or confining units in the subsurface (fig. 3). Bay (Moore and Clague, 1987). This buff-colored, massive
coralline limestone reef, which drowned about 13 ka, is draped
Intrusive Volcanic Rocks by about 50 lava flows, which in turn have subsequently been
covered by additional reef material (Moore and Fornari, 1984;
Intrusive volcanic rocks include those rocks, such as Moore and Clague, 1987). The drowned reef at an altitude of
dikes, that formed by magma that cooled below the ground –500 ft may be correlative with the Kahipa-Mamala –350-ft
surface. Dikes associated with the rift zones of Hualālai shelf off Oʻahu (Stearns, 1978; Moore and Fornari, 1984),
are not exposed at the surface, but cinder and spatter cones which would indicate that northwest Hawaiʻi has subsided
within the rift zones are evidence of the presence of dikes about 150 ft relative to Oʻahu over the past 13,000 years.
that are related to the subsurface system of magma supply The geologic log of a well drilled about 2 mi southeast
to these volcanic vents. Dikes are hydrologically important of KAHO (well 3959–01, Kamakana) within the study area
because they have low permeability and, because of their low indicates a calcareous beach sand between altitudes of about
permeability, tend to impound groundwater behind them to –1,073 and –1,088 ft (Bauer, 2011). The depth of the beach
higher levels than would exist in the absence of dikes. sand is between the depths of two drowned reefs (–500 ft and
The primary rift zones of Hualālai trend northwest and –1,400 ft, respectively) described by Moore and Clague (1992).
south-southeast, emanate from near the summit of the volcano,
and are marked by numerous cinder and spatter cones. A third, Faults
less well-defined rift zone extends north from the summit
(Macdonald and others, 1983; Moore and others, 1987). A Gravitational failure of the unbuttressed submarine west
positive gravity anomaly exists near, but is somewhat west flanks of Hualālai and Mauna Loa produced a large region of
of, the surface expression of the south-southeast rift zone of landslide deposits, including the North Kona slump and Alika
the volcano (Kinoshita and others, 1963; Kinoshita, 1965; debris avalanches (Lipman and others, 1988; Moore and others,
Kauahikaua and others, 2000; Flinders and others, 2013). 1989, 1994; Lipman and Coombs, 2006; Cannon and others,
Zucca and others (1982) analyzed gravity and seismic- 2007). The submerged Mahukona volcano may have buttressedYou can also read