Norwegian Cruise Line Holdings LTD (NCLH)
←
→
Page content transcription
If your browser does not render page correctly, please read the page content below
Norwegian Cruise Line
                Holdings LTD (NCLH)
                                          INVESTMENT REVIEW
                                               JUNE 2018
                                MASSIF CAPITAL, LLC | New York, NY

Disclaimer: As of the publication date of this report, Massif Capital, LLC and its affiliates (collectively, “Massif Capital”),
maintain a short position in NCLH. Massif Capital stands to realize gains in the event the price of the stock decreases.
Following publication, Massif Capital may transact in the securities of the Company. All expressions of opinion are subject to
change without notice, and the Authors do not undertake to update this report or any information herein. Please read our
full legal disclaimer at the end of this report.

     Downloaded from www.hvst.com by IP address 192.168.96.10 on 02/20/2022
Norwegian Cruise Line Holdings LTD (NCLH)                                                                  Massif Capital, LLC

Investment Thesis: Norwegian Cruise Line Holdings LTD (NCLH) is the third largest cruise line operator in
the world. NCLH is currently engaged in a significant expansion of their fleet at the same time as an
industrywide expansion even though they fail to operate their existing fleet as economically as their
competitors. Additionally, despite the socially conscious focus that management advertises, margins are
dependent on employing cheap labor with unregulated wages, taking advantage of tax havens and a lack
of meaningful regulatory oversight. All of this is occurring within the context of a business model,
employed throughout the industry, that is suggestive of a fixed cost structure that is at odds with product
pricing.

The current market price and management optimism are based on an extrapolation of recent growth
trends far into the future. Our research suggests this is an error in management judgement. We believe
there is ample evidence to support the conclusion that global demand is unlikely to keep pace with cruise
ship capacity between now and 2025 1. This is problematic for NCLH who has historically relied on demand
growth to drive revenue. NCLH will be forced to raise ticket prices on price sensitive consumers by more
than 8% a year to keep pace with its current valuation. There is no precedent to suggest that is possible.
The negligible headroom in margins will provide little relief to soften the blow as rising interest rates and
oil prices continue to apply downward pressure. NCLH is highly levered with significant capital
commitments that leave no room for execution/operational error.

A reverse DCF analysis suggests that that the current market price is justified only if NCLH manages to
grow revenue by an average of 12% a year for the next decade while growing free cash flow at 8.6% a
year over the same period. Revenue growth of less than 4% a year produces a valuation of less than $16;
flat revenue growth, or a fall in revenue analogous to 2008/09, would be troubling. We estimate that
NCLH has an intrinsic value of less than $26 per share, suggesting a return from shorting the stock of
more than 51% at current prices.

Business Description: NCLH is a holding company incorporated in Bermuda, has executive offices in
Miami, Florida, and operates cruise ships that fly Marshall Islands or Bahama flags. The firm has three
operating subsidiaries (Norwegian Cruise Line, Oceania Cruises and Regent Seven Seas Cruises), 26 ships
and approximately 54,000 berths. 2

    Table 1: NCLH Operating Segments
                              # of   Approx. Avg.                           2017 Gross
    Operating Segment                                                                             Experience | Brand
                             Ships     Berths                                Revenue
    Norwegian Cruise Line      16      ~3,000                                  72%                  Contemporary
    Oceania Cruises            6       ~1,000                                  15%                    Premium
    Reagent Seven Seas         4        ~650                                   13%               Premium All-inclusive

NCLH was founded in 1966 as the Norwegian Caribbean Line and gained popularity for their freestyle
cruising, which meant no set times or seating arrangements for meals and no formal attire required; a
stark contrast to other cruise liners plying their trade at the time. In January 2008, Apollo Global
Management acquired 50% of the outstanding ordinary shares of Norwegian Cruise Line and assumed
control of the Board. Apollo brought the company public in January 2013 and sold a premium cruise line,
Prestige Cruise International, that they owned to NCLH in a cash/stock deal worth $3.025 billion in 2014.

1
  Based on a review of the Cruise Ship Order Book produced by Cruise Industry News in June 2018 capacity is likely to increase by
33% by 2025.
2 A berth is typically defined as a cabin that can hold 2 or more people.

                                                                                                                   Page 1 of 13

       Downloaded from www.hvst.com by IP address 192.168.96.10 on 02/20/2022
Norwegian Cruise Line Holdings LTD (NCLH)                                                                    Massif Capital, LLC

The acquisition extended the NCLH brand into the premium cruise market and firmly established the
company as one of the three largest cruise liners in the world.

At the current time the cruise industry is highly consolidated, a transition that has occurred over the last
20 to 30 years to the benefit of the industry’s largest incumbents. Despite the existence of 55+ cruise ship
brands, close to 80% of global market share is held by three companies: Carnival Cruise Line (CCL), Royal
Caribbean International (RCL) and Norwegian Cruise Line (NCLH). As measured by market share, CCL is
the largest with a $46 billion market capitalization, followed by RCL at $23 billion and NCLH at close to
$12 billion.

Regulatory Framework: The current cruise industry business model depends on a lack of proper
international regulatory oversight to maintain margins. Ships, in addition to acting as a mode of transport,
are a collection of restaurants, hotels and theme parks, yet they are not subject to oversight by regulatory
agencies like the FDA, FAA or Department of Labor (or any international equivalent) that would typically
provide management a meaningful incentive to protect customers or employees. The primary governing
body for the cruise industry is the International Maritime Organization (IMO), a specialized agency of the
United Nations. The IMO has the power to impose regulations on the industry; however, they do not have
the power to create laws and have no ability to enforce.

Regulatory compliance and enforcement falls on the governments of the nations in which ships are
registered, the Bahamas and the Marshall Islands in the case of NCLH. In both cases, ship registration
(referred to as flagging) makes up a significant percentage of total government revenue, neither is
incentivized to either enforce rules or add regulations. The industrywide 5-year average income margin of
11%, achieved within the context of an industrywide effective tax rate of less than 3% and below
minimum wage salaries for on-board employees, suggests the business model is exposed to significant
unpriced political risk. Please see Appendix A for further details.

Business Model Issues: Even in the absence of unpriced political risk, the cruise industry business model
lacks endurance, especially in the case of NCLH. The fixed costs associated with running 1,000+ berth
ships are so high that cruise companies 3 often, counterintuitively, lower ticket prices as a departure date
approaches. 4 Firms do this to maximize revenue from each ship as ticket prices alone do not cover
operating costs. On-board passenger spend is necessary to maintain solvency. Firms are highly
incentivized to keep their occupancy rates at, or greater than, 100%. 5 What this means is that
management can grow revenue in only two ways: either through the addition of a new ships/berths or
through increasing prices across the board (tickets and on-board amenities). 6 There is little slack in the
system to sell more tickets.

3
  In reality, it is likely a combination of travel agents and cruise companies lowering the prices. Travel agents have been the
primary conduit between the cruise company and the consumer for several years. One of the largest variable costs associated
with running a ship are commissions and transportation associated with incentivizing travel agents to sell tickets and to bring the
consumer to the port of call.
4
  For a breakdown of operating costs, please see Appendix B.
5
  Occupancy rates are the ratio of passenger cruise days to capacity days. A percent more than 100% indicates that three or more
passengers occupied some cabins.
6
  It is worth noting that the price elasticity for demand is high in the cruising industry, making price increases a problematic
course of action. 33% of cruisers surveyed who have taken a cruise in the past three years, have a household income less than
$80K (CLIN 2018 Cruise Industry Outlook, 2017). Cruising is widely considered a leisure good/service. Leisure products have also
historically displayed higher price elasticity then consumer staples, for example.

                                                                                                                    Page 2 of 13

       Downloaded from www.hvst.com by IP address 192.168.96.10 on 02/20/2022
Norwegian Cruise Line Holdings LTD (NCLH)                                                               Massif Capital, LLC

In 2017, NCLH ticket sales accounted for 70% of total gross revenue with the remaining 30% attributed to
on-board sales. The importance of on-board revenue cannot be overstated. In 2017, 94% of NCLH
operating income was attributable to onboard revenue. This compares to 90% of industry operating
income being attributable to onboard revenue. During our conversations with NCLH we learned that
despite the importance of on-board revenue, management does not in fact know what the actual division
of revenue sources are, they simply estimate it.

This is a concerning situation, especially given the advent of bundling, an industry practice in which on
and off-board experiences/amenities/dinning etc., are included in the initial ticket price, in addition to the
cost of a berth. Management estimates that approximately 50% of the on-board revenue is booked
before the cruise. Furthermore, management believes on-board revenue jumped roughly 10% in 2017 vs.
the previous year. Oddly enough, this jump coincides with a stronger push by management to sell
bundled ticket packages, which would seem to reduce on-board spend, rather than increase on-board
spend. 7 The firm has assured us we are incorrect in this belief and have great confidence that bundling
does not cannibalize on-board revenue. When we probed this claim further, it turned out that NCLH did
not just have evidence they were not willing to share, but rather noted that their accounting system did
not have the request detail or sophistication to determine the exact location of on-board spend (whether
it be at the point of purchase or on-board).

Strong revenue growth masks the issue of transparency nicely. However, should this trend reverse, the
opacity of revenue sources, especially given the importance of on-board revenue to feed margins, is
particularly problematic. NCLH cannot afford to lose onboard revenue or operate at less than full
capacity, meaning ships must somehow attract 100%+ occupancy and maintain price integrity by selling
tickets that increasingly cover a wider spread of services and decrease in price as time goes on.

Why an Opportunity Exists: NCLH is coming off a record year of revenue growth, the booking curve 8 is
extended and management optimism is high. New ship orders are significant and industry enthusiasm
about untapped demand in China is palpable. NCLH is currently priced as if the growth trends of the last
eight years are sustainable long into the future. There are significant head winds for the firm though. Not
only is there unprecedented supply growth around the corner but there is little evidence to suggest that
management has figured out how to efficiently convert record high revenue per cruise day into real
returns. Furthermore, margins are likely to come under increased pressure due to rising costs making the
challenge of achieving real returns even more significant.

(1) Unprecedented supply growth

Looking ahead, the industry is soon to be confronted with 105 new ships coming online by 2025,
expanding the industries current capacity by ~33%. 75% of those ships will come on line in the next four
years. By 2022 the industry will have experienced 8 consecutive years of global fleet berth expansion of
greater than 5% a year. 9 For the ratio of berths to annual passengers to remain in line with the historical

7
  There is an interesting behavioral argument to be made here that NCLH relies on to support this claim. NCLH states that the
more a passenger spends on upfront ticket/bundled services, the more they are willing to spend on-board. We have no evidence
to refute this statement; however, we believe the burden of proof should be on NCLH to justify this claim.
8
  The booking curve is a function of how many days in advance of a departure date a customer purchases their ticket. To
maximize revenue, NCLH is always looking to ‘extend’ the booking curve. Contraction of the booking curve is problematic not
only because it would be a signal of weakening demand, but because NCLH would be forced to lower ticket prices to keep
occupancy rates greater than 100%.
9
  Royal Caribbean 2017 10K, Cruise Industry News Cruise Ship Order Book 2018

                                                                                                                Page 3 of 13

       Downloaded from www.hvst.com by IP address 192.168.96.10 on 02/20/2022
Norwegian Cruise Line Holdings LTD (NCLH) Massif Capital, LLC
ratio dating back to 2007, the number of
cruise passengers needs to increase by
more than 40% or roughly 11 million
passengers.
Much of the industry is pinning its hopes
on China to fill this new supply. At times
during the last five years it certainly
appeared that China could produce 11
million additional passengers without
breaking a sweat. According to Goldman
Sachs, Chinese Cruise passenger numbers
grew 70% a year during the period 2012
to 2016. In 2018, though, the number of
Chinese cruise passengers is expected to
shrink by nearly 400,000 or 14%. Royal
Caribbean’s President of Chinese
Operations Zinan Liu believes that 2019 could be worse. 10 In the absence of a fast-growing Chinese
cruising population it is unclear where the passengers to fill new ships will come from given that global
cruise passengers excluding China have grown at a 5-year average CAGR of just 2% 11.
Should this trend hold, the industry will be 6.6 million passengers short of maintaining current capacity
levels with the new volume of ships in the next two years. By 2025, the imbalance will have grown to 10.5
million. If China reverts to the previous 5-year growth rate (which doubles global CAGR from 2% to 4%
over the same time period), the industry will be between 1.5 million and 3.2 million passengers short
every year for the next 8 years. 12
NCLH has six ships on order for delivery through 2025, adding roughly one ship a year for the next six
years. This will expand total berth capacity by 25% at a cost of roughly $6.13 billion excluding interest on
associated debt. NCLH also has options for two additional ships 13 for delivery in 2026 and 2027 with a
total capacity of 6,600 passengers, which would be an increase of total fleet capacity of 37% in nine years.
We believe this level of fleet expansion, in the context of the global fleet expansion discussed above is
problematic, especially given NCLH’s struggle to convert revenue into free cash flow. NCLH can ill afford
to have demand lag new supply, an outcome that looks likely.
10
“China cruises struggle to make it through political squalls”, December 2017
11
Of principle concern is the “charter” model travel agents employ in China. Agencies will ‘charter’ a full ship and sell tickets
direct to customers leaving little room for the cruise industry to influence a customer’s buying options and limiting ticket
bundling opportunities. This is a telling sign of how reliant the industry is on getting customers to maximize spending. High
demand is not sufficient for success; it must be high demand coupled with the ability to raise prices through bundled
experiences, a key missing ingredient in China currently.
12
We have excellent visibility into berth growth rate through 2025 because of the current industry orderbook being well
documented. Holding the historical annual passenger to berth ratio constant (a ratio that has been remarkably consistent since
2007), we can estimate what the global passenger count from 2018-2025 should be. We then evaluate the global growth rate of
passengers from 2012-2017. If the global CAGR (including and excluding China) holds steady until 2025, we can evaluate the
difference between passengers required to keep per year berth usage ratio constant and passengers available from the global 5-
year growth rate.
13
Management has suggested they will decide about the additional ships for delivery in 2026 and 2027 within the next six
months.
Page 4 of 13
Downloaded from www.hvst.com by IP address 192.168.96.10 on 02/20/2022Norwegian Cruise Line Holdings LTD (NCLH) Massif Capital, LLC
Furthermore, as seen in Figure 2, NCLH
historically has derived approximately
63% of their annual revenue growth by
adding berths, with the remaining 37%
contributed by price increases. If demand
fails to keep pace with the sharp increase
in supply, NCLH will be confronted with a
new operating paradigm, needing to
generate a majority of their revenue
growth through ticket price increases as
opposed to supply growth. Of their peers,
NCLH already attracts a higher price per
passenger cruise day suggesting that
there may be little headroom to inflate
further. Additionally, even if global
consumer demand balloons by >40% and
NCLH manages to fill 100% of the capacity
coming online through 2025, their current valuation requires them to grow ticket (and onboard) prices by
an average of 8% a year for a decade (see Valuation for further discussion). Not only would that be
unprecedented, it seems awfully daunting for a price-sensitive consumer.
(2) Struggles Converting Revenue into Returns.
The most pressing concern for NCLH is the firm’s inability to convert their industry leading revenue per
passenger cruise day into cash flow. For the last five years NCLH has managed to increase its revenue
earned per passenger cruise day from $225 to $291, an increase of 29.3%, at the same time CCL and RCL
have both maintained roughly flat revenue earned per passenger cruise day. 14 Despite the robust growth
NCLH struggles to produce meaningful free cash flow, and is reliant on what amounts to an interest free
loan by passengers who are required to pre-pay for vacations to finance working capital expenses.
Table 2: Revenue Per Passenger Cruise Day Table 3: Free Cash Flow Per Passenger Cruise Day
2013 2014 2015 2016 2017 Trend 2013 2014 2015 2016 2017 Total
NCLH 225 229 271 277 291 NCLH -35 -24 -5 8 12 -44
CCL 209 209 203 205 213 CCL 9 11 29 26 29 104
RCL 224 220 215 211 219 RCL 18 -2 9 1 53 79
Trends in many of these numbers appear to be heading in the right direction. Digging deeper reveals that
one of the key drivers of the improving Free Cash Flow Per Passenger Cruise Day numbers are cashflow
statement adjustments that obscure the cashflow generating potential of pure ship operations,
specifically cash from customer advances, 15 share based compensation, and various write offs related to
14
NCLH has a larger share of ships attributable to premium products than their peers RCL and CCL. As such, their revenue per
capita figure (net revenue yield) is higher. NCLH appears to be setting the stage for a lower net revenue yield moving forward.
While boasting their high NRY in comparison to their peers at the beginning of the 2018 investor day presentation, the very last
presentation of the day featured the CEO setting the stage for lower NRY moving forward as the ships being brought online are
‘contemporary’ products and will lower their ratio of total premium products, bringing down NRY. NCLH describes this as “the
conundrum”; we believe it’s a poor excuse (and poor word choice) to point shareholders towards revenue as opposed to ability
to convert revenue into free cash flow.
15
This is not an operational cashflow, this is a financing item and a liability.
Page 5 of 13
Downloaded from www.hvst.com by IP address 192.168.96.10 on 02/20/2022Norwegian Cruise Line Holdings LTD (NCLH) Massif Capital, LLC
financing fees. When adjustments for all these items are made the positive trend in the NCLH cash flow
profile over the last fewer remains, but ship operations alone remain cashflow negative operations.
Table 4: Adjusted CFO Per Passenger Cruise Day Table 5: Adjustments as a % of Reported CFO
2013 2014 2015 2016 2017 2013 2014 2015 2016 2017
NCLH 32 43 49 58 72 NCLH 24% 9% 25% 18% 16%
CCL 39 43 54 59 60 CCL -2% 4% 9% 8% 8%
RCL 39 47 53 57 63 RCL 3% 1% -5% 9% 12%
Table 6: Adjusted FCF Per Passenger Cruise Day
2013 2014 2015 2016 2017
NCLH -45 -28 -21 -4 -2
CCL 10 9 24 21 24
RCL 17 -2 11 -5 49
Since 2006, basic free cash flow (defined here as Cash Flow from Operations Less Capital Expenditures
with no adjustments) has been negative more often than positive (8 out of 12 years). On a rolling five-
year basis, NCLH has not generated a positive Free Cash Flow Return on Gross Property, Plant and
Equipment. We have chosen to look at Free Cash Flow Return on Gross Property on a rolling five-year
basis because five years is management’s stated timeframe for achieving a cash on cash payback for
newbuilds. 16 Complicating NCLH’s cashflow situation further is fact that Operating Cash Flow Return on
Gross PP&E also trails both RCL and CCL by a significant margin.
Table 7: Return on Gross Investment
2017 Peer
2012 2013 2014 2015 2016 2017
Average
Free Cash Flow Return on Gross Investment -8% -10% -10% -5% -5% -3% 14%
Operating Cash Flow Return on Gross
21% 25% 22% 25% 30% 36% 57%
Investment
When viewed through the lens of economic value add 17, the reason that NCLH can earn more revenue
per cruising day but generate an inferior real return compared to their peers becomes apparent.
Compared to RCL and CCL, NCLH is the only company with a cost of capital 18 that exceeds their return on
invested capital. CCL and RCL do not generate far superior returns, each earning approximately 1% on top
of their cost of capital, but NCLH will have a hard time building a sustainable business if their return on
investment continues to trail their cost of capital.
The ongoing challenge of converting revenue into cash flow is going to become even more problematic
with new capacity flooding the market. We believe management is aware of this issue, which is one the
reasons they chose to promote “Adjusted Free Cash Flow.” In our Free Cash Flow calculations above we
16
NCLH 2018 Investor Day Presentation.
17
Economic Value Add is a framework for thinking about a company’s results by measuring the residual wealth creation of the
business after accounting for cost of capital, the formal EVA analysis methodology was designed Stern Value management. In
this instance we forgo a full EVA analysis in favor of a short form analysis we believe is as telling as a full EVA analysis but avoids
the false precision associated with the full methodology.
18
While we are not advocates for precise WACC measurements when evaluating one company, it can be useful to examine
across multiple companies utilizing the same methodology and thus controlling for any unconscious input bias.
Page 6 of 13
Downloaded from www.hvst.com by IP address 192.168.96.10 on 02/20/2022Norwegian Cruise Line Holdings LTD (NCLH) Massif Capital, LLC
have made several adjustments that many may disagree with, and we recognize that. We do not believe
that the same can be said of NCLH management’s “Adjusted Free Cash Flow” calculations. NCLH
management calculates “Adjusted Free Cash Flow” as CFO, minus newbuild and maintenance CAPEX plus
proceeds from ship construction financing (otherwise known as proceeds from debt). It is worth noting
that over the last four years “Proceeds from Ship Construction Financing Facilities” has accounted for
101.7% of “Adjusted Free Cash Flow”. Put another way, all the “cash” management is pitching to the
public as free cash flow is borrowed money. 19
This adjustment is inappropriate. We fail to arrive at any explanation other than to mislead shareholders
by masking their ability to generate cash. It’s unnecessary, counterproductive and speaks volumes about
managements decision to frame a narrative at the expense of investors.
(3) Operational efficiency trending in the wrong direction
Since 2014, total cruise costs per capacity day have increased by 24%. This trend is not driven by fuel
costs, which would be the most obvious culprit; it is the opposite. Excluding fuel, costs have risen by 29%
over the same period. With the sustained rise in Brent crude prices over the past six months, fuel costs
may now become an issue putting downward pressure on margins. Furthermore, to reverse the steadily
falling (albeit still above 100%) occupancy rates management has had to increase spending on marketing
expenses, a move reflective of both the firm’s need to continually raise prices and expand into new
markets.
Looking ahead, cost projections appear bleak. IMO 2020, a regulation that restricts sulfur content in
bunker fuel from 3.5% to 0.5%, is 18 months away from taking effect. Compliance requires NCLH to run
their smaller vessels (~11 of the premium Regent and Oceania brand ships) on marine gas oil because the
ships are too small to be retrofitted with scrubber hardware that reduces sulfur emissions. Marine gas oil,
as of May 2018, is 58% more expensive at spot prices than bunker fuel. Second, their larger ships (~13 of
the Norwegian vessels) will have to be retrofitted with scrubbers a process that will require the firm to
dry-dock ships.
The typical period between dry-docks for routine maintenance is five years. We do not have visibility into
the current maintenance cycles for the ships 20; however, we can confidently say that within the next 18
months, 40% of their fleet will experience a >50% increase in fuel price, and roughly 60% of the existing
fleet will need to be pulled from operations for retrofitting. 21 It is challenging to create any scenario
where costs decrease.
Financial Standing: NCLH debt levels are concerning and do not appear to be subsiding or sustainable.
Growth, in the form of new ships, is being financed entirely through debt. As of FY2017, NCLH had $6.3
billion in debt on the books, a debt to equity ratio of 1.1, with $6.13 billion in non-cancelable ship
construction commitments. Of that $6.13 billion, roughly half is related to four newbuild Leonardo Class
ships to be delivered between 2022 and 2025. Of the half associated with the Leonardo ships, roughly
$2.5 billion is borrowed via a series of term loans that have been arranged but are not yet drawn, raising
19
Adjusted Free Cash Flow numbers and calculation is pulled from the 2018 Investor Day Presentation, slides 196 and 225.
20
NCLH has communicated that they can fit a full emission scrubber retrofit into a routine maintenance dry-dock. While we
cannot dispute/verify this claim, we remain skeptical that this in fact can be accomplished. Even a small margin of error means a
ship is prevented from cruising and NCLH loses valuable revenue.
21
Ships delivered in 2018 and beyond appear to have the necessary scrubber technology installed and will likely not need to be
dry-docked to comply with IMO 2020.
Page 7 of 13
Downloaded from www.hvst.com by IP address 192.168.96.10 on 02/20/2022Norwegian Cruise Line Holdings LTD (NCLH) Massif Capital, LLC
debt levels to $8.6 billion. It is not clear where the remaining $3.6 billion of capital committed to new
builds will come from given that the firm can barely finance operations from cashflow let alone
expansion.
NCLH’s ability to finance their contractual commitments related to new builds and operating expenses
through cash generated from operations, as opposed to debt, significantly lags peers. Both RCL and CCL
have retained earnings compared to total assets that are four to five times higher than NCLH. Their self-
financing capabilities appear weak (See Table 8).
Table 8: Retained Earnings / Total Assets 2011 2012 2013 2014 2015 2016 2017
Norwegian Cruise Lines -0.08 -0.05 -0.03 0.01 0.05 0.09 0.14
Royal Caribbean 0.29 0.29 0.30 0.32 0.33 0.35 0.40 3X
Carnival 0.47 0.47 0.47 0.49 0.51 0.56 0.57 4X
Additionally, liabilities that need to be met within one year far exceed current assets that can be
monetized over the same time horizon. There is close to a $1 billion shortfall between current assets and
current liabilities, excluding customer advances which make up roughly 50% of current liabilities. The
customer advances thus act as a form of interest free loan the companies use to finance working capital
expenses. Even if the company was not embarking on aggressive supply build out, their working capital
suggests they cannot afford to pay their bills without continual debt re-issuance and/or ever-increasing
customer advances to finance ongoing operations. Should the supply/demand imbalance in future years
be anywhere close to our outlook, the volume of customer advances, and thus their value on the balance
sheet as a financing item, are susceptible to significant erosion. Should the booking curve protract, NCLH
gets squeezed on both the balance sheet and income statement. As noted in NCLH’s Q1 2018 earnings
call, management has a target leverage ratio of 3.7X, and they aim to achieve that goal not by paying
down debt but by growing earnings faster. We do not believe this is a sustainable strategy, or given the
expected growth in debt related to future contractual commitments, even possible.
Valuation: To justify the firms current market price, while holding capital expenditures as a percentage of
gross revenue at their 10-year average (24%), NCLH needs to grow revenue 13% year for a decade. We
believe this is a highly improbably scenario. Our revenue projections are a function of total berths
available and ticket prices. We have good visibility into ships on order, so our total berth figures through
2025 assume NCLH accomplish their stated capacity expansion and fill every room, on every ship, every
year 22. Given the fixed capacity pipeline, a 13% growth rate in revenue means they must increase ticket
and onboard prices 8% a year for a decade to justify their current market price. Utilizing a discounted
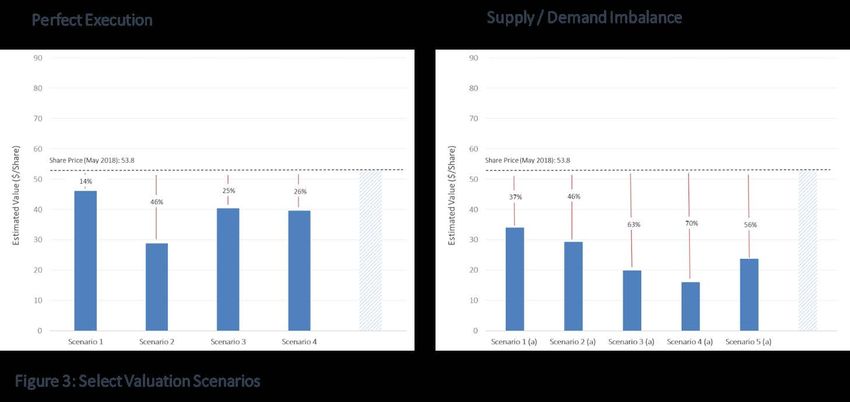
cash flow analysis, we evaluate nine scenarios. The first four scenarios reflect a perfect execution of their
new supply and the remaining five scenarios reflect some variant of a supply/demand imbalance.
Perfect Supply Execution: Scenario 1 most closely aligns with forward projections made by NCLH. Scenario
2 assumes management can increase pricing faster than their 5-year CAGR and that CAPEX as a
percentage of gross revenue is held at their 10-year average. In scenario 3, revenue is grown via price
increases in line with the average CAGR for the last three years, followed by an increase in pricing power
22
Our valuation assumption of filling 100% of supply is not the same as 100% occupancy. It is analogous to the average
occupancy rate over the period that we evaluate, or extend, pricing power (or revenue per berth). For instance, in Scenario 1
(See Table 9), we grow revenue by the historical revenue per berth growth rate from 2012-2017 of 3.72%. As such, scenario 1
occupancy is best thought of the average occupancy over the same period of ~108%.
Page 8 of 13
Downloaded from www.hvst.com by IP address 192.168.96.10 on 02/20/2022Norwegian Cruise Line Holdings LTD (NCLH) Massif Capital, LLC
to account for the hypothetical increased consumer desire to book trips on a new ship. Scenario 4
assumes moderate pricing power growth and a slowdown in CAPEX to 15% of revenue, which would be
historically inconsistent (or best in class) for the industry to-date over a period of >3 years.
An equal weighted average of the positive scenarios suggests that the stock is worth $38 per share, a 37%
discount from the May 2018 market price. It is important to recognize that all four scenarios reflect a
mere slow-down in revenue growth as opposed to flat or declining revenue. It is also interesting to
observe that a chase to grow too quickly (in the form of increased CAPEX as a % of revenue), yields the
most unattractive valuation of the four scenarios. The perfect supply execution outcomes suggest that
even if NCLH can continue to raise ticket prices and flawlessly bring $6 billion worth of supply inventory
on the market, they are still overvalued.
Table 9: Valuation Scenarios - Perfect Supply Execution
i, ii
Berth | Room Pricing iii, iv Est. Value
Scenario Revenue CAPEX
Assumptions Power ($/share)
3 years of stated firm
Translates to 7% y/y
Grown at CAPEX, 7 years of
1 Fill 100% of supply average growth for 10 46.1
3.72% CAPEX at 20% of
years
gross revenue
Translates to 9% y/y
Grown at 10 years of 24% of
2 Fill 100% of supply average growth for 10 28.8
5.2% gross revenue
years
Grown at
Translates to 7% y/y
1.36% until 10 years of 18% of
3 Fill 100% of supply average growth for 10 40.4
2021, 3.7% gross revenue
years
thereafter
4 years of 20% of
Translates to 5% y/y gross revenue,
Grown at
4 Fill 100% of supply average growth for 10 followed by 6 years of 39.6
1.36%
years 15% of gross
revenue
Notes & Sourc es of Assumptions
[i] NCLH has increased revenue per berth at a 3.72% CAGR for the last 5 years, 1.36% CAGR over the last 10 years
[ii] The avg. revenue per berth increase has been 5.2% over the last 5 years
[iii] Given stated forward CAPEX projects, CAPEX looks to be 20% of gross revenue for the next three years
[iv] The long term CAPEX as a % of revenue is 24% of NCLH, 28% for RCL and 24.7% for CCL
[v] To aid in scenario valuation variance, all scenarios are modeled with a 2% terminal growth rate and a 10% discount rate
Supply/Demand Imbalance: Value begins to erode quickly if the ability to increase prices degrades or the
supply/demand imbalance reduces occupancy. We estimate that the annual imbalance between 2018-
Page 9 of 13
Downloaded from www.hvst.com by IP address 192.168.96.10 on 02/20/2022Norwegian Cruise Line Holdings LTD (NCLH) Massif Capital, LLC
2027 is between 6% and 11%, with the former representing consistent growth and contribution from the
Chinese market and the latter representing more temperate Chinese growth contribution. 23 As seen in
Table 10 below, Scenarios 1(a) through 4(a) represent this expected adjustment and the corresponding
valuation. Holding CAPEX below their historical long-term average, and still maintaining growth in pricing
power, the outlook is grim. Robust pricing power suggests a value range between $29 and $34 dollars per
share, while a more modest growth of pricing power (their long-term average) reveals a value range
between $16 and $19 per share.
Table 10: Valuation Scenarios - Supply/Demand Imbalance
Berth | Room Pricing Est. Value
Scenario Revenue CAPEX
Assumptions Power ($/share)
Translates to 7% y/y
Grown at 10 years of 20% of
1 (a) Fill 94% of supply average growth for 10 34.0
3.72% gross revenue
years
Translates to 6% y/y
Grown at 10 years of 20% of
2 (a) Fill 89% of supply average growth for 10 29.3
3.72% gross revenue
years
Translates to 5% y/y
Grown at 10 years of 20% of
3 (a) Fill 94% of supply average growth for 10 19.9
1.36% gross revenue
years
Translates to 4% y/y
Grown at 10 years of 20% of
4 (a) Fill 89% of supply average growth for 10 16.0
1.36% gross revenue
years
In 2020, a 1 year, 11% drop.
Grown at Translates to 5% y/y 10 years of 20% of
5 (a) Fill 100% of supply 23.7
3.72% average growth for 10 gross revenue
years
In our final scenario, 5(a), we evaluate perfect execution on behalf of NCLH, with a one-year decline in
revenue commensurate with the average decline in revenue by NCLH, RCL and CCL between 2008-2009
of 11%. It is not our intention to forecast a major economic shock on the horizon; however, it would seem
prudent over a ten-year valuation period to observe how sensitive their valuation is to a one-year decline
in revenue. As expected, it is highly sensitive. 24 Perfect company execution, with the inclusion of an
uncontrolled, exogenous variable that causes broad discretionary spending to drop, suggests a valuation
of $23 per share.
23
Calculated as the difference between the total passengers needed to fill all berths based on planned supply and the total
number of passengers available based on historical growth rates.
24
A 1% change in pricing power (revenue/berth) equates to roughly 19% change in revenue potential, all else equal.
Page 10 of 13
Downloaded from www.hvst.com by IP address 192.168.96.10 on 02/20/2022Norwegian Cruise Line Holdings LTD (NCLH) Massif Capital, LLC
We believe that not only will global demand fail to keep pace with supply, but that their ability to raise
ticket prices at a historically unprecedented clip is highly suspect. NCLH has no margin for error.
Considering their exposure to additional unpriced risk factors such as terrorism, virus outbreaks,
weather/climate patterns, and geopolitical relationships, we believe the likelihood NCLH navigates the
next decade unscathed is extremely low.
Risks to Thesis: The 2018 booking curve appears healthy; customer advances as a percentage of annual
revenue for the following year suggests that 2018 revenue will be close to $6 billion, an 11% y/y increase
from 2017. We believe 2019 will present a materially different outlook for NCLH and the signs of
deterioration will begin to emerge towards the latter half of 2018. The primary risk to our thesis is that
NCLH can hold a 3-5% annual pricing power increase for the foreseeable future commensurate with
global demand outpacing the unprecedented supply growth. Continued economic expansion in the U.S.
will need to persist far beyond 2020 for this reality to unfold. A sudden surge in Asian demand presents a
risk as well; however, it would need to be accompanied by significantly higher ticket prices, leading to
higher margins. Finally, the initiation of a dividend or a share buyback program are risks to our valuation.
NCLH has communicated to investors that both options are on the table; however, we do not believe
NCLH can generate sufficient free cash flow to fund either initiative absent new borrowing for the
purpose.
Page 11 of 13
Downloaded from www.hvst.com by IP address 192.168.96.10 on 02/20/2022Norwegian Cruise Line Holdings LTD (NCLH) Massif Capital, LLC
Appendix A: Lack of IMO enforcement requires compliance to fall on the shoulder of the ships flag nation.
Ship registry is a business; ships do not need to be present to register and most registry offices are not
located in the host country. The Marshall Islands runs their registration out of Virginia, the Bahamas runs
their office out of London and New York. Ship registries can be a meaningful revenue stream to a small
country and the threat of exit is highly valuable to cruise industry. Under any negotiation, ships are highly
mobile assets. Even if a country has the firepower to enforce compliance, there are real incentives pulling
it in the other direction. As noted in a 2016 white paper published by KBC, the “industry has a reputation
for slack compliance with regulations, with operations moving to light tough “flags of convivence”
countries and costs being squeezed to a bare minimum”
The lack of meaningful oversight allows the industry to pay 85% of the on ship-workforce as little as $400
to $500 per month. 25 NCLH currently employees 31,000 people, of which 3,000 are full time and 28,000
are shipboard. Assuming equal pay across all employees, a fallacious assumption, the average NCLH
employee makes $1,227 a month, roughly 12% more than the average RCL employee and 30% less than
the average CCL employee. Payroll and related expenses currently account for 15% of cruise operating
expenses. This pales in comparison to the labor costs associated with most hotel/hospitality businesses.
According to CBRE, a hotel and lodging research group, in 2015 labor costs account for 43% of total
operating costs for US vacation resorts.
Despite the significant operating advantage afforded to NCLH by the lack of regulatory oversight, which
extends to tax matters as well (NCLH has an effective tax rate of less than 1%), NCLH has only managed to
produce an average Net Income Margin of 5.95% over the last ten years. Given that NCLH has an even
lower effective tax rate than the industry and has only managed to accomplish the 5-year industry
average after tax income margin of 11%, suggests their results are even more sensitive to changes in the
regulatory landscape.
Appendix B:
25 Cruise Ship Tourism 2nd Edition, 2017
Page 12 of 13
Downloaded from www.hvst.com by IP address 192.168.96.10 on 02/20/2022Norwegian Cruise Line Holdings LTD (NCLH) Massif Capital, LLC
Full Legal Disclaimer
As of the publication date of this report, Massif Capital, LLC and its affiliates (collectively "Massif Capital") has a short position in
the stock of Norwegian Cruise Lines Holdings Ltd. Massif Capital stands to realize gains in the event the price of the stock
decreases. Following publication of the report, the Massif Capital may transact in the securities of any company covered or
discussed herein. All content in this report represent the opinions of Massif Capital. Massif Capital has obtained all information
herein from sources they believe to be accurate and reliable. However, such information is presented “as is,” without warranty of
any kind – whether express or implied. Massif Capital makes no representation, express or implied, as to the accuracy, timeliness,
or completeness of any such information or with regard to the results obtained from its use. All expressions of opinion are
subject to change without notice, and Massif Capital does not undertake to update or supplement this report or any information
contained herein. This report is not an investment recommendation and is only a discussion of Massif Capital’s opinions.
This document is for informational purposes only and it is not intended as an official confirmation of any transaction. All market
prices, data and other information are not warranted as to completeness or accuracy and are subject to change without notice.
The information included in this document is based upon selected public market data and reflects prevailing conditions and
Massif Capital’s views as of this date, all of which are accordingly subject to change. Massif Capital’s opinions and estimates
constitute a best efforts judgment and should be regarded as indicative, preliminary and for illustrative purposes only.
Any investment involves substantial risks, including, but not limited to, pricing volatility, inadequate liquidity, and the potential
complete loss of principal. This report’s estimated fundamental value only represents a best effort estimate of the potential
fundamental valuation of a specific security, and is not expressed as, or implied as, assessments of the quality of a security, a
summary of past performance, or an actionable investment strategy for an investor.
This document does not in any way constitute an offer or solicitation of an offer to buy or sell any investment, security, or
commodity discussed herein or of any of the affiliates of the Massif Capital. Also, this document does not in any way constitute
an offer or solicitation of an offer to buy or sell any security in any jurisdiction in which such an offer would be unlawful under the
securities laws of such jurisdiction. To the best of Massif Capital’s abilities and beliefs, all information contained herein is
accurate and reliable.
Massif Capital reserve the rights for their affiliates, officers, and employees to hold cash or derivative positions in any company
discussed in this document at any time. As of the original publication date of this document, investors should assume that Massif
Capital has a position in one or more of the companies discussed and has positions in financial derivatives that reference the
security and stand to potentially realize gains in the event that the market valuation of the company’s common equity is lower or
higher than prior to the original publication date depending on if we are short or long as noted above in this disclosure and on
the cover page of this report. Massif Capital, officers, and individuals shall have no obligation to inform any investor or viewer of
this report about their historical, current, and future trading activities. In addition, Massif Capital may benefit from any change in
the valuation of any other companies, securities, or commodities discussed in this document. Analysts who prepared this report
are compensated based upon (among other factors) the overall profitability of Massif Capital’s operations. The compensation
structure for Massif Capital analysts is generally a derivative of their effectiveness in generating and communicating new
investment ideas and the performance of recommended strategies for the Massif Capital. This could represent a potential
conflict of interest in the statements and opinions of Massif Capital documents.
The information contained in this document may include, or incorporate by reference, forward-looking statements, which would
include any statements that are not statements of historical fact. Any or all the Massif Capital’s forward-looking assumptions,
expectations, projections, intentions or beliefs about future events may turn out to be wrong. These forward-looking statements
can be affected by inaccurate assumptions or by known or unknown risks, uncertainties and other factors, most of which are
beyond Massif Capital’s control. Investors should conduct independent due diligence, with assistance from professional financial,
legal and tax experts, on all securities, companies, and commodities discussed in this document and develop a stand-alone
judgment of the relevant markets prior to making any investment decision.
Page 13 of 13
Downloaded from www.hvst.com by IP address 192.168.96.10 on 02/20/2022You can also read