Northeast Climate Change Vulnerability Assessments - Dawson Creek submitted by: SHIFT Collaborative November 2019 - Fraser ...
←
→
Page content transcription
If your browser does not render page correctly, please read the page content below
Northeast Climate Change
Vulnerability Assessments

FINAL REPORT

Dawson Creek
submitted by:
SHIFT Collaborative
November 2019

                      1
Table of Contents

1.      Introduction ............................................................................................................................ 4
2.      Methodology ........................................................................................................................... 8
3.      How Will Climate Conditions Change in Northeastern BC?.................................................. 13
4.      What Impacts Can We Expect From These Changing Conditions? ....................................... 17
5.      What Impacts Are We Most Vulnerable To? ........................................................................ 18
6.      Which of These Impacts Pose the Highest Risk? .................................................................. 21
7.      Initial Action Ideas................................................................................................................. 26
8.      Conclusion ............................................................................................................................. 30
Appendix A. Risk-based Adaptation Planning Tools ..................................................................... 31
Appendix B. Regional Results of Pre-Workshop Survey ............................................................... 35
Appendix C. Qualitative Vulnerability and Risk Assessment Process ........................................... 45
Appendix D: Impact Statements with Additional Detail ............................................................... 49
Appendix E. Heat Map .................................................................................................................. 58
Appendix F. Climate Adaptation Teams, Terms of Reference ...................................................... 61
Appendix G. Detailed Action Plan ................................................................................................. 63
Appendix H. Climate Adaptation Maturity Scale .......................................................................... 78

List of Figures
Figure 1. Northeast Climate Vulnerability Assessment Project Overview ...................................................... 6
Figure 2. Assessing risk and vulnerability to changing climate conditions .................................................... 7
Figure 3. Municipal service areas with potential impacts due to changing climate conditions ................... 9
Figure 4. Three step vulnerability and consequence assessment method used in workshop 1 .................11
Figure 5. Action planning process ................................................................................................................12
Figure 6. Current levels of concern about climate-related hazards for Northeast communities ...............17
Figure 7. Survey Respondents from Across Communities...........................................................................35
Figure 8. Survey respondents understanding of climate change ................................................................37
Figure 9. Survey respondents’ agreement that their community is doing enough to adapt to climate
     change. ................................................................................................................................................38
Figure 10. Concerns about effects of climate change .................................................................................39
Figure 11. Frequency for considering climate change in one’s work. .........................................................41
Figure 12. Perception of need for climate change adaptation supports ....................................................42
Figure 13. Barriers to climate change adaptation .......................................................................................43
Figure 14. Perception of key stakeholders that should be involved in developing climate change
     adaptation measures ..........................................................................................................................44
Figure 15. Sensitivity and adaptive capacity rating scales Used in workshop 1 assessment process.........47
Figure 16. Vulnerability assessment matrix, based on BARC-ICLEI .............................................................48
Figure 17. Heat Map characterization of risk ratings for highest vulnerability impact statements. ..........58

                                                                                                                                                             2
List of Tables
Table 1.Temperature                                                              15
Table 2. Heating and Cooling                                                     15
Table 3. Growing Season                                                          16
Table 4: Precipitation                                                           16
Table 5. Climate impact statements with highest vulnerability in Dawson Creek    18
Table 6. Summary of Climate Hazards and Risk Ratings for Dawson Creek            22
Table 7. Potential opportunities for regional collaboration across the Network   27
Table 8. Steps in Climate Change Adaptation Methodology                          33
Table 9. Respondents by Sector                                                   36
Table 10. Highest risks identified for Dawson Creek                              59

                                                                                  3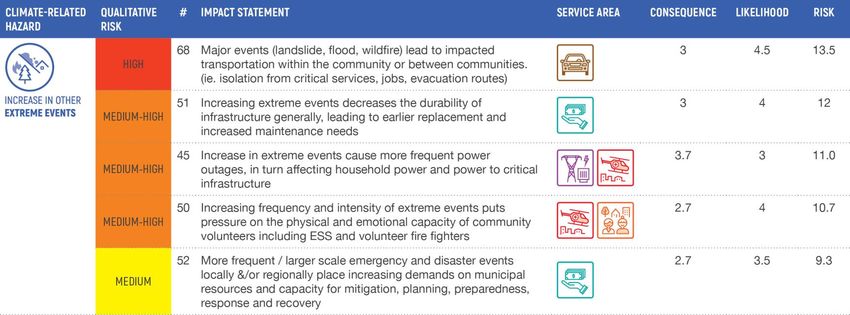
1. Introduction
The Northeastern region of BC represents 21.8% of the land area of the province (20,494,470
ha), but is the least populated region in BC, with just 1.6% of the population (about 69,068
people). The Northeastern region is expected to undergo significant population and economic
growth as a result of rapid expansion in natural gas and oil development. (The population is
expected to increase by 30% over the next 25 years, BC Stats, 2014).

There are two broad types of actions relating to climate change: reducing greenhouse gas
emissions (climate change mitigation), and preparing for and adjusting to changes in climate
that impact human and non-human systems (climate change adaptation). The focus of this
effort is climate change adaptation.

Recent Federal research1 indicates that Canada is warming at twice the global average rate,
with severe impacts already being felt and anticipated to increase in severity. Compounding
this, northeastern BC has experienced a significantly more rapid rate of warming over the last
100 years (2.2 °C) than has BC overall (1.2°C). Significant changes in climate are projected for
the future. The region is expected to see increases in average temperature and precipitation,
the frequency and severity of extreme precipitation, drought and flood events, and other
associated impacts.

Changes to the climate and extreme weather is challenging
                                                                  Recent Climate Events in the
industry and communities across the Northeast region of the
                                                                  Northeast Region
province. Wildfires, hail storms and floods have already
                                                                   • Annual near flood events
impacted local infrastructure and posed health risks to               across region
communities. Ensuring the region is as prepared as possible        • 2017 Pouce Coupe Hail Storm
for future climate events is critical to maintaining a thriving    • 2016 Dawson Creek flood
community, robust natural environment, and vibrant                 • 2016 Chetwynd Flood
economy. “As prepared as possible” means the region                • 2014 Regional Drought

understands how the climate is changing and is working
together to increase resiliency and improve natural and physical infrastructure. Early efforts will
reduce the reliance on emergency management and support the ability to change and thrive
over time. Local governments in the region are taking a proactive approach to understand how
climate change will pose risks to Northeast communities and are planning together to build
resiliency across the region. Designing to current and future climate parameters is anticipated
to be more cost-effective than reacting to climate shocks and stresses over time.

       1.1 The Northeast Climate Risk Project
This project is being conducted for the Northeast Climate Risk Network (NECRN). The NECRN
includes partners from: the City of Fort St. John, City of Dawson Creek, District of Tumbler Ridge,

1   Government of Canada, Natural Resources Canada https://www.nrcan.gc.ca/environment/impacts-adaptation/21177

                                                                                                                  4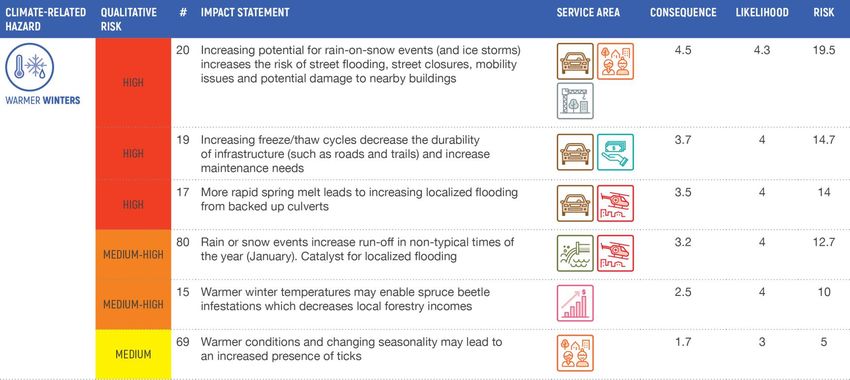
District of Chetwynd, Village of Pouce Coupe and Northern Rockies Regional Municipality who
have come together to better understand and build capacity to address the impacts of climate
change. NECRN is a peer-mentoring network on adaptation to climate change, which also
serves as an advisory body for the overall Northeast Climate Risk Project. This project was
initiated in 2018 by the Fraser Basin Council, in partnership with the six local municipalities. The
Project has three goals:

      1. Support the Northeast BC local government partners in preparing for a changing climate
         and understanding the associated risks and vulnerabilities;
      2. Collaboratively address climate risks at a regional and community scale through a peer
         network; and,
      3. Increase staff and stakeholder awareness of climate change impacts through the
         planning process as a first step to building community, public and private sector
         awareness of climate change impacts.

The NECRN has been working collaboratively to produce a number of products that will support
communities in the region to better prepare for and adapt to a changing climate, namely:

Northeast BC Regional Climate Projections Report
The regional climate projections report2 provides Northeast BC with regional information on
climate projections, precipitation indicators, summer and winter temperature indicators and
hydrology for selected river catchments, for the 2050’s and 2080’s.

Community Scoping Reports
An internal gap analysis was conducted for each of the six municipalities, which identified
priority climate change impacts, outlined related work done to date and identified priority gaps
and opportunities to address changing climate conditions.

Community Vulnerability Assessments (this document)
This report is the final comprehensive report on the results of the year-long process outlined in
Figure 1. Each community prioritized impacts for initial action planning employing a
vulnerability and risk assessment.

2   https://www.fraserbasin.bc.ca/Northeast_BC_Climate_Risk.html

                                                                                                   5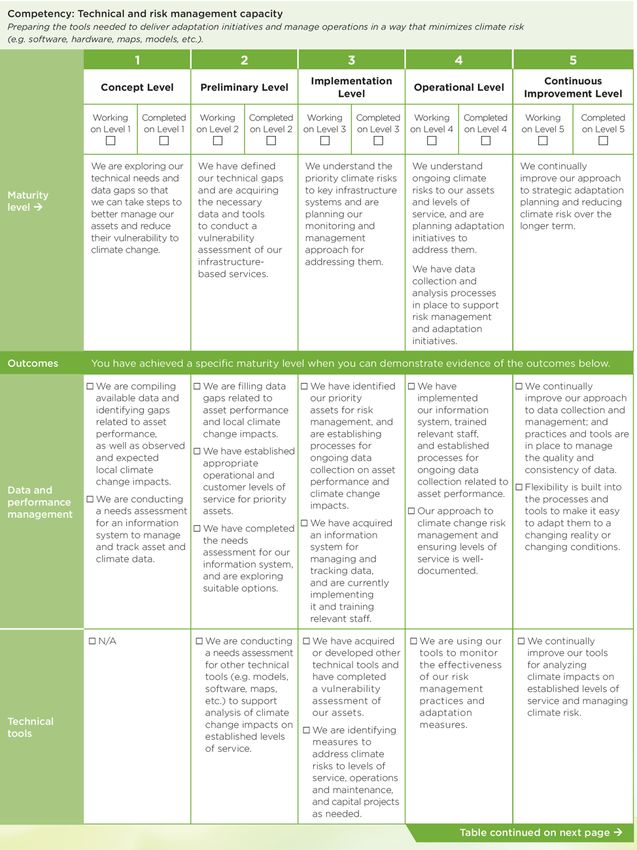
Northeast Climate Risk Network (NECRN) Climate Vulnerability Assessment Project 2018 - 2019

                                                                                                Draft
                                             Outline &                                       Vulnerability
                                             Workplan                                        Assessment
                                                                                               Reports

                                       Develop a                                           Develop draft
                                       detailed                                            vulnerability
                                       workplan for                                        assessment
                                       Vulnerability                                       reports for each
                                       Assessment                                          community, for
                                       Phase                                               review

                           Gap Analysis                   Assessing             Generating and             Plan & Build       Final Reports
                                                           Impacts,               Evaluating               Capacity for
                                                         Vulnerability           Adaptation              Implementation
                                                           and Risk                Options

                          Document                                             NECRN workshop          NECRN individual
                                                       Community-
                          review &                                             (with key staff /       calls and joint       Develop final
                                                       specific
                          interviews à                                         stakeholders) to        videoconference       vulnerability
                                                       workshops to
                          community                                            generate initial        to identify near      assessment
                                                       assess impacts,
                          scoping reports                                      ideas of                term priority         report for each
                                                       vulnerability, risk
                          identifying gaps                                     adaptation              actions and           community,
                                                       of community
                          and                                                  options and             explore               with near term
                                                       assets & values
                          opportunities                                        introduce               opportunities for     action plan
                                                       to climate
                          for adaptation                                       methods for             building collective
                                                       change impacts
                                                                               prioritization          capacity

                  July                           Jan                         Mar                        Sept                      Dec
                  2018                          2019                         2019                       2019                      2019

Figure 1. Northeast Climate Vulnerability Assessment Project Overview

                                                                                                                                               6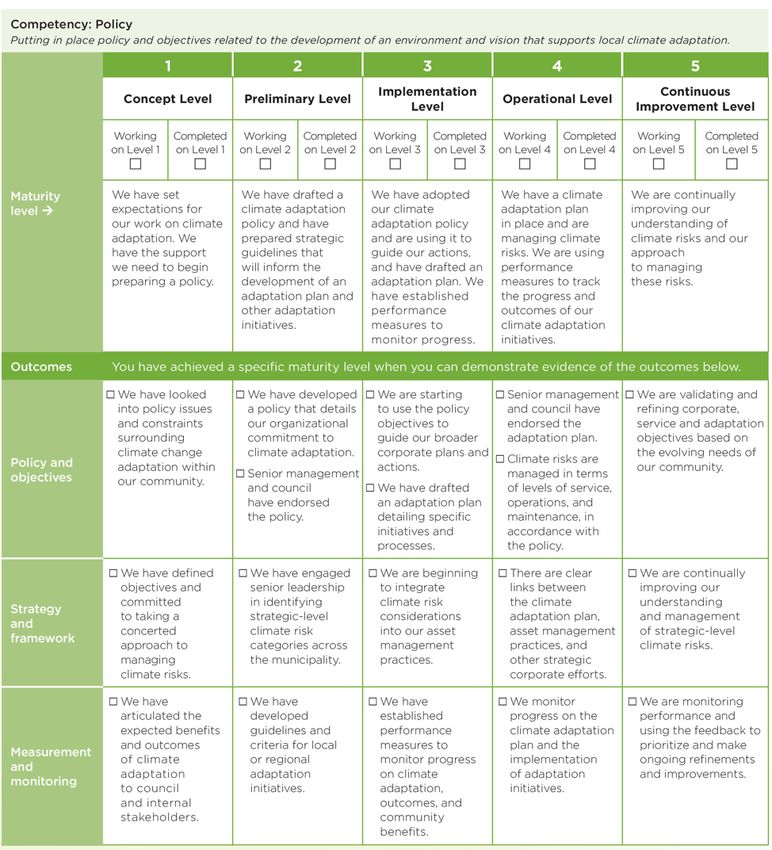
1.2 What determines risk and vulnerability to changes in climate?
A key first step on the way to adapting to climate change is to consider what the relative risks
and vulnerabilities are likely to be for the various components of the community. To do this, we
have taken a commonly used approach to understanding risk and vulnerability, as represented
in Figure 2:

                                                 Adaptive Capacity (to what
                                                extent can the system prepare
                                                        and respond?)

                                               Exposure & Sensitivity (what is
                   Consequence (degree
                                              exposed and how sensitive is it to
                        of impact)
                                                         impact?)
    Risk =
                   Likelihood (how likely        Hazard (changes to climate)
                     is this to happen?)

Figure 2. Assessing risk and vulnerability to changing climate conditions

The risks posed by climate change are a combination of the characteristics of the climate-
induced hazard itself (e.g. magnitude of the hazard (such as flooding) and frequency) and how
this interacts with human, built and ecological systems. The degree to which these systems are
vulnerable, depends in part on whether they are exposed to the hazard, and how sensitive they
are to its effects. For example, a housing development in a floodplain is exposed to flood risk
while a subdivision at higher elevation is not. Similarly, a newer development built with
floodproofing features is less sensitive than an older home without any such features.

But vulnerability also depends on the ways in which the affected systems can anticipate,
prepare and adapt to better manage the challenge (adaptive capacity). For example,
communities with a well-developed emergency management system or who have used tools
and resources to divert development to areas outside of the floodplain, are more adaptive to
an increasing flood hazard.

The degree of impact that occurs as a result (consequence), combined with how likely the
event or impact is to occur, provides an indication of the degree of risk due to these changing
conditions.

                                                                                                  7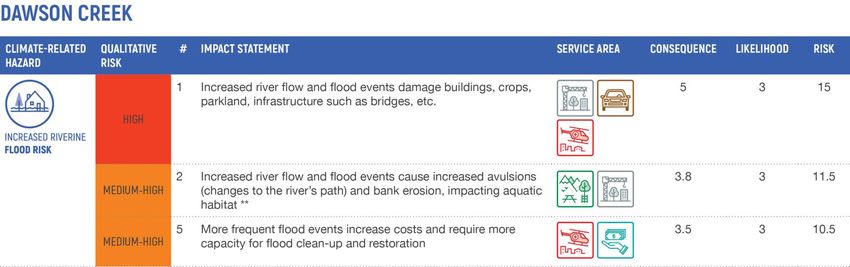
2. Methodology
Risk management across domains follows the basic steps listed and includes an iterative
process of adaptive management and continuous improvement: identification of risk, analyzing
risk to understand whether it requires a response, and choosing the best risk management
options3. Several adaptation or risk-based planning tools are variations on these common steps
(see Appendix A). All of these approaches use relatively qualitative assessment techniques for
vulnerability and risk, which is the appropriate methodology for higher-level assessments such
as this one. This Vulnerability Assessment has a specific purpose of better understanding the
range of impacts the community may face and prioritizing across and between them as a basis
for deciding on where to focus their limited resources and time. The need for more detailed
assessments may be identified as a near-term action step resulting from this prioritization
process4.

In order to consider the range of ways that a changing climate will impact the community and
the work of the local government specifically, impacts were organized by municipal service
areas, as shown in Error! Reference source not found.. These service areas were considered in
the gap analysis, pre-workshop survey and throughout the vulnerability and risk assessment.

This Vulnerability Assessment Report is the culmination of three key components:
    1. A community-level gap analysis;
    2. A qualitative vulnerability and risk assessment process with stakeholders; and
    3. An action planning process led by each community’s Climate Adaptation Team.

Each of these components is outlined below (and in the associated appendices), followed by a
discussion of the limitations of the methodology.

3   See ISO 31000 Risk Management Framework https://www.iso.org/iso-31000-risk-management.html
4For example, an assessment of a sewerage area or a flood risk assessment can rely on damage-curves
and specific calculations of consequences to provide quantitative detail where it is needed. Engineers
Canada’s PIEVC protocol has a specific option to undertake a more detailed engineering study, and is a
common approach to climate risk assessment for engineered infrastructure.

                                                                                                         8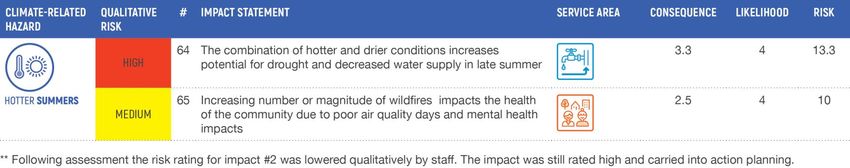
Municipal
                             Service Areas

Figure 3. Municipal service areas were used to illustrate the range of areas impacted by climate change.

    2.1 Gap Analysis

The gap analysis was conducted to produce the “Community Scoping Report” for Dawson Creek,
a stand-alone internal document for use by the local government. The gap analysis consisted of
a combination of document review and interviews. Documents were reviewed to identify:
    • Key background and contextual information about the community and systems that may
       be vulnerable to climate change impacts;
    • Any policies or actions that directly or indirectly address potential vulnerabilities to
       climate change;
    • Any immediate or planned windows of opportunity for incorporating a climate lens; and
    • Any existing information, studies, and reports that contribute to an understanding of
       climate change projections or vulnerabilities in the community or the northeast region.

Following the initial review of documents, a number of interviews were conducted with local
government staff and other agencies, to fill in gaps in information. Information from these two
key sources was compiled in the resulting report. Information gaps and opportunities for

                                                                                                           9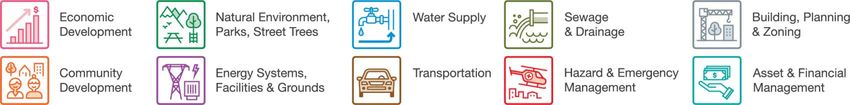
applying a climate lens were identified by service area (e.g. sewage and drainage, community
development).

    2.2 Vulnerability & Risk Assessment Process
This step in the methodology aimed to outline which impacts from a changing climate pose the
greatest risk to each community, and thus form the basis for prioritizing near-term actions. To
better understand the baseline knowledge and perspectives of participants about the impacts
and potential for adaptation to changing climate conditions, a survey was conducted of
confirmed participants in advance of the workshop. The compiled results of this survey across
all participants in the region, are included in Appendix B.

On February 28th, 2019 a workshop was held in Dawson Creek with City staff and other
community and regional stakeholders, to discuss the possible climate impacts for Dawson Creek
and begin to prioritize which impacts to focus on in the near term. Eighteen people participated
in this workshop, representing the following organizations:
    • City of Dawson Creek (12)
    • Peace River Regional District
    • Peace River Forage Association
    • Northern Health
    • Northern Environmental Action Team
    • BC Ministry of Forests, Lands, Natural Resource Operations and Rural Development
    • BC Oil and Gas Commission

The workshop began with a summary of the regional climate projections outlined in the report
“Climate Projections for the BC Northeast Region5.” Impact statements describing the types of
impacts expected for the community (based on information from the Gap Analysis), were
developed as the basis for discussion and input during the workshop. These impact statements
were taken through a three-step process6, outlined in Figure 4 below:

5Produced by Pacific Climate Impacts Consortium and Pinna Sustainability, completed in 2019.
6The process used borrows from the ICLEI BARC process and employed the BARC rating scale for vulnerability. The
focus for impact statement generation was the climate projections to 2050. When assessing vulnerability and risk,
current community characteristics were used to simplify the process.

                                                                                                              10
Gap Analysis
+ Climate ~50 Im pact ~25 Im pact
Projections Statem ents Statem ents
Step 1: Generate Step 2: Assess Step 3: Assess
Impact Statements Vulnerability Consequence (Risk)
Add, change or Provide a rating of Provide a rating of
drop Impact “Sensitivity” and “consequence”
Statements (initial “Adaptive across five
list generated from Capacity” for each categories, for
Gap Analysis). impact statement each of the higher
vulnerability
Provide additional Prioritize higher impacts
detail to better vulnerability
understand each impacts
impact in this
community.
Figure 4. Three step vulnerability and consequence assessment method used in workshop 1
See Appendix C for further detail on the assessment process used to qualitatively assess
vulnerability (sensitivity x adaptive capacity) and consequence during Workshop 1.
Three University-based experts with background in the Northeast region and climate change
provided likelihood scores for the impact statements. The consequence ratings for the higher
vulnerability impacts generated during the workshop were combined with these likelihood
ratings to provide an overall risk score. Those impact statements that fall into the medium to
high risk category were then cross-referenced with the gap analysis results and reviewed by the
community’s Climate Adaptation Team in Workshop 2 to arrive at the final list of priority
impacts.
2.3 Initial Steps Toward Action Planning
In order to operationalize the findings of this assessment process each community was invited
to form a Climate Adaptation Team to attend the second workshop and lead the initial action
planning. A description of the purpose, potential membership and functions of these teams is
outlined in Appendix F.
The final list of higher risk impacts was used as the basis for action planning. Action planning
focuses on exploring options and next steps to reduce these key risks and enhance resilience to
these climate impacts. Lower risk impacts were provided to the teams as well, to scan for those
that could easily be addressed by low-effort/no-regret actions. The action planning process was
introduced in Workshop 2, and then completed by each Climate Adaptation Team working with
the support of the project team. Each community’s action plan was shared with NECRN
11members, who together identified opportunities for regional collaboration and learning. This
process is outlined in Figure 5.
Ground-truth Review and provide amendments to the
Assessment list & heat-map of top risks for each
Results community.
Generate & Practice working with evaluation
Practice Evaluating criteria and designing for co-benefits.
Adaptation
Generate possible actions for top risks.
Options
Working in Climate Adaptation Teams
Complete an Initial and with other staff & stakeholders as
Action Plan needed, complete the action plan
template.
Identify
Opportunities for As a network, review community
action plans and identify opportunities
Regional for joint action and learning.
Collaboration
Figure 5. Action planning process
2.4 Limitations of the Methodology
Efforts have been made at each step of the process to “ground-truth” results with those who
have local knowledge and/or topic-specific expertise. However, there will be inevitable gaps
and omissions due to the breadth of what is being considered. This report is to be considered a
working document – as communities take the next steps to address priority impact areas, more
information will emerge and be developed that will inform further steps. Adaptation
assessment and planning is an inherently iterative process as understanding and conditions (i.e.
the climate, political will, priorities, land use patterns, infrastructure needs, innovations, etc.)
develop over time.
Due to time and availability, the number of interviews for each community during the Gap
Analysis was constrained and this limits the range or depth of perspectives that we were able to
gather on specific aspects of system vulnerability. While additional information and
perspectives were incorporated through stakeholder feedback on the impact statements in
Workshop 1, this was still limited by the knowledge of participants who were able to attend.
Numerous adaptation methodologies (i.e. see Appendix A for examples) rely on stakeholder
opinions as a basis for vulnerability and risk assessment. That said, the qualitative approach to
12risk and vulnerability assessment has a number of limitations. Ratings for sensitivity, adaptive
capacity and consequence were all based on informed judgment of stakeholders who were
present for Workshop 1. As such, there are gaps in the expertise and understanding of the
relationships between future climate conditions and how these would affect various parts of
the system. This was mitigated by having multiple people rate each impact statement and
deliberate on the final rating assigned to each, along with two additional steps to double-check
the results with participants and a further step of cross-referencing with information compiled
during the Gap Analysis. Still, these are subjective ratings and may contain biases, for example:
1) Recently experienced impacts may be rated higher in vulnerability and/or consequence
2) More familiar impacts may be rated differently than less familiar impacts
3) Impacts of general importance to participants may be rated more highly than others (e.g.
someone who works on water treatment may rate associated risks more highly than
those to emergency volunteer capacity)
It is important to remember that the purpose of this assessment is to provide a basis for
prioritizing more important impacts for the purposes of allocating time and resources to
addressing these. This is a first step, providing a high-level assessment that supports the
community to make more informed choices about how to prepare and adapt to the projected
changes in climate conditions.
Likelihood was rated by four academics with firsthand research experience in the Northeast
region, in related fields. Their ratings were generally quite similar but not identical for all
impacts, and were averaged where they did not converge.
3. How Will Climate Conditions Change in Northeastern BC?
Dawson Creek is considered a lowland community based on elevation. Dawson Creek and the
other network communities can expect significant changes to its climate in the coming decades,
including:
• Increased precipitation across all seasons. The largest increases in precipitation will
take place during the spring & autumn months during which, on average, the region can
expect 30% more precipitation by the 2050s. This can lead to more frequent flooding
and stress to ecosystems.
• Summers will be considerably warmer. In the past, the region experienced an average
of 12 days over 25°C annually. We can expect 32 days by the 2050s (49 days by the
2080s). Dawson Creek is expected to experience 40 days above 25°C by the 2050s and
60 days by the 2080s, with 10 days above 30°C by the 2050s and 21 days over 30°C by
late century. By the 2080s, summer temperatures are projected to be about as warm as
Kelowna’s past summers (1980s).
13• Summer is expected to remain the wettest season, though by a smaller margin. Even
though precipitation is projected to increase slightly over summer months, on average,
normal seasonal variability in precipitation plus hotter temperatures (and thus increased
evaporation) could lead to drier, hotter summers, posing increased risk of wildfire and
associated physical and mental health impacts.
• Temperatures projected will trigger significant heat stress across the region. The ability
to provide clean drinking water as a shared resource to communities, industry and
agriculture may be strained. Higher demand for water during longer, hotter summers as
well as during dry spells, could create challenges for water supply, water quality,
livestock and crop yields.
• Winter temperatures are also projected to warm. By the 2080s, January temperatures
are projected to feel like March temperatures of the past, with warmer nights, 28% less
frost days and 37% longer growing seasons than the past. More winter precipitation and
later onset of freezing temperatures could potentially lead to additional annual freeze
thaw cycles and more frequent rain-on-snow events. Shifting seasonal temperatures
could also result in premature pollination of crops and increased invasive species and
pests, impacting agriculture and forestry.
• More extreme storm events in the future. As the climate warms, more moisture is held
in the atmosphere, resulting in more intense precipitation during extreme events.
Future storms may also bring stronger winds and hail events. These events will
challenge regional infrastructure, and may overwhelm sewerage and drainage systems.
Other extreme weather events of concern include river floods, high winds, drought, and
wildfire.
• Summer streamflow will decrease in all basins. Warmer temperatures mean that
relatively more precipitation will fall as rain rather than snow, which in general means
an increase in winter runoff, reduced snowpack and an earlier freshet for the
Kiskatinaw River. Less water stored over winter and melted earlier in the year also
means reduced summer and early fall streamflow for the Kiskatinaw and other area
rivers. These changes will be exacerbated by increased evaporation, further contributing
to increased stress to water resources.
14The projected changes to climate conditions for Dawson Creek and Northeastern BC7, are
summarized in the tables below.
Table 1.Temperature
Expect summers and winters to warm with summer days getting hotter
Description of Metric Anticipated change for NEBC Lowlands
Annual average temperature increase Average Annual temperature will increase
+3.7°C by 2050 and +6°C by 2080s
Overall Change: Summers get warmer with hotter “hot days”
Number of days where maximum temperature is Number of summer days increases by 50%
above 25°C (from 16 up to 24)
Maximum daytime temp of the warmest summer Warmest summer day is 3.7°C warmer
day
Maximum night time temperature in the summer Hottest summer night is 3.3°C warmer
Hot summer days = days above 30°C in any one year The number of summer days above 30°C is
projected to occur 9 times/year by the
2050s and 20 times/year by 2080s.
(previously occurred ~1 time/year)
Maximum daily temp expected to occur on average Very hot days increase in intensity from
1:20 years (5% chance in any year that the temp 31°C to 38°C by the 2080s
could reach this magnitude).
Overall Change: Winters get warmer, especially nights
Min temp of the coldest night time in winter Coldest winter nights: 6.5°C warmer
Max temp of the warmest night time in winter Warmest winter night: 2.4°C warmer
Minimum daytime temperature of the coldest day in Coldest winter day: 6.2°C warmer
winter
Max daytime temperature of the warmest day in Warmest winter day: 1.5°C warmer
winter
Minimum night time temp expected to occur on Very cold nights are projected to warm
average 1:20 years (5% chance in any year that the from -44°C to -38°C
temp could reach this magnitude).
Ice Days is an annual count of days when daytime 17% fewer ice days
high temp is less than 0°C
Table 2. Heating and Cooling
Greater need for summer cooling while winter heating demand decreases slightly
Description of Metric Anticipated change for NEBC Lowlands
Indicator for heating demand. 18% fewer Heating Degree Days
(Total of the number of degrees below
18°C that occur daily, summed over each
7
Data as generated by Pacific Climate Impacts Consortium (www.pacificclimate.org) in the Regional Climate
Projections Report. All projections are to the year 2050 unless noted. Change is relative to the baseline period of
1971 – 2000. All projections are averages from Global Climate Models.
15day of the year)
Indicator for cooling demand. 600% more Cooling Degree Days (18 – 94 days
(Total of the number of degrees above lowlands)
18°C that occur daily, summed over each
day of the year)
Table 3. Growing Season
Longer growing season with a doubling of Growing Degree Days (GDD)
Description of Metric Anticipated change for NEBC Lowlands
Growing season length is the length Growing season length increases from 160 to 189
between the first span of six days above days in 2050, and 205 days in 2080.
5°C in spring, and the first span of six days
below 5°C in the fall.
Annual count of days when daily minimum 17% fewer frost days
temp is below 0°C
GDD is an indicator for plant growth: Lower elevations can expect 2000 GDD by 2080s
Total of the number of degrees above 5°C (81% increase from the past)
that occur daily, summed over each day of
the year.
Table 4: Precipitation
Expect more precipitation annually with the largest increases in the spring and autumn.
Summer remains the wettest season to the 2050s. Expect an increase in frequency and
intensity of rain events.
Description of Metric Anticipated change for NEBC Lowlands
Average seasonal changes in precipitation 19% increase in spring precipitation, 15% increase
in autumn, 7% in summer and 11% in winter
Overall Change: Intensity (volume/ size of event) of significant rain events will increase
Wettest day is the largest amount of rain 17% increase (from 28mm) in amount of rain on
that falls on any single day in the year on the wettest day of the year
average
Largest amount of precipitation that falls 19% increase in rain amount over 5 consecutive
over a period of 5 consecutive days in the days to 68mm by the 2080s
year.
Overall Change: More frequent intense precipitation events and more rain to fall during these
events.
Annual total precipitation that falls on the The amount of precipitation falling on very wet
wettest days of the year (days where days of the year, increases by 35% by 2050 and
16precipitation exceeds the 95th percentile 51% by 2080.
amount recorded during the baseline
period).
As above but 99th percentile The amount of precipitation falling on the wettest
days of the year, increases by 59% by 2050 and
78% by 2080 (from 35mm).
Max daily precipitation expected to occur A 1:20 year return precipitation event will
on average once in 20 years (5% chance in increase in intensity by 25% (to 61mm of
any given year) precipitation) in a day
4. What Impacts Can We Expect From These Changing Conditions?
Workshop 1 participants from each community were invited to complete a survey (see
Appendix B) that asked about climate-related hazards of concern for their community (Figure 6).
The top concern across all communities was wildfire (78% of respondents ranked this as
something they are most concerned about), followed by flooding (56%), other extreme events
such as storms, hail, freezing rain (53%) and extreme rainfall events (51%). The climate-related
hazard communities were least concerned about was extreme heat (20%).
90%
78%
80%
Level of Concern Across All
70%
60% 56%
Communities
53% 51%
50%
40%
30%
20%
20%
10%
0%
Wildfire Flooding Other extreme Extreme rainfall Extreme heat
events (storms,
hail, freezing
rain)
Figure 6. Current levels of concern about climate-related hazards for Northeast communities
In terms of the impact that changing climate conditions could have on municipal service areas,
respondents from Dawson Creek were equally concerned about a number of municipal
services—67% of respondents were concerned about negative impacts to each of: water supply,
storm drainage, transportation and hazard and emergency management.
17An important step in this assessment was to translate knowledge about the projected future
changes in climate-related hazards into the impacts of concern to municipal service areas.
Through the gap analysis and Workshop 1, information was gathered to create impact
statements that clearly define the impact a changing climate would have on important aspects
of community life. Impact statements combine specific climate hazard features (e.g. increasing
potential for rain-on-snow events) with specific impacts to community functioning, assets
and/or values (e.g. flooding, street closures and mobility issues). An example of an impact
statement is:
“Increasing potential for rain-on-snow events (and freezing rain) increases the risk of street
flooding, street closures, mobility issues and potential damage to nearby buildings.”
There is a wide range of potential impacts to municipal service areas of the changing climate
conditions in the Northeast region – a detailed list is included in Appendix D, which provides
additional details relating to each impact statement.
The full list of potential impacts to municipal service areas was prioritized through the
vulnerability and risk assessment process, to identify those impacts of greatest concern and
where attention should be prioritized in the near term. Those impacts are outlined in Sections 5
and 6 below.
5. What Impacts Are We Most Vulnerable To?
As described above (see Figure 2), vulnerability is a combination of exposure (whether an
element is exposed to the climate hazard), sensitivity (how sensitive the element is to its effects)
and adaptive capacity (the ways in which the affected systems can anticipate, prepare and
adapt to better manage the challenge). Based on the assessment completed in workshop 1, the
following impacts (listed in Table 5 below) were identified as those the community is most
vulnerable to, given current adaptive capacity.
Table 5. Climate impact statements with highest vulnerability in Dawson Creek
Climate Hazard Impact Statement
• Increased river flow and flood events damage buildings, crops,
parkland, infrastructure such as bridges, etc.
• Increased river flow and flood events cause increased avulsions
(changes to the river’s path) and bank erosion, impacting aquatic
habitat.
• More frequent flood events increase costs and require more capacity
for flood clean-up and restoration
• More frequent flood events contribute to cumulative anxiety, stress
and mental health challenges among affected residents and service
providers
18• Increased flood events cause strain and stress on municipal
wastewater systems, and private layouts and dugouts (also private
septic and lagoons)
• Warmer winter temperatures may enable spruce beetle infestations
which decreases local forestry incomes
• More rapid snow melt leads to increasing localized flooding from
backed up culverts
• Increasing freeze/thaw cycles decrease the durability of infrastructure
(such as roads and trails) and increase maintenance needs
• Increasing potential for rain-on-snow events (and ice storms)
increases the risk of street flooding, street closures, mobility issues
and potential damage to nearby buildings
• Increased presence of ticks
• Rain or snow events increase run-off in non-typical times of the year
(January). Catalyst for localized flooding
• Situations of increased turbidity due to larger or more frequent
precipitation events decrease the number of days that pumping can
occur from the river to water supply reservoirs
• Heavy rainfall events cause more sewer back-up, which damage
buildings and can cause health impacts
• Increasing surface run-off during the rainy season and decreasing
recharge during the longer dry spells will impact groundwater and
base flows
• Increasing intensity of rainfall causes more frequent localized flooding
and sewer surcharge in parts of the community
• Increased surface runoff can lead to increased nutrient
concentrations in the water and increased sediment load thereby
impacting operation of water supply infrastructure
• Increase in extreme events cause more frequent power outages, in
turn affecting household power and power to critical infrastructure
• Increasing frequency and intensity of extreme events puts pressure
on the physical and emotional capacity of community volunteers
including ESS and volunteer fire fighters
• Increasing extreme events decreases the durability of infrastructure
generally, leading to earlier replacement and increased maintenance
needs
• More frequent / larger scale emergency and disaster events place
(i.e. storms, hail, increasing demands on municipal resources and capacity for
extreme heat, mitigation, planning, preparedness, response and recovery
wildfires, landslides) • Increasing number or magnitude of wildfires, impacts the health of
the community due to poor air quality days and mental health
19impacts
• Major events (landslide, flood, wildfire) lead to impacted
transportation within the community or between communities. (i.e.
isolation from critical services, jobs, evacuation routes)
• The combination of hotter and drier conditions increases potential for
drought and decreased water supply in late summer – industry is first
to be impacted when conservation measures are introduced
In Summary:
Flooding was identified as a major vulnerability for Dawson Creek including overland river
flooding and urban flooding. River and creek flooding may cause damage to infrastructure,
crops, public and private waste water systems as well as the environment. These impacts all
require capacity and resources to clean up and recover and impacted residents and responders
are vulnerable to anxiety and other mental health effects.
As the climate changes, increasing rain on snow events and freeze/thaw cycles are anticipated
and the municipalities more vulnerable to urban flooding from blocked sewers and culverts etc.
Transportation, mobility and exposed infrastructure are all vulnerable to urban flooding.
With warmer winters, an increase in pests is anticipated. Economic vulnerability to agriculture
pests and the spruce beetle were identified as well as health vulnerability to ticks.
Water supply vulnerabilities were identified from a range of climate changes. The infrastructure
is vulnerable to increasing turbidity and sediment load resulting from heavier rainfall. Drier
summers and heavier rains may impact groundwater and flow volume making water
management planning more challenging. Industry may be vulnerable to water supply pressures
felt late in the summer.
Vulnerabilities to extreme events range from health impacts, to the capacity to respond and
recover to lifeline impacts such as power outages and transportation disruptions.
206. Which of These Impacts Pose the Highest Risk?
As Figure 2 depicts, risk is a product of consequence and likelihood. The degree of impact that
occurs as a result of the climate hazard (consequence), combined with how likely this is to
happen, provides an indication of the degree of risk due to these changing conditions.
Risk results for Dawson Creek fall into the high to medium-low range. None of the impacts were
assessed as low risk. To be rated high or medium-high risk, the impact has a combination of
high consequence rating and medium or high likelihood rating, high ratings for both, or a
medium consequence rating and high likelihood rating. Table 6, below summarizes the risk
assessment results, also indicating which service areas are most affected by each impact
statement.
21Table 6. Summary of Climate Hazards and Risk Ratings for Dawson Creek
2223
24
25
For Dawson Creek, flood impacts related to the Creek flooding and intense precipitation events
featured prominently among the 18 highest risks identified (Table 6) with the impacts of
extreme events and drier periods also having important effects.

A range of types of flood impacts made up the majority of the top risks for Dawson Creek, with
concern about impacts due to both localized surface flooding (rainfall/rain on snow related)
and riverine (rivers overcoming capacity) flood events. Flood impacts will be an important focus
for the next steps of this work.

Aside from the impacts of floods, there were a handful of additional key risks. The effects of
both flood and other extreme events, and changes to freeze-thaw cycles, were of concern with
respect to the durability of infrastructure. Impacts to water supply and quality due to changes
in precipitation patterns and dry / drought conditions were important. The impact of extreme
events was another key issue, with concern for issues such as disrupted transportation and
mobility within and between communities (and isolation from critical services); the stress and
capacity drain for staff, volunteers and first responders; and effects of power outages. The
impact of spruce beetle infestations on forestry incomes rounded out the top risks.

   7. Initial Action Ideas

Community-specific
In September 2019, the project team from Dawson Creek put together initial action ideas for
addressing the highest risk impacts. For each higher risk impact the team began developing:
• A list of actions,
• A description of the action,
• The status of the action (underway, act now / by X year, monitor or investigate further),
• The range of funding and HR to carry out the action (low, medium or high),
• Next steps, and
• Notes on how well the action addresses evaluation criteria

To view the initial action ideas for Dawson Creek, please visit Appendix G. Detailed Action Plan.

Region-wide
Adapting effectively and building resilience to a changing climate will require action at both a
local and regional level. Actions that lend themselves to regional collaboration were discussed
with the Northeast Climate Risk Network throughout the course of this project. Broadly across
hazards, the Network provides opportunities to:
    • share purchasing power for hard goods or common consultancy needs;
    • advocate as a united front with stakeholders and other levels of government;

                                                                                               26
• avoid costly projects if recommendations or best practices from one municipality can be
transferred to another;
• share progress and discuss barriers and solutions and;
• partner as a group on common projects and work with the regional governments and
other stakeholders.
Hazard-specific opportunities for regional collaboration are summarized in Table 7 below.
Table 7. Potential opportunities for regional collaboration across the Network
Climate Hazard Impact Statement
• Chetwynd and Dawson Creek have parallel processes currently
including identifying and studying the hazard, mapping flood extents,
coming up with mitigation options and including findings in the OCP.
While at different steps, this provides an opportunity to learn from
each process and pass lessons on across BC.
• The region has to work together and work with the Province on
understanding forest management for pest (and wildfire) resilience
• Snow and ice clearing policies and road and bridge closure policies
came up frequently as requiring updates and clear communication to
the public. Sharing policies and best practices makes sense.
• Steaming vs. Heat tracing culverts. A study across municipalities and
conditions would provide more fruitful conclusions and
recommendations.
• PRRD Everbridge Emergency Notification System collaboration
o Freezing rain information and health and social wellness
information is shared on this platform already
• Could intentionally set up to trial different types of materials to use
on various roads during temperature fluctuations.
• Invasive species programs provide another opportunity to learn from
each other and possibly collectively hire consultants.
• There are several sewage and drainage studies underway in the
region. Resultant recommendations could be shared with the
network via webinar with consultants on hand.
• Understanding how to incorporate new rainfall projections and IDF
curves into design could be done by a common consultant or process
shared by one municipality to the others.
• Several municipalities are further ahead on green infrastructure use
(for infiltrating rainfall). Sharing actions and any pamphlets produced
for the public is an opportunity for collaboration.
• Dawson Creek has significant expertise in watershed and riparian
health and may focus more on this area. Best practices could be
27shared through the Network meetings.
• Set up a more formal contact person and liaison between the
Network and the Ministry of Transportation and Infrastructure. They
have done significant work on climate change guidelines and the
Network municipalities identified flooding, landslides and wildfires to
have the potential to limit access to their communities.
• Several communities will refresh or initiate landslide and steep slope
reviews. This provides an opportunity to share consultants or at least
process and best practices. Translating findings into land use controls
may also be an area to share ideas.
(i.e. storms, hail, • Asset management becomes an important element of ensuring
extreme heat, infrastructure is resilient to climate change. Opportunity:
wildfires, landslides) collaborating on a project to apply a climate lens to asset
management (in one area or across the board).
• Air quality monitoring is already completed by Oil and Gas industry.
Collaboration with industry could add air quality data for rural and
urban areas.
• Municipalities have Community wildfire plans at different stages of
development, update and implementation. Opportunity to learn from
each other and also possibly share a consultant from out of town for
economies of scale.
• Fuel removal communication / education campaign could be shared
• Network could partner with the regional health authority to have
consistent messaging on wildfire smoke, heat and health
• Municipalities all work on water conservation techniques for drought.
Many deal with agriculture and/or industry water needs as flow
volumes change, and as a result, there are lessons to be shared.
Key Competencies for Advancing Adaptation
As part of the Gap Analysis at the beginning of this project, the consultant team provided an
initial assessment of Dawson Creek’s stage of development around climate change adaptation
planning, using the Climate Adaptation Maturity Scale developed by the Federation of Canadian
Municipalities. The checklist version used to guide the assessment, is included in Appendix H.
The scale has three competency areas: policy, human resources and governance, and technical
and risk management capacity. Each competency area has 5 levels through which a municipality
can progress.
The competencies are:
• Policy: Putting in place policies and objectives related to the development of an
environment and vision that supports local climate adaptation.
28• Human resources and governance: Ensuring staff and council are equipped with the
mandate, understanding, skills and knowledge needed to support local climate
adaptation.
• Technical and risk management capacity: Preparing the tools needed to deliver
adaptation initiatives and manage operations in a way that minimizes climate risk (e.g.
software, hardware, maps, models, etc.).
At the beginning of this project, Dawson Creek was considered to be at Level 1 for two out of
three competencies (Human Resources and Governance, and Technical and Risk Management
Capacity), and working towards Level 2 for Policy.
At the end of the action planning process, the assessment using the Maturity Scale was
completed again. Based on this assessment, Dawson Creek is working on level 2 for Human
Resources and Governance as they build awareness of the work completed during this project
with decision-makers and leaders across the organization. Level 2 for Policy will be completed
at the end of this project. On Technical and Risk Management Capacity, completing this project
has moved the dial from level 1 to level 3 and for some impacts to level 4 for Dawson Creek.
Staff have been committed to assessing risks, forming a team and brainstorming adaptation
responses. The organization has already put significant resources into planning for climate-
related hazards such as flooding and this project has complemented those efforts.
Next Steps
The Climate Adaptation Team is well-positioned – with an overall understanding of the climate
projections, potential impacts and priority risks – to continue working across disciplines in the
organization and in collaboration with community stakeholders to mitigate risks and build
resilience to changes in climatic conditions moving forward. The initial action ideas included
above and in Appendix G provide direction and focus in these next phases of the work.
An important aspect of implementation is continual monitoring and review. With climate
change, more so than some other things that we plan for, conditions are highly complex and
will continue to change and evolve over time. As a result, we need to continue to monitor
changes to:
1. Climate projections – particularly any regional and local data;
2. Actual and potential impacts – for example, air quality due to wildfire was not a
common concern just a few years ago. New impacts will emerge and existing ones will
evolve;
3. Opportunities to mitigate risks and build resilience – windows of opportunity should be
constantly in mind to take advantage of sources of funding, partnerships, awareness,
and political will, etc.
29It is recommended that the Climate Adaptation Team develop a monitoring and review
strategy to ensure that this function is continually addressed. This may include:
• A review of the climate science every 3-5 years
• A scan of existing and emerging impacts every 1-2 years
• Re-evaluating the top priority impacts and action ideas every 2-3 years
As well, the NECRN is a valuable resource for all communities in the region that will require
ongoing participation and investment of time and energy by its members to cultivate that value.
The Fraser Basin Council will be convening the network in January of 2020, creating an
opportunity to identify some initial areas of collaboration and joint projects. Generating some
early wins and getting some experience in working together across communities would be a
helpful foundation for the work moving forward.
8. Conclusion
The six communities in the Northeast Climate Risk Network have all experienced climate-
related shocks (such as a flood or wildfire) or a stress (such as drier conditions, or more rain-on-
snow events in the winter) in recent years. These events have impacted city services,
community assets and residents. The climate vulnerability assessments have built on the good
work started in each community to prepare and respond to a changing climate.
Based on information provided in an initial community-specific Gap Analysis and the climate
projections for the region for the time periods of the 2050s and 2080s, staff and stakeholders
from the communities and the region identified impacts to a range of service areas. The
vulnerability of certain assets or areas was assessed and risk ratings supported prioritization of
the impacts to ensure that resources can be directed to where they are most needed.
Throughout the process there were opportunities to learn from and share with others across
the network, and to develop capacity within communities to continue with this work. Within
each community, cross-disciplinary staff teams considered the top risks for their community as
they identified and developed action ideas to mitigate risks, and to prepare and respond to the
climate change-related impacts. These teams are well-placed to continue to guide and lead this
work forward into implementation and ongoing monitoring and iterations. A range of possible
ways to work together, capitalize on resources across communities, and maintain and build
capacity as a region were identified.
Together, these assessment results and the initial action ideas developed by the Climate
Adaptation Teams reflect the growing capacity of each community and the Northeast Climate
Risk network as a whole to form a strong foundation for building resilience across the Northeast
Region.
30Appendix A. Risk-based Adaptation Planning Tools
Infrastructure or risk-specific assessments, such as an assessment of a sewerage area or a
coastal flood risk assessment can rely on damage-curves and specific calculations of
consequences to provide quantitative detail where it is needed. Engineers Canada’s PIEVC
protocol has a specific option to undertake a more detailed engineering study—the need for a
more detailed assessment like this is something that may be identified through the more
qualitative risk assessment. This higher level risk assessment has a specific purpose of better
understanding the range of impacts the community may face, and prioritizing across and
between them as a basis for deciding on where to focus their limited resources and time.
The risk-based land use guide for Canada outlines steps for planning including:
• establish the community needs,
• define hazard potential,
• identify what could be harmed,
• calculate potential losses (consequences),
• recommend safe land-use,
• and monitor decision success.
The UKCIP tool (Adaptation Wizard) for planning looks at current climate vulnerability and
future climate vulnerability (risk included) before brainstorming adaptation options and
monitoring and reviewing iteratively.
The ICLEI BARC tool follows 5 milestones including:
• initiating (taking a first look at impacts and adaptation actions underway;
• researching climate science and completing vulnerability and risk assessments;
• planning (identifying and evaluating actions);
• implementation and;
• monitoring and review.
The ICLEI BARC tool relies on clear impact statements throughout the vulnerability and risk
assessments.
The International Standards Association (ISO) published a standard for climate change
adaptation (ISO 14090) in June, 2019. The standard provides a framework to help organizations
consider climate change adaptation in policies, strategies and plans. A companion standard (ISO
14091) is under development currently and will specify risk and vulnerability assessment steps.
In July, 2019 the provincial government published the Preliminary Strategic Climate Risk
Assessment for British Columbia. The publication includes a strategic climate risk assessment
framework for B.C that was developed to be scalable to analyze risks at multiple levels and a
variety of climate-related risks. The framework has 4 steps:
• Understand the Context (including scope and objectives and audience);
• Identify risk events (they use a scenario approach to risk events);
31You can also read