NONSTRUCTURAL RISK REDUCTION EVALUATION RESULTS
←
→
Page content transcription
If your browser does not render page correctly, please read the page content below
2023 DRAFT COASTAL MASTER PLAN

NONSTRUCTURAL RISK
REDUCTION EVALUATION
RESULTS
ATTACHMENT E3

REPORT: VERSION 01
DATE: JANUARY 2023
PREPARED BY: MICHAEL T. WILSON, JORDAN R. FISCHBACH, DAVID R.
JOHNSON, JINGYA WANG, PATRICK KANE, NATHAN GELDNER, AND ABBY
LITTMAN

                                                COASTAL PROTECTION AND
                                                 RESTORATION AUTHORITY
                                                    150 TERRACE AVENUE
                                                  BATON ROUGE, LA 70802
                                                   WWW.COASTAL.LA.GOV
COASTAL PROTECTION AND
RESTORATION AUTHORITY
This document was developed in support of the 2023 Coastal Master Plan being prepared by the
Coastal Protection and Restoration Authority (CPRA). CPRA was established by the Louisiana
Legislature in response to Hurricanes Katrina and Rita through Act 8 of the First Extraordinary Session
of 2005. Act 8 of the First Extraordinary Session of 2005 expanded the membership, duties, and
responsibilities of CPRA and charged the new authority to develop and implement a comprehensive
coastal protection plan, consisting of a master plan (revised every six years) and annual plans. CPRA’s
mandate is to develop, implement, and enforce a comprehensive coastal protection and restoration
master plan.

CITATION
Wilson, M.T., Fischbach, J.R., Johnson, D.R., Wang, J., Kane, P., Geldner, N., Littman, A. (2023). 2023
Draft Coastal Master Plan: Attachment E3: Nonstructural Protection Evaluation Results. Version I. (pp.
36). Baton Rouge, Louisiana: Coastal Protection and Restoration Authority.

2023 DRAFT COASTAL MASTER PLAN. Nonstructural Risk Reduction Evaluation
Results                                                          2

ACKNOWLEDGEMENTS
This document was developed as part of a broader Model Improvement Plan in support of the 2023
Coastal Master Plan under the guidance of the Modeling Decision Team (MDT):
Coastal Protection and Restoration Authority (CPRA) of Louisiana – Stuart Brown, Ashley
Cobb, Madeline LeBlanc Hatfield, Valencia Henderson, Krista Jankowski, David Lindquist,
Sam Martin, and Eric White
University of New Orleans – Denise Reed
The following members of the 2023 Coastal Master Plan Risk Assessment Team prepared this
document:
Michael Wilson – The RAND Corporation
Jordan Fischbach – The Water Institute of the Gulf (The Water Institute)
David Johnson – Purdue University
Jingya Wang – Purdue University
Patrick Kane – The Water Institute
Nathan Geldner – Purdue University
Abby Littman - The Water Institute
We are grateful for the contributions of other members of the Risk Assessment Team, including Chuck
Story (RAND Corporation) and Scott Hemmerling (The Water Institute). Colleagues from The Water
Institute including Hugh Roberts contributed insights to this effort.
2023 DRAFT COASTAL MASTER PLAN. Nonstructural Risk Reduction Evaluation
Results 3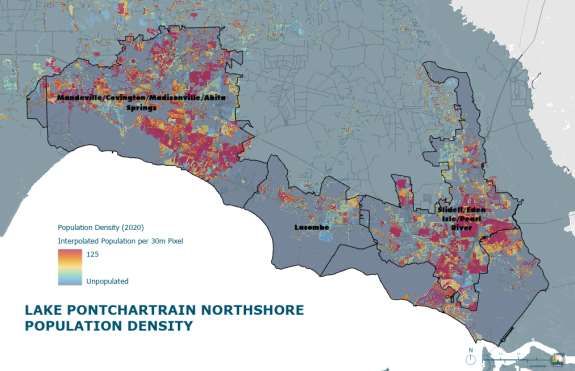
EXECUTIVE SUMMARY
This attachment compiles the nonstructural project results for the 2023 Coastal Master Plan. This
attachment summarizes the mitigation measures derived from the nonstructural technical analysis
conducted using the Coastal Louisiana Risk Assessment (CLARA) model and informs the benefit and
cost competitive programmatic budgets selected by the Planning Tool. As such, a major change from
the 2017 Coastal Master Plan is that there is not a recommended suite of nonstructural projects.
While there are not specific recommendations on the implementation of nonstructural projects in the
master plan, the results may be informative to other state agencies, nongovernmental organizations,
community advocates, and coastal stakeholders who are interested in developing coastal hazard
mitigation plans, comprehensive plans, or other nonstructural mitigation projects. Nonstructural model
results include:
The attributes associated with different nonstructural variants;
A comparison of expected annual damage in dollars (EADD) versus expected annual
structural damage (EASD) benefits over time;
An evaluation of different participation rates;
Comparisons between communities;
A sample of community-level results; and
A methodological discussion of setting targets for Implementation Period 2 (IP2).
This attachment shows nonstructural results for a representative sample of 11 communities along the
coast, with four communities compared in greater detail. While the Risk Assessment Team generated
several variants, the team ultimately only selected two, in conjunction with the Planning Tool Team, for
further analysis. The two variants correspond to a 14 ft 100-year flood depth buyout threshold for both
Implementation Periods 1 and 2 (IP1 and IP2) in Years 0 and 30, respectively. The Planning Tool then
used the results shown here to linearly scale the benefits associated with 25, 50, and 75%
participation rates in their analysis.
2023 DRAFT COASTAL MASTER PLAN. Nonstructural Risk Reduction Evaluation
Results 4
TABLE OF CONTENTS
COASTAL PROTECTION AND RESTORATION AUTHORITY ....................................... 2
CITATION ........................................................................................................ 2
ACKNOWLEDGEMENTS ...................................................................................... 3
EXECUTIVE SUMMARY ...................................................................................... 4
TABLE OF CONTENTS ........................................................................................ 5
LIST OF TABLES ............................................................................................... 6
LIST OF FIGURES ............................................................................................. 7
LIST OF ABBREVIATIONS .................................................................................. 8
1.0 INTRODUCTION .......................................................................................... 9
  1.1 Purpose of this Report ....................................................................................................................... 9
  1.2 The CLARA Model ............................................................................................................................... 9
  1.3 Organization of this Report .............................................................................................................. 10
2.0 PROJECT ATTRIBUTES ............................................................................... 11
  2.1 Definition and Cost of Mitigation Measures ................................................................................... 11
  2.2 Key Changes in the 2023 Coastal Master Plan Analysis ............................................................... 11
  2.3 Generation of Variants ..................................................................................................................... 13
3.0 COMPARISON OF BENEFITS IN SELECTED COMMUNITIES .............................. 15
  3.1 Communities with the Greatest Potential Amount of Overall Risk Reduction .............................. 15
  3.2 Characteristics of Selected Coastwide Communities and Their Types of Nonstructural Mitigation
  ................................................................................................................................................................. 18
4.0 DETAILED EXAMPLES OF COMMUNITY-LEVEL RESULTS ................................. 23
  4.1 Mandeville/Covington/Madisonville/Abita Springs........................................................................ 23
  4.2 Luling/Boutte .................................................................................................................................... 25
  4.3 Franklin ............................................................................................................................................. 27
  4.4 Lake Charles/Prien ........................................................................................................................... 28
5.0 SELECTING VARIANTS FOR IP1 AND IP2 TARGETS IN THE PLANNING TOOL .... 31
6.0 CONCLUSION ........................................................................................... 34
7.0 REFERENCES ............................................................................................ 35

2023 DRAFT COASTAL MASTER PLAN. Nonstructural Risk Reduction Evaluati on
Results                                                          5

LIST OF TABLES
Table 1. Environmental scenario definitions for the 2023 Coastal Master Plan ........ 12
Table 2. Nonstructural protection variants summary ........................................... 14
Table 3. Benefit for 16 most-impacted communities by EADD reduction in dollars
from FWOA for Variant 1 in the lower environmental scenario for Year 20 ............. 16
Table 4. Benefit for 16 most-impacted communities by EADD reduction in dollars
from FWOA for Variant 1 in the lower environmental scenario for Year 50 ............. 17
Table 5. Demographic and socioeconomic characteristics of selected communities. . 19
Table 6. Summary of nonstructural exposure and benefits with Variant 1 in Year 50
under the lower environmental scenario for 11 selected communities. .................. 21
Table 7. Summary of nonstructural attributes by strategy for Variant 1 for 11
selected communities. .................................................................................... 22
Table 8. Summary of nonstructural attributes by asset type in Year 50 for
Mandeville/Covington/Madisonville/Abita Springs outside of levee protection. ........ 25
Table 9. Summary of nonstructural attributes by asset type in Year 50 for
Luling/Boutte inside of levee protection. ............................................................ 26
Table 10. Summary of nonstructural attributes by asset type in Year 50 for Franklin
inside levee protection. ................................................................................... 28
Table 11. Summary of nonstructural attributes by asset type in Year 50 for Lake
Charles/Prien outside levee protection. ............................................................. 30

2023 DRAFT COASTAL MASTER PLAN. Nonstructural Risk Reduction Evaluation
Results                                                          6
LIST OF FIGURES
Figure 1. Map showing representative selection of communities. .......................... 18
Figure 2. Distributions of non-white population versus poverty for both sample set
and all the communities in the master plan. ...................................................... 20
Figure 3. Mandeville/Covington/Madisonville/Abita Springs in the context of
communities located on the Northshore of Lake Pontchartrain. ............................ 24
Figure 4. Luling/Boutte in the context of West Bank communities in the New Orleans
Metropolitan Area. .......................................................................................... 26
Figure 5. Franklin in the context of communities in the Central Coast region. ......... 27
Figure 6. Population density of Lake Charles/Prien and surrounding communities in
the Lake Charles Metropolitan Area. ................................................................. 29
Figure 7. Coastwide comparison of EADD benefit-cost ratios for all variants with Year
0 exposure. ................................................................................................... 32
Figure 8. Coastwide comparison of EADD benefit-cost ratios for all variants with Year
50 exposure. ................................................................................................. 33

2023 DRAFT COASTAL MASTER PLAN. Nonstructural Risk Reduction Evaluation
Results                                                          7
LIST OF ABBREVIATIONS
AEP .............................................................. ANNUAL EXCEEDANCE PROBABILITY
CLARA ................................................... COASTAL LOUISIANA RISK ASSESSMENT
CPRA ................................. COASTAL PROTECTION AND RESTORATION AUTHORITY
EADD ..................................................... EXPECTED ANNUAL DAMAGE IN DOLLARS
EASD ................................................... EXPECTED ANNUAL STRUCTURAL DAMAGE
FWOA ......................................................................... FUTURE WITHOUT ACTION
HSDRRS ..................... HURRICANE AND STORM DAMAGE RISK REDUCTION SYSTEM
IP ............................................................................... IMPLEMENTATION PERIOD
NS.......................................................................................... NONSTRUCTURAL
RCP ................................................ REPRESENTATIVE CONCENTRATION PATHWAY

2023 DRAFT COASTAL MASTER PLAN. Nonstructural Risk Reduction Evaluation
Results                                                          8
1.0 INTRODUCTION
1.1 PURPOSE OF THIS REPORT

This attachment describes the mitigation measures derived from the nonstructural technical analysis
conducted using the Coastal Louisiana Risk Assessment (CLARA) model and informs the benefit and
cost competitive programmatic budgets selected by the Planning Tool to support Louisiana’s 2023
Coastal Master Plan. As such, a major change from the 2017 Coastal Master Plan is that there is not a
recommended suite of nonstructural projects.

Programmatic measures pertain to any activities, not involving physical construction, that use
knowledge, practice, or agreement to reduce risks and impacts, in particular through policies and
laws, raising public awareness, training, and education. CPRA understands that effectively reducing
storm surge flood risk through nonstructural efforts requires the implementation of both physical
projects and programmatic measures. Programmatic measures are often implemented through
planning or policy initiatives and can include land use planning, hazard mitigation planning, flood
ordinances, and building codes. These activities reduce risk to future development within
communities, and therefore are integral elements of achieving risk reduction goals across coastal
Louisiana.

1.2 THE CLARA MODEL

The CLARA model was originally created by researchers at RAND Corporation to support development
of Louisiana’s 2012 Coastal Master Plan. CLARA is designed to estimate flood depth exceedances,
direct economic damage exceedances, and expected annual damage in the Louisiana coastal zone.
The model uses high-resolution hydrodynamic simulations of storm surge and waves as inputs. Monte
Carlo simulation and scenario analyses are used to estimate risk under a range of assumptions about
future environmental and economic conditions and with different combinations of structural and
nonstructural risk reduction projects on the landscape.

Prior peer-reviewed and published literature describes the foundations of the CLARA, so this report
does not include detailed descriptions of the basic methodological approach and assumptions. For
interested readers, an introduction to the model can be found in Johnson et al. (2021a), Fischbach et
al. (2012), and Johnson et al. (2013). Model improvements for the 2017 Coastal Master Plan are
described in Fischbach et al. (2017), and published examples of CLARA model results can be found in
Fischbach et al. (2019), Meyer and Johnson (2019), and Fischbach et al. (2017). Model

2023 DRAFT COASTAL MASTER PLAN. Nonstructural Risk Reduction Evaluation
Results                                                          9
improvements for Louisiana’s 2023 Coastal Master Plan are described in Fischbach et al. (2021).

This report should be of interest to CPRA, state officials, community advocates, and coastal
stakeholders engaged in nonstructural risk mitigation planning processes. The report version reflects
data upgrades and model improvements made as of December 2021.

1.3 ORGANIZATION OF THIS REPORT

There are three sections in this report. The first section (Section 2.0) describes attributes associated
with different nonstructural variants, compares Expected Annual Damage in Dollars (EADD) versus
Expected Annual Structural Damage (EASD) project benefits over time, and evaluates the impact of
different participation rates. Section 3.0 looks at the community-scale impact, comparing 11
communities and Section 4.0 details the results of four sample communities. Section 5.0 is a
methodological discussion of setting targets for the Planning Tool in IP2. Section 6.0 offers concluding
observations.

2023 DRAFT COASTAL MASTER PLAN. Nonstructural Risk Reduction Evaluation
Results                                                        10
2.0 PROJECT ATTRIBUTES
2.1 DEFINITION AND COST OF MITIGATION MEASURES
The CLARA model’s economic damage module has the capability of estimating the risk reduction
effects of various nonstructural mitigation measures. Mitigation measures could include one of the
following approaches (see Section 2.3 for details on how mitigation standards are defined):
Elevation of residential structures. Recommended in areas where the mitigation
standard is greater than 3 feet but less than the elevation for voluntary acquisition
(described below);
Floodproofing of multi-family and non-residential structures. Recommended in areas
where the mitigation standard is less than 3 feet;
Voluntary acquisition for residential structures. Recommended in areas where the
mitigation standard is greater than a pre-specified threshold (variants explored in this
research utilized either 12 or 14 feet of flood depths).
The Risk Assessment Team then applied these measures to each structure within the modeling grid,
with floodproofing and elevation costs as a function of the difference between the ground and
mitigation standard’s elevation as well as the structure’s square footage. Acquisition costs additionally
included the area of the property. More details about the cost database can be found in Attachment
F6: Project Development Database Documentation.
2.2 KEY CHANGES IN THE 2023 COASTAL MASTER PLAN ANALYSIS
The risk assessment research for the 2023 Coastal Master Plan is heavily informed by the 2012 and
2017 master plans. For example, the Risk Assessment Team carried forward assumptions about
nonstructural project attributes such as whether the acquisition threshold would be at 12 or 14 feet
and updated cost tables for the different project types rather than beginning with a new set of analysis
from first principles. In the 2023 analysis, CPRA asked the Planning Tool Team to identify a
programmatic nonstructural budget rather than selecting specific nonstructural risk reduction projects
by community. As such, the Risk Assessment and CPRA teams believed that the assumptions made in
2012 and 2017 were sound without extensive revision, as the Planning Tool would not be directly
characterizing the wide variability in either type or location of nonstructural risk mitigation across
different coastal communities. The Risk Assessment Team generated nonstructural results for four
different asset type categories: single-family residential; multi-family housing; commercial, industrial,
and agricultural; and other structures (public, educational, and religious). However, the Planning Tool
2023 DRAFT COASTAL MASTER PLAN. Nonstructural Risk Reduction Evaluation
Results 11Team utilized only the aggregated cost effectiveness over all asset types in a community when
determining a recommended nonstructural budget (again, given the programmatic nature of the
nonstructural implementation).
While the Risk Assessment Team preserved core assumptions about nonstructural project attributes
from the 2012 and 2017 master plans, the team also made several changes to risk modeling, which
have indirect and direct implications for the analysis of nonstructural mitigation. For example, CPRA
updated its environmental scenarios (Table 1), and the Risk Assessment Team utilized a new synthetic
storm suite of 645 storms based on an augmented dataset (in comparison to the previous inputs of
446 storms), which permitted consideration of relatively mild tropical cyclones excluded from the
scope of analysis in previous plans. The Risk Assessment Team, informed by CPRA and other lines of
effort, updated the population growth scenario used to project asset growth into the future
(Attachment E2: Risk Assessment Mode Improvements). For more information on these updates to the
CLARA model, see Fischbach et al. (2021).
Table 1. Environmental scenario definitions for the 2023 Coastal Master Plan
SCENARIO EUSTATIC SEA LEVEL SUBSIDENCE PRECIPITATION, TROPICAL
RISE (OVER 50 EVAPOTRANSPIRATION, STORM
YEARS) * TRIBUTARY FLOWS INTENSITY
LOWER 0.5 METERS DEEP SUBSIDENCE + RCP 4.5 50 TH +5%
(1.6 FEET) 1ST QUARTILE OF PERCENTILE INCREASE
SHALLOW
SUBSIDENCE
HIGHER 0.77 METERS DEEP SUBSIDENCE + RCP 4.5 50 TH +10%
(2.5 FEET) MEDIAN OF SHALLOW PERCENTILE INCREASE
SUBSIDENCE
* RATE OF CHANGE IS NOT LINEAR.
NOTE: RCP=REPRESENTATIVE CONCENTRATION PATHWAY, A GREENHOUSE GAS CONCENTRATION
TRAJECTORY ADOPTED BY THE INTERGOVERNMENTAL PANEL ON CLIMATE CHANGE.
The most important change in the Risk Assessment Team’s analysis for nonstructural protection in the
2023 Coastal Master Plan was that the team began to model flood damage at the level of individual
structures, as opposed to using assumed structure counts at the census block level. The team
combined data from the National Structure Inventory (Georgist, 2019), ATTOM Data Solutions, the
Homeland Infrastructure Foundation-Level Data (secured and licensed through the Department of
Homeland Security), as well as the results of a project leveraging machine learning techniques in
conjunction with imagery to identify relevant attributes of certain structures (Chen et al., 2022) to
produce a single structure-level dataset for the entire coastal region of Louisiana. Structure values
and risk metrics were estimated for each structure based on its estimated attributes (e.g., first-floor
elevation, square footage).
2023 DRAFT COASTAL MASTER PLAN. Nonstructural Risk Reduction Evaluation
Results 12The use of structure-level damage estimates meant that the treatment of nonstructural mitigation could be handled more explicitly with respect to both the nonstructural attributes themselves and participation rates. While the Risk Assessment and Planning Tool Teams previously modeled nonstructural protection as a change in the aggregate building attributes of an affected census block in the 2017 Coastal Master Plan, the damage model now accounts for attribute changes for each eligible structure assuming full participation in nonstructural mitigation. Expected risk outcomes under alternative participation rates are identified by linear interpolation between the full participation case and a future without action (FWOA). The Risk Assessment Team then assumes that any new structures due to future growth in each census block will have the same attributes as the existing population after nonstructural mitigation has been applied. The damage model addresses future growth by simply multiplying the value of each structure by the proportional change in population. Note that these modeling choices implicitly assume that asset changes and participation in nonstructural mitigation occur uniformly within communities, i.e., without disproportionate mitigation or growth in areas with higher hazard. In principle, the structure-level modeling approach could permit nonstructural analysis at any arbitrary spatial scale. However, residual uncertainty about the attributes of individual buildings could lead to biased estimates if reported using structures as the unit of analysis. Preliminary analysis, documented in Fischbach et al. (2021) found that aggregating risk metrics to the community level was appropriate for reducing bias in risk estimates. The Risk Assessment Team identified 204 communities using parish or municipal boundaries. In addition, the Risk Assessment Team categorized each community based on its location either inside or outside of existing structural protection as necessary, resulting in 291 distinct project geographic areas with non-zero available nonstructural investments (though the team conducted additional revisions to splits along levee features after it completed the main body of analysis for the purposes of the Planning Tool Team). The combination of 291 project areas with two variants and differential participation rates resulted in the suite of 1,164 potential nonstructural projects competed against structural projects in the Planning Tool. 2.3 GENERATION OF VARIANTS Nonstructural project variants are defined by the standards for mitigation heights used to determine which structures should be elevated, floodproofed, or acquired. The standards are determined by median estimates of the 1% annual exceedance probability (1% AEP or 1 in 100-year) flood depths at each CLARA model grid point, under a specified landscape scenario and year, plus two feet of freeboard. The Risk Assessment Team excluded grid point locations with no 1% AEP flood depths from further nonstructural analysis. Project variants differ according to which landscape scenario and year these depths are drawn from, for example, future 1% AEP flood depths under Year 30 conditions (both environmental scenarios), Year 40 conditions (only the higher environmental scenario), and Year 50 2023 DRAFT COASTAL MASTER PLAN. Nonstructural Risk Reduction Evaluation Results 13
conditions (both environmental scenarios). Table 2 shows how the combination of these attribute
variables generated 12 variants for analysis (two of which, Variants 1 and 3, the Planning Tool Team
used in subsequent calculations, as discussed in detail in Section 5.0).

Table 2. Nonstructural protection variants summary

  VARIANT NUMBER           ENVIRONMENTAL          TARGET YEAR FOR 1%         ACQUISITION
                           SCENARIO               AEP FLOOD DEPTH            THRESHOLD

  1                        LOWER                  YEAR 0                     14 FEET

  2                        LOWER                  YEAR 0                     12 FEET

  3                        LOWER                  YEAR 30                    14 FEET

  4                        LOWER                  YEAR 30                    12 FEET

  5                        LOWER                  YEAR 50                    14 FEET

  6                        LOWER                  YEAR 50                    12 FEET

  7                        HIGHER                 YEAR 30                    14 FEET

  8                        HIGHER                 YEAR 30                    12 FEET

  9                        HIGHER                 YEAR 40                    14 FEET

  10                       HIGHER                 YEAR 40                    12 FEET

  11                       HIGHER                 YEAR 50                    14 FEET

  12                       HIGHER                 YEAR 50                    12 FEET

2023 DRAFT COASTAL MASTER PLAN. Nonstructural Risk Reduction Evaluation
Results                                                        14
3.0 COMPARISON OF BENEFITS IN SELECTED COMMUNITIES The Risk Assessment Team’s exploration of nonstructural benefits looked first at communities with the greatest reduction in risk in Years 20 and 50, then a representative selection of communities by the potential strategies across the coast. For the latter, the team considered socioeconomic and demographic variables that may influence stakeholder outreach, opportunities associated with implementation of a nonstructural investment program, or barriers to participation (including whether a building is physically capable of being elevated for a reasonable average budget). 3.1 COMMUNITIES WITH THE GREATEST POTENTIAL AMOUNT OF OVERALL RISK REDUCTION The Risk Assessment Team used two key metrics to evaluate damage and compare benefits. First, EADD is a common indicator used in prior coastal master plans that monetizes impacts ranging from physical destruction of assets such as single-family houses to lost commercial and industrial inventory. Second, and newly implemented in the 2023 Coastal Master Plan, is EASD. EASD captures how many structure-equivalents are impacted by flooding, and to what degree, to reflect equity considerations in risk reduction investments. For example, assuming the same square footage cost and exposure of two single-family houses, the EADD metric would lend more weight to avoided damage to the larger home due to an estimated larger replacement cost, whereas EASD would consider risk to the two homes equally. Similarly, one commercial or industrial facility with a high assessed value may have the same EADD metric as a portion of a neighborhood of single-family homes, whereas the neighborhood would have a higher EASD value for that exposure. Assuming a 100% participation rate, some communities could see significant risk reduction benefits. Table 3 shows the potential EADD reduction benefit (the difference between EADD with and without nonstructural mitigation) for the 16 most impacted communities under the lower scenario and how those results might differ under the higher scenario. The community names reflect the municipality, parish, region, and whether the Risk Assessment Team delimited the geography as being inside or outside of levee protection in the FWOA. For example, the largest absolute potential EADD benefit under both environmental scenarios is in Slidell/Eden Isle/Pearl River in St. Tammany Parish, which represents approximately three-quarters of the total FWOA exposure. In Table 3, EASD benefits in the right set of columns typically track EADD proportionally – though some communities may have greater percentages of commercial or industrial assets that shift the ratio of structure-equivalents to value. 2023 DRAFT COASTAL MASTER PLAN. Nonstructural Risk Reduction Evaluation Results 15
Table 3. Benefit for 16 most-impacted communities by EADD reduction in dollars
from FWOA for Variant 1 in the lower environmental scenario for Year 20
                                  EADD REDUCTION                        EASD REDUCTION
                                  LOWER          HIGHER                 LOWER          HIGHER
                                  SCENARIO       SCENARIO               SCENARIO       SCENARIO
 SLIDELL/EDEN ISLE/PEARL
                              $591M    -75% $625M       -74% 711      -85%    754                -84%
 RIVER-ST. TAMMANY-PO-IN
 LULING/BOUTTE-ST. CHARLES-
                              $391M    -80% $474M       -78% 309      -92%    374                -90%
 BA-IN
 SLIDELL/EDEN ISLE/PEARL
                              $357M    -79% $393M       -79% 298      -82%    325                -81%
 RIVER-ST. TAMMANY-PO-OUT
 MANDEVILLE/COVINGTON/
 MADISONVILLE/ABITA           $199M    -64% $212M       -63% 178      -76%    190                -75%
 SPRINGS-ST. TAMMANY-PO-OUT
 DESTRAHAN/NEW SARPY/
                              $157M    -58% $140M       -56% 126      -66%    113                -64%
 NORCO-ST. CHARLES-PO-IN
 LAFITTE/JEAN LAFITTE/
                              $132M    -67% $141M       -65% 227      -88%    242                -86%
 BARATARIA-JEFFERSON-BA-IN
 BAYOU CANE-TERREBONNE-TE-
                              $86M     -48% $102M       -44% 102      -54%    121                -51%
 IN
 IRISH BAYOU / LAKE
                              $82M     -67% $84M        -66% 104      -86%    107                -85%
 CATHERINE-ORLEANS-PO-OUT
 HOUMA-TERREBONNE-TE-IN       $77M     -19% $84M        -17% 125      -37%    139                -33%
 CHAUVIN-TERREBONNE-TE-IN     $74M     -55% $95M        -56% 115      -74%    144                -75%
 NEW IBERIA-IBERIA-CC-IN      $70M     -33% $78M        -32% 87       -62%    98                 -60%
 MATHEWS / LOCKPORT /
 LOCKPORT HEIGHTS-            $69M     -55% $85M        -55% 95       -68%    118                -68%
 LAFOURCHE-TE-IN
 MORGAN CITY / BERWICK /
                              $69M     -46% $68M        -46% 73       -46%    72                 -46%
 SIRACUSAVILLE-ST. MARY-TE-IN
 RACELAND-LAFOURCHE-TE-IN     $65M     -60% $83M        -60% 68       -60%    87                 -59%
 LAROSE-LAFOURCHE-TE-IN       $53M     -78% $65M        -77% 58       -86%    71                 -85%
 LAROSE-LAFOURCHE-BA-IN       $52M     -67% $53M        -65% 60       -88%    61                 -85%
NOTE: BA=BARATARIA REGION, CC=CENTRAL COAST REGION, PO=PONTCHARTRAIN REGION, AND
TO=TERREBONNE REGION. IN AND OUT INDICATE WHETHER THE COMMUNITY IS INSIDE OR OUTSIDE             OF
EXISTING LEVEE PROTECTIONS.

The absolute benefits of a given nonstructural formulation increase over time by Year 50, especially in
the higher environmental scenario. In Table 4, however, the Risk Assessment Team notes that the
relative EADD benefit declines, rapidly in some cases, relative to FWOA, which suggests that during IP2
a different threshold may be necessary. This attachment explores this further in Section 4 for a small
selection of communities.

2023 DRAFT COASTAL MASTER PLAN. Nonstructural Risk Reduction Evaluation
Results                                                        16
Table 4. Benefit for 16 most-impacted communities by EADD reduction in dollars
from FWOA for Variant 1 in the lower environmental scenario for Year 50
EADD REDUCTION EASD REDUCTION
LOWER HIGHER LOWER HIGHER
SCENARIO SCENARIO SCENARIO SCENARIO
SLIDELL/EDEN ISLE/PEARL
$987M -70% $1,282M -59% 1,221 -82% 1,601 -71%
RIVER-ST. TAMMANY-PO-IN
SLIDELL/EDEN ISLE/PEARL
$698M -78% $960M -69% 577 -79% 780 -69%
RIVER-ST. TAMMANY-PO-OUT
LULING/BOUTTE-ST. CHARLES-
$613M -66% $515M -44% 484 -80% 420 -53%
BA-IN
MANDEVILLE/COVINGTON/
MADISONVILLE/ABITA $294M -56% $328M -39% 272 -67% 294 -48%
SPRINGS-ST. TAMMANY-PO-OUT
BAYOU CANE-TERREBONNE-TE-
$153M -18% $23M -1% 179 -24% 47 -4%
IN
HOUMA-TERREBONNE-TE-IN $152M -10% $125M -5% 341 -25% 298 -12%
CHAUVIN-TERREBONNE-TE-IN $130M -50% $124M -45% 180 -69% 173 -60%
RACELAND-LAFOURCHE-TE-IN $129M -32% $30M -5% 145 -32% 62 -9%
LAFITTE/JEAN LAFITTE/
$126M -59% $127M -51% 202 -81% 207 -70%
BARATARIA-JEFFERSON-BA-IN
MATHEWS/LOCKPORT/
LOCKPORT HEIGHTS- $123M -34% $40M -8% 147 -41% 54 -11%
LAFOURCHE-TE-IN
DESTRAHAN/NEW SARPY/
$119M -57% $126M -56% 92 -65% 98 -65%
NORCO-ST. CHARLES-PO-IN
IRISH BAYOU/LAKE CATHERINE-
$118M -63% $108M -54% 157 -79% 151 -67%
ORLEANS-PO-OUT
NEW IBERIA-IBERIA-CC-IN $115M -31% $160M -25% 139 -54% 194 -42%
FRANKLIN-ST. MARY-CC-IN $95M -50% $115M -37% 142 -69% 174 -53%
LAROSE-LAFOURCHE-TE-IN $93M -72% $83M -62% 91 -79% 82 -68%
MONTEGUT-TERREBONNE-TE-IN $80M -58% $79M -53% 123 -70% 121 -62%
NOTE: BA=BARATARIA REGION, CC=CENTRAL COAST REGION, PO=PONTCHARTRAIN REGION, AND
TO=TERREBONNE REGION. IN AND OUT INDICATE WHETHER THE COMMUNITY IS INSIDE OR OUTSIDE OF
EXISTING LEVEE PROTECTIONS.
The tables above assume 100% participation, which is unlikely. In determining the size of the
nonstructural program, participation rates are important for three reasons:
A feasible participation rate (e.g., less than 100%) means that the budget set aside
for nonstructural projects is more likely to be used to its fullest extent;
Assuming an unrealistically high participation rate (e.g., 75% when it could be closer
to 50%) means that, in aggregate, the Planning Tool will overestimate the potential
benefits for a given cost;
2023 DRAFT COASTAL MASTER PLAN. Nonstructural Risk Reduction Evaluation
Results 17 Assuming a low participation rate (e.g., 25%), the Planning Tool will not select enough
competitive projects and prevent the appropriate allocation of resources between the
implementation periods.
Participation rate linearly scales both the cost and benefit of nonstructural projects.
3.2 CHARACTERISTICS OF SELECTED COASTWIDE COMMUNITIES
AND THEIR TYPES OF NONSTRUCTURAL MITIGATION
Participation rate, in addition to whether a structural protection project is selected benefiting that
community, may be a function of other community characteristics, ranging from the types of structures
(i.e., asset categories) to various socioeconomic variables. While the master plan only considers
nonstructural mitigation at the programmatic level, it may be useful for stakeholder engagement and
future studies to understand the variation across the coast.
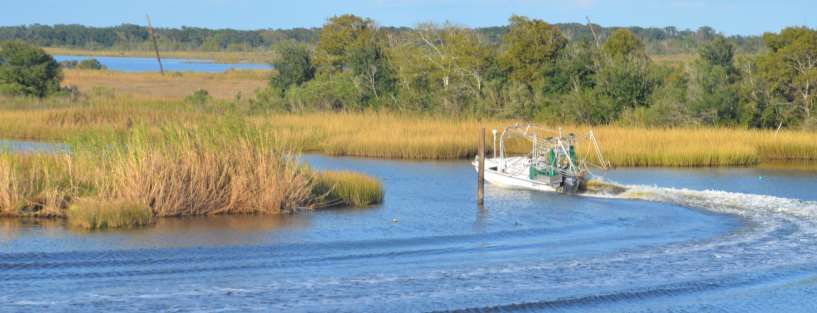
This section shifts focus from the communities with the most potential damage reduction to a
representative selection of 11 communities across the coast (shown in Figure 1). The Risk
Assessment Team chose the communities so that at least two were drawn from each of the master
plan coastal regions, with three being in the Pontchartrain region. The communities range in size from
the largest in their respective region (Lake Charles/Prien or Houma) to among the smallest
communities coastwide (Yscloskey).
Figure 1. Map showing representative selection of communities.
2023 DRAFT COASTAL MASTER PLAN. Nonstructural Risk Reduction Evaluation
Results 18Table 5 draws upon the Attachment C3: 50-Year FWOA Model Output, Regional Summaries – Risk and
provides some context on the demographic breakdown of the included communities. The Risk
Assessment Team considered a variety of factors, ranging from population counts, growth rates,
experience with recovery processes, whether there are existing or planned flood protection structures,
the balance of residential to other asset types, etc. For example, Grand Isle and Yscloskey are
relatively small, substantially exposed communities, where the absolute number of structures
mitigated may have a substantial impact on community health. In contrast, some communities are in
areas that have experienced higher growth since earlier iterations of the master plan (e.g.,
Mandeville/Covington/Madisonville/Abita Springs), while others (like Gonzales/Prairieville) could
experience rapid growth in the future.
Table 5. Demographic and socioeconomic characteristics of selected
communities.
COMMUNITY REGION EXISTING TOTAL PERCENT PERCENT
STRUCTURAL POPULATION NON-WHITE BELOW
PROTECTION? POVERTY
LEVEL
SULPHUR/CARLYSS CHENIER PLAIN NO 33,594 17.7% 11.8%
LAKE CHARLES/ CHENIER PLAIN NO 137,114 45.0% 17.6%
PRIEN
LYDIA CENTRAL COAST YES 2,493 47.2% 30.7%
FRANKLIN CENTRAL COAST YES 8,289 60.5% 19.6%
HOUMA TERREBONNE YES 41,925 43.3% 22.1%
LAROSE TERREBONNE YES 3,056 14.1% 15.3%
GRAND ISLE BARATARIA YES 1,004 6.6% 25.9%
LULING/BOUTTE BARATARIA YES 18,352 33.3% 13.6%
GONZALES / PONTCHARTRAIN YES 102,787 32.5% 7.5%
PRAIRIEVILLE
MANDEVILLE/ PONTCHARTRAIN NO 113,856 18.9% 8.7%
COVINGTON/
MADISONVILLE/
ABITA SPRINGS
YSCLOSKEY PONTCHARTRAIN NO 71 31.0% 11.3%
NOTE: COMMUNITIES ARE ORDERED FROM WEST TO EAST BY REGION.
Other communities, such as Lake Charles/Prien and Sulphur/Carlyss may have been
disproportionately impacted by recent storms such as hurricanes Laura and Delta and have emerging
data on participation rates from recovery processes. In addition, there are several locations, such as
Franklin, where CPRA is considering structural protection projects. It may be of interest to have
additional data to understand the relative distribution of investment and types of benefits planned for
residents. The Risk Assessment Team also considers the impact of these investments at the asset
type level, which might have significance for communities like Houma that contain extensive
commercial and industrial structures.
2023 DRAFT COASTAL MASTER PLAN. Nonstructural Risk Reduction Evaluation
Results 19In comparison to the rest of Louisiana, the communities range from below the state average non-white population of 37% in the cases of Grand Isle, Larose, and Mandeville/Covington/Madisonville/Abita Springs and Sulphur/Carlyss to above the state average in the cases of Franklin and Lydia. When considering population below the poverty line, these communities range from well above the state average of 19% in the case of Grand Isle and Lydia, to well below in the case of Gonzales/Prairieville and Mandeville/Covington/Madisonville/Abita springs. Figure 2 shows the 11 communities in the context of their peers’ coastwide, by percent non-white and below poverty level, typically representing the span of the centrally focused distribution area. Figure 2. Distributions of non-white population versus poverty for both sample set and all the communities in the master plan. NOTE: COMMUNITIES NOT INCLUDED IN THE SET OF 11 ARE DEPICTED IN GREY WHILE THOSE IN THE SET ARE SHOWN AS THE LARGER YELLOW CIRCLES. GON./PRA.=GONZALES/PRAIRIEVILLE, LAKE C./PRI.=LAKE CHARLES/PRIEN, LUL./BOU.=LULING/BOUTTE, MAN./COV.=MANDEVILLE/COVINGTON/MADISONVILLE/ ABITA SPRINGS, AND SUL./CAR.= SULPHUR/CARLYSS. 2023 DRAFT COASTAL MASTER PLAN. Nonstructural Risk Reduction Evaluation Results 20
All these communities have substantial nonstructural potential relative to their size. Table 6, however,
shows that the communities vary in terms of expected benefit. For example, the two Chenier Plain
communities show a relatively low percentage reduction in damage with proposed nonstructural
projects, likely because of relative minor increases in expected flood depths under FWOA (though the
magnitude of benefits is still quite large for the Lake Charles/Prien community due to its size versus
adjacent Sulphur/Carlyss). For applications such as the Planning Tool, whether risk is evaluated on an
EADD or EASD basis matters a lot for communities like Franklin, whereas other communities such as
Gonzales/Prairieville have trivial differences.

Table 6. Summary of nonstructural exposure and benefits with Variant 1 in Year
50 under the lower environmental scenario for 11 selected communities.
                          EADD                                   EASD
 COMMUNITY NAME           FWOA          RISK          %          FWOA          RISK           %
                          EXPOSURE      REDUCTION     CHANGE     EXPOSURE      REDUCTION      CHANGE
 SULPHUR/CARLYSS          $569M         -$41M         -7%        433           -43            -10%
 LAKE CHARLES/PRIEN       $5,151M       -$1,371M      -27%       5,106         -1,874         -37%
 LYDIA                    $1,333M       -$633M        -48%       7,471         -4,779         -64%
 FRANKLIN                 $6,881M       -$3,148M      -46%       48,814        -27,567        -56%
 HOUMA                    $54,065M      -$16,923M     -31%       6,289         -4,260         -68%
 LAROSE                   $7,610M       -$4,189M      -55%       1,325         -613           -46%
 GRAND ISLE               $1,199M       -$341M        -28%       21,907        -15,038        -69%
 LULING/BOUTTE            $33,682M      -$18,498M     -55%       3,943         -1,156         -29%
 GONZALES/
                          $3,115M       -$775M        -25%       14,808        -8,910         -60%
 PRAIRIEVILLE
 MANDEVILLE/
 COVINGTON/
                          $19,077M      -$9,617M      -50%       127           -84            -66%
 MADISONVILLE/
 ABITA SPRINGS
 YSCLOSKEY                $451M         -$109M        -24%       433           -43            -10%

The communities also vary in terms of the type of strategy employed by the typical nonstructural
program implementation (see Table 7). Many communities in the sample lead with elevation as their
primary strategy, though the cost per structure ranges substantially, from $153,000 in Grand Isle to
$262,000 in Luling/Boutte. There is similarly a wide range in acquisition cost per structure from
$290,000 in Yscloskey to $873,000 in Mandeville/Covington/Madisonville/Abita Springs.

2023 DRAFT COASTAL MASTER PLAN. Nonstructural Risk Reduction Evaluation
Results                                                        21
Table 7. Summary of nonstructural attributes by strategy for Variant 1 for 11
selected communities.
COUNT COST
COMMUNITY NAME ELEV. FP. ACQ. ELEV. FP. ACQ.
SULPHUR/CARLYSS 192 385 1 $35.7M $44.7M $0.1M
LAKE CHARLES/PRIEN 1,443 1,880 71 $311.2M $211.2M $21.7M
LYDIA 662 187 0 $113.2M $18.6M $0
FRANKLIN 2,055 445 1 $374.2M $46.9M $0.5M
HOUMA 2,681 1,820 1 $491.6M $198.7M $0.3M
LAROSE 1,544 36 3 $379.6M $3.7M $1.3M
GRAND ISLE 382 114 0 $58.4M $11.7M $0
LULING/BOUTTE 3,308 179 0 $865.8M $18.3M $0
GONZALES/PRAIRIEVILLE 1,058 1,553 7 $214.4M $166.2M $2.5M
MANDEVILLE/COVINGTON/
MADISONVILLE/ABITA 3,243 1,876 35 $832.4M $207.0M $30.6M
SPRINGS
YSCLOSKEY 97 4 59 $23.6M $0.4M $17.1M
NOTE: ELEV.=ELEVATION, FP.=FLOODPROOFING, AND ACQ.=ACQUISITION.
From the perspectives of equity and relative community impacts, acquisitions in Yscloskey would
represent a transformational investment that reflects housing values and the wealth tied to them,
whereas communities with more expensive properties on the Northshore of Lake Pontchartrain (for
example, Mandeville/Covington/Madisonville/Abita Springs has a poverty rate of 8.3% versus a
statewide average of 19.6%) might more readily absorb the community impacts of removing a few
handfuls of houses and the economic change associated with their market-based valuations. There is
substantially less variation in floodproofing cost per structure (this makes sense, as the costs do not
vary by elevation target or replacement value). In communities such as Gonzales/Prairieville and Lake
Charles/Prien, floodproofing is the dominant strategy. The following section examines the potential
implications for four communities in more detail by asset type.
2023 DRAFT COASTAL MASTER PLAN. Nonstructural Risk Reduction Evaluation
Results 224.0 DETAILED EXAMPLES OF
COMMUNITY-LEVEL RESULTS
To develop a deeper understanding of how CPRA and/or communities might implement a
nonstructural protection program, the Risk Assessment Team focused on four communities selected
from the representative sample of 11 indicated above:
Mandeville/Covington/Madisonville/Abita Springs in St. Tammany Parish and the
Pontchartrain region
Luling/Boutte in St. Charles Parish and the Barataria region
Franklin in St. Mary Parish and the Central Coast region
Lake Charles/Prien in Calcasieu Parish and the Chenier Plain region
4.1 MANDEVILLE/COVINGTON/MADISONVILLE/ABITA SPRINGS
St. Tammany Parish faces the highest current exposure to flood risk of any parish, and it is also
experiencing continued rapid population growth. Under FWOA conditions, St. Tammany is also the site
of the largest increase in expected annual damage on the coast. While the risk in
Mandeville/Covington/Madisonville/Abita Springs is not as severe as in nearby Slidell/Eden Isle/Pearl
River, the EADD in year 50 is still substantial. However, the high risk comes with an opportunity for
nonstructural projects to provide substantial damage reduction. For example, in the lower
environmental scenario, the EADD reduction associated with 100% participation in Year 50 is $294M
(-56%) and EASD is 272 structure-equivalents (-67%). Figure 3 shows the population density of
Mandeville/Covington/Madisonville/Abita Springs relative to other Northshore communities.
Additional details on this, and the following communities, can be found in Attachment C3: 50-Year
FWOA Model Output, Regional Summaries - Risk.
2023 DRAFT COASTAL MASTER PLAN. Nonstructural Risk Reduction Evaluation
Results 23Figure 3. Mandeville/Covington/Madisonville/Abita Springs in the context of communities located on the Northshore of Lake Pontchartrain (reproduced from Attachment C3: 50-Year FWOA Model Output, Regional Summaries - Risk). Within this community, Table 8 breaks down elevation, floodproofing, and acquisition costs and counts across multiple asset types. As a predominantly suburban, residential area, it is unsurprising that the mitigation approach applied most often is single-family residential elevation, with an estimated 3,225 structures based on an initial Year 0 threshold (Variant 1) versus approximately 15% more additional structures if using a Year 30 threshold (Variant 3). In contrast, the number of structures floodproofed does not change much by the different variants, whereas the number of acquisitions nearly quadruples, indicating that about 3% of elevations under Variant 1 are sensitive to the amount of sea level rise and other landscape impacts associated with thirty years of change. 2023 DRAFT COASTAL MASTER PLAN. Nonstructural Risk Reduction Evaluation Results 24
Table 8. Summary of nonstructural attributes by asset type in Year 50 for
Mandeville/Covington/Madisonville/Abita Springs outside of levee protection.
                          SINGLE-FAMILY          MULTI-FAMILY        NON-RESIDENTIAL
                          RESIDENTIAL            RESIDENTIAL
                          VAR. 1      VAR. 3     VAR. 1      VAR. 3  VAR. 1      VAR. 3
 ELEVATION COUNT          3,225       3,703      0           0       0           0
 FLOODPROOFING COUNT      1,753       1,774      36          34      68          73
 ACQUISITION COUNT        32          120        3           7       0           0
 ELEVATION COST           $829M       $975M      $0          $0      $0          $0
 FLOODPROOFING COST       $190M       $193M      $4M         $4M     $11M        $12M
 ACQUISITION COST         $25M        $89M       $5M         $12M    $0          $0
 TOTAL NS COST            $1,044M     $1,296M    $9M         $16M    $11M        $12M
NOTE: VAR.=VARIANT. NON-RESIDENTIAL STRUCTURES INCLUDE COMMERCIAL AND INDUSTRIAL AS WELL
AS PUBLIC AND EDUCATIONAL.

4.2 LULING/BOUTTE

The population characteristics for Luling/Boutte are similar to the statewide average, like many of the
other communities in the Barataria region. Though a portion of these communities is within the
Hurricane and Storm Damage Risk Reduction System (HSDRRS) structural protection system, the
CLARA model estimates sharp increases in EADD and EASD under FWOA conditions. Nonstructural
measures, deployed in IP1 or IP2, could help lower exposure. In comparison to
Mandeville/Covington/Madisonville/Abita Springs, a nonstructural program would cover a similar
number of buildings. However, this would lead to a much larger increase in EASD (540 structural
equivalents, representing an 89% reduction from FWOA) as well as in EADD ($667M, 71% less than
FWOA) under the lower environmental scenario. While the raw values of both building equivalents and
dollar damage are comparable in the higher environmental scenario, nonstructural measures cannot
keep pace with the increased flood risk and benefits, with both EASD and EADD reducing FWOA by
approximately 15%. Figure 4 shows the population density of Luling/Boutte relative to the West Bank
communities in the New Orleans Metropolitan Area.

2023 DRAFT COASTAL MASTER PLAN. Nonstructural Risk Reduction Evaluation
Results                                                        25
Figure 4. Luling/Boutte in the context of West Bank communities in the New
Orleans Metropolitan Area (reproduced from Attachment C3: 50-Year FWOA
Model Output, Regional Summaries - Risk).
As with the example in Table 8, Table 9 shows the difference between a Year 0 and Year 30 first floor
elevation target. The elevation target impacts single-family residential structures almost exclusively,
costing between $882M and $1,198M across the entire community. Under Variant 3, there is about a
third more elevation and twice as many structures identified as floodproofing candidates, though no
acquisitions.
Table 9. Summary of nonstructural attributes by asset type in Year 50 for
Luling/Boutte inside of levee protection.
SINGLE-FAMILY MULTI-FAMILY NON-RESIDENTIAL
RESIDENTIAL RESIDENTIAL
VAR. 1 VAR. 3 VAR. 1 VAR. 3 VAR. 1 VAR. 3
ELEVATION COUNT 3,302 4,423 0 0 0 0
FLOODPROOFING COUNT 172 372 1 2 6 57
ACQUISITION COUNT 0 0 0 0 0 0
ELEVATION COST $865M $1,160M $0 $0 $0 $0
FLOODPROOFING COST $17M $38M $0 $0 $1M $10M
ACQUISITION COST $0 $0 $0 $0 $0 $0
TOTAL NS COST $882M $1,198M $0 $0 $1M $10M
2023 DRAFT COASTAL MASTER PLAN. Nonstructural Risk Reduction Evaluati on
Results 264.3 FRANKLIN Like many of the neighboring communities in the Central Coast region, Franklin has a larger Black population than the statewide average, and it is the community with the highest proportion of non- white residents in the sample of 11 discussed above. Like Luling/Boutte, Franklin has some degree of structural protection, but despite the levees, the CLARA model estimates some increases in flood exposure over the modeled period under FWOA conditions. Nonstructural measures could provide substantial risk reduction, for example, approximately $107 million in avoided EADD (-56% of FWOA) and 164 structure equivalents (-79% of FWOA) under the lower environmental scenario conditions. This community has a relatively minor change in damage reduction from nonstructural mitigation under the higher environmental scenario, with reductions of 53% and 76% (3% less than under the lower) for EADD and EASD, respectively. Figure 5 shows the population density of Franklin relative to other communities in the Central Coast. Figure 5. Franklin in the context of communities in the Central Coast region (reproduced from Attachment C3: 50-Year FWOA Model Output, Regional Summaries - Risk). Comparing these numbers to those for Mandeville/Covington/Madisonville/Abita Springs, the Risk Assessment Team finds roughly proportional nonstructural damage reduction on an EADD basis, with 2023 DRAFT COASTAL MASTER PLAN. Nonstructural Risk Reduction Evaluation Results 27
approximately half as many buildings included in structural mitigation. As a result, there is
approximately half as much risk reduction. The comparison in Table 10 is less favorable on an EASD
basis, perhaps because some buildings selected for floodproofing under Variant 1 are selected for
elevation or acquisition in Variant 3.

Table 10. Summary of nonstructural attributes by asset type in Year 50 for
Franklin inside levee protection.
                             SINGLE-FAMILY            MULTI-FAMILY              NON-RESIDENTIAL
                             RESIDENTIAL              RESIDENTIAL
                             VAR. 1      VAR. 3       VAR. 1      VAR. 3        VAR. 1       VAR. 3
 ELEVATION COUNT             2,055       2,775        0           0             0            0
 FLOODPROOFING COUNT         395         307          0           0             50           26
 ACQUISITION COUNT           1           7            0           0             0            0
 ELEVATION COST              $374M       $542M        0           0             0            0
 FLOODPROOFING COST          $40M        $31M         $0          $0            $7M          $5M
 ACQUISITION COST            $0          $2M          $0          $0            $0           $0
 TOTAL NS COST               $414M       $576M        $0          $0            $7M          $5M

4.4 LAKE CHARLES/PRIEN

Lake Charles is the sixth largest city in Louisiana, and its demographic characteristics are similar to
the statewide average. Prior to 2020, the community was experiencing some of the most rapid
population growth in the country (see Attachment C3: 50-Year FWOA Model Output, Regional
Summaries - Risk), though devastating storms and an ensuing housing crisis have led to outmigration.
In the face of these countervailing trends, Lake Charles/Prien is still the largest community in the in
the Chenier Plain region, and as such, has some of the highest absolute risk exposure. Despite its
relative lower flood risk due to its location at the edge of the coastal region, it does have many (and
perhaps more) moderately exposed, single-family residential structures and other assets. This profile
is reflected in CLARA’s calculations, where the percentage benefits of nonstructural projects are
somewhat less than they are for other communities. Figure 6 shows the population density of Lake
Charles/Prien relative to other communities in the Lake Charles metropolitan area.

2023 DRAFT COASTAL MASTER PLAN. Nonstructural Risk Reduction Evaluation
Results                                                        28
Figure 6. Population density of Lake Charles/Prien and surrounding communities in the Lake Charles Metropolitan Area (reproduced from Attachment C3: 50-Year FWOA Model Output, Regional Summaries - Risk). For example, with one-fifth less nonstructural activity, the EADD and EASD benefits under the lower environmental scenario are approximately two-thirds those of Franklin. In part, the relatively low potential for benefit in Lake Charles/Prien is reflected by the kinds of nonstructural projects selected, with Table 11 showing more than half of the buildings are receiving floodproofing. In comparison, only around a third of the buildings are targeted for floodproofing in Mandeville/Covington/Madisonville/ Abita Springs, with the other two communities receiving even less. Table 11 also shows that multi- family residential as well as commercial and industrial floodproofing is markedly more expensive than the same action for single-family residential. Furthermore, the benefit of nonstructural projects for Lake Charles/Prien does not change much in the higher environmental scenario, despite marked increase in flood risk for the region under this scenario. For example, Variant 1 provides 13 to 17% less EADD and EASD reduction, respectively, suggesting that the target selected in IP2 may need to shift upwards, like Variant 3. This may come with relatively small additional cost. 2023 DRAFT COASTAL MASTER PLAN. Nonstructural Risk Reduction Evaluation Results 29
Table 11. Summary of nonstructural attributes by asset type in Year 50 for Lake
Charles/Prien outside levee protection.
SINGLE-FAMILY MULTI-FAMILY NON-RESIDENTIAL
RESIDENTIAL RESIDENTIAL
VAR. 1 VAR. 3 VAR. 1 VAR. 3 VAR. 1 VAR. 3
ELEVATION COUNT 1,443 1,750 0 0 0 0
FLOODPROOFING COUNT 1,660 1,836 51 56 169 176
ACQUISITION COUNT 71 75 0 0 0 0
ELEVATION COST $311M $375M $0 $0 $0 $0
FLOODPROOFING COST $177M $197M $6M $6M $28M $29M
ACQUISITION COST $22M $23M $0 $0 $0 $0
TOTAL NS COST $510M $595M $6M $6M $28M $29M
For Lake Charles/Prien, in contrast to Franklin, the Risk Assessment Team sees a relatively large
difference in FWOA exposure under a higher environmental scenario. Therefore, it is similar to
Mandeville/Covington/Madisonville/Abita Springs and Luling/Boutte. The utility of having an
additional target for nonstructural set by the Planning Tool in IP2 is explored in the next section.
2023 DRAFT COASTAL MASTER PLAN. Nonstructural Risk Reduction Evaluation
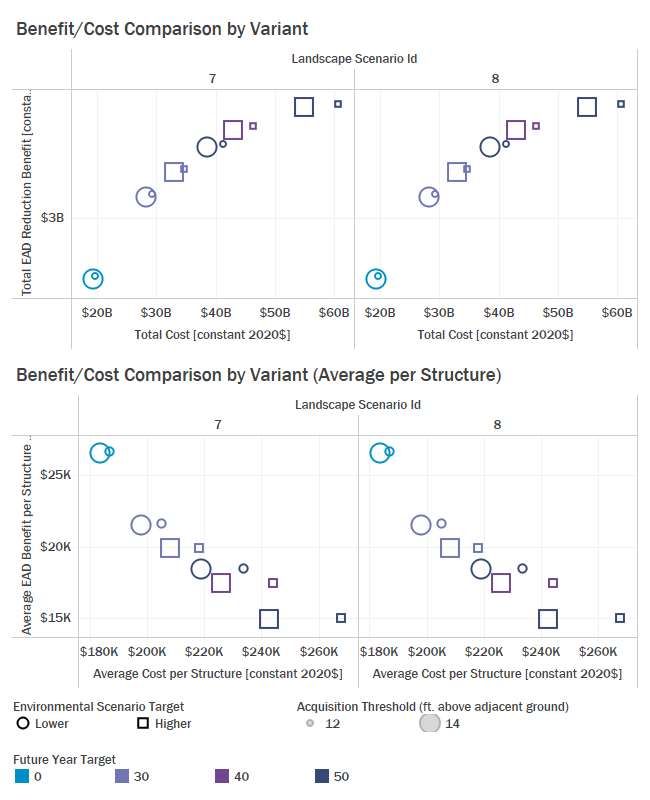
Results 305.0 SELECTING VARIANTS FOR IP1 AND IP2 TARGETS IN THE PLANNING TOOL From the discussion of the example communities above, it is apparent that some communities face dramatically changing flood risks, particularly in the final two decades of the higher environmental scenario, as sea level rise rates of change accelerate. As the Planning Tool considers two implementation periods, and the goal is to have nonstructural investments that provide reliable risk reduction to resident and asset owners in the face of rising flood risk over time, it may make sense to establish a different target elevation for intervention to address the evolving threat. Figure 7 compares the coastwide benefits and costs of all variants considered in this analysis, assuming Year 0 exposure. In the top half of the chart, total nonstructural costs increase linearly with the target year, and the difference between the acquisition thresholds and scenarios for those targets increases exponentially. In contrast, the EADD benefits decrease logarithmically, forming a declining benefit-cost curve. The lower half of the chart, on a per structure basis, mirrors the pattern. Given this profile, it is cost-effective to have a program designed around the initial flood risk, rather than anticipating a future flood risk threshold. The Planning Tool, therefore, used Variant 1, with a Year 0 elevation target and a 14-foot acquisition height for IP1. 2023 DRAFT COASTAL MASTER PLAN. Nonstructural Risk Reduction Evaluation Results 31
Figure 7. Coastwide comparison of EADD benefit-cost ratios for all variants with
Year 0 exposure.

Year 50, shown in Figure 8, shows an entirely different pattern. In the top set of charts, the landscape
scenarios now show substantial difference. For example, the benefit curve flattens much more quickly
for additional nonstructural programmatic cost under the lower environmental scenario. The lower
charts, however, show very clearly a local maximum to benefit-cost ratios around a Year 30 target. The
results for EASD show a similar pattern, and this suggests that thePlanning Tool Team should consider
a different target for IP2 than IP1.

2023 DRAFT COASTAL MASTER PLAN. Nonstructural Risk Reduction Evaluation
Results                                                        32
Figure 8. Coastwide comparison of EADD benefit-cost ratios for all variants with
Year 50 exposure.

Given these results, CPRA decided to use Variant 3 with a Year 30 target and 14 foot acquisition
threshold for IP2. As the landscape scenario defined slightly different flood depths, and therefore
different costs, CPRA also decided to use the lower environmental scenario, as it was slightly more
cost-effective on a coastwide basis (because there was four times more acquisition involved in the
higher scenario). This implies that perhaps slightly more nonstructural protection was selected for the
programmatic funds over less effective structural projects.

2023 DRAFT COASTAL MASTER PLAN. Nonstructural Risk Reduction Evaluation
Results                                                        33
You can also read