NOAA Technical Memorandum NMFS
←
→
Page content transcription
If your browser does not render page correctly, please read the page content below
https://doi.org/10.25923/9cq1-rx80

                       NOAA Technical Memorandum NMFS

                                                                                MAY 2022

   ABUNDANCE OF HUMPBACK WHALES (MEGAPTERA
NOVAEANGLIAE) WINTERING IN CENTRAL AMERICA AND
SOUTHERN MEXICO FROM A ONE-DIMENSIONAL SPATIAL
                      CAPTURE-RECAPTURE MODEL

  K. Alexandra Curtis1, John Calambokidis2, Katherina Audley3, Melvin G. Castaneda4,
         Joëlle De Weerdt5, Andrea Jacqueline García Chávez3, Frank Garita6,
Pamela Martínez-Loustalot7, Jose D. Palacios-Alfaro6, Betzi Pérez6, Ester Quintana-Rizzo8,
   Raúl Ramírez Barragan3, Nicola Ransome4,9, Kristin Rasmussen6, Jorge Urbán R.7,
       Francisco Villegas Zurita10, Kiirsten Flynn2, Ted Cheeseman11, Jay Barlow1,
                           Debbie Steel12, and Jeffrey Moore1

                 1
                     NOAA Fisheries, Southwest Fisheries Science Center
                                 2
                                   Cascadia Research Collective
                                       3
                                         Whales of Guerrero
                               4
                                 Proyecto Megaptera El Salvador
                      5
                        Vrije Universiteit Brussel, and Association ELI-S
                                           6
                                             Panacetacea
                        7
                          Universidad Autónoma de Baja California Sur
                                       8
                                         Simmons University
                                       9
                                         Murdoch University
                       10
                           Universidad del Mar, and Yubarta Ecoturismo
                        11
                           Southern Cross University, and Happywhale
                                    12
                                       Oregon State University

                             NOAA-TM-NMFS-SWFSC-661

                       U.S. DEPARTMENT OF COMMERCE
                  National Oceanic and Atmospheric Administration
                         National Marine Fisheries Service
                        Southwest Fisheries Science Center
About the NOAA Technical Memorandum series
The National Oceanic and Atmospheric Administration (NOAA), organized in 1970, has
evolved into an agency which establishes national policies and manages and conserves
our oceanic, coastal, and atmospheric resources. An organizational element within
NOAA, the Office of Fisheries is responsible for fisheries policy and the direction of the
National Marine Fisheries Service (NMFS).
In addition to its formal publications, the NMFS uses the NOAA Technical Memorandum
series to issue informal scientific and technical publications when complete formal review
and editorial processing are not appropriate or feasible. Documents within this series,
however, reflect sound professional work and may be referenced in the formal scientific
and technical literature.
SWFSC Technical Memorandums are available online at the following websites:
SWFSC: https://swfsc-publications.fisheries.noaa.gov/
NOAA Repository: https://repository.library.noaa.gov/
Accessibility information
NOAA Fisheries Southwest Fisheries Science Center (SWFSC) is committed to making
our publications and supporting electronic documents accessible to individuals of all
abilities. The complexity of some of SWFSC's publications, information, data, and
products may make access difficult for some. If you encounter material in this document
that you cannot access or use, please contact us so that we may assist you.
Phone: 858-546-7000
Recommended citation
Curtis, K. Alexandra, John Calambokidis, Katherina Audley, Melvin G. Castaneda, Joëlle
De Weerdt, Andrea Jacqueline García Chávez, Frank Garita, Pamela Martínez-Loustalot,
Jose D. Palacios-Alfaro, Betzi Pérez, Ester Quintana-Rizzo, Raúl Ramírez Barragan,
Nicola Ransome, Kristin Rasmussen, Jorge Urbán R., Francisco Villegas Zurita, Kiirsten
Flynn, Ted Cheeseman, Jay Barlow, Debbie Steel, and Jeffrey Moore. 2022. Abundance
of humpback whales (Megaptera novaeangliae) wintering in Central America and
southern Mexico from a one-dimensional spatial capture-recapture model. U.S.
Department of Commerce, NOAA Technical Memorandum NMFS-SWFSC-661.
https://doi.org/10.25923/9cq1-rx80Executive Summary
Humpback whales (Megaptera novaeangliae) off the U.S. West Coast are a mixture of
whales from different Distinct Population Segments (DPSs) under the U.S. Endangered
Species Act (ESA), predominantly Central America and Mexico. Within DPSs,
demographically independent populations (DIPs) of humpback whales are delineated as
‘migratory herds’ that share both wintering and feeding areas (Martien et al., 2020). The
Central America DPS, composed of those whales that winter along the Pacific coast of
Central America from Panama to Guatemala, corresponds to a single DIP that migrates
almost exclusively to the U.S. West Coast. This DIP’s wintering area is understood to
extend into southern Mexico, and it is termed the CentAm/SMex-CA/OR/WA DIP for its
wintering area and its feeding area off California, Oregon, and Washington (Fig. 1)
(Taylor et al., 2021). The Mexico DPS includes multiple DIPs, with the DIP that migrates
between northern mainland Mexico and the U.S. West Coast correspondingly termed
the MMex-CA/OR/WA DIP (Martien et al., 2021). DIP-specific estimates of the number
of whales using the U.S. West Coast Exclusive Economic Zone (EEZ), which are thus
equivalent to estimates of the number of whales from each DPS using this feeding area,
would be useful for management and decision-making involving these population units.
We estimated abundance for the CentAm/SMex-CA/OR/WA DIP from photo-
identification data collected in their wintering area from 2019 to 2021. A randomization
test suggested some fidelity in individual space use off Central America and Southern
Mexico, implying that variable effort in time and space should be considered in capture-
recapture estimates. We fitted a closed, one-dimensional spatial capture-recapture
model to annual capture histories using a Bayesian framework. We accounted for
uncertainty in the northern limit of the population and in the potential for movement of
individuals across that limit by varying the northern population limit within the base
model and exploring sensitivity to the northern boundary of the model domain in two
alternate models.
We multiplied posterior distributions of abundance from the base and alternate models
by a correction factor distribution, which was based on prior and new simulation work
quantifying key expected sources of bias. The main sources of bias anticipated in
estimating abundance for this dataset from a closed population model include births and
deaths during the period of data collection, exclusion of first-year calves from the
dataset, and sex heterogeneity in capture probability, which we assessed at a 3.4-fold
(CV=0.463) greater chance of photo-identifying male individuals than females off
Central America and Southern Mexico. The mean resulting correction factor is 1.35
(CV=0.143).
The base model produces a mean bias-corrected abundance estimate of 1,496
(CV=0.171), with a 20th percentile of 1,284. Alternate models with different northern
model domain boundaries produce mean bias-corrected estimates of 1,313 (CV=0.167)
and 1,601 (CV=0.166), corresponding to -12% and 7% differences in the 20th percentile
from the base model. Comparison of the new abundance estimate for the
1CentAm/SMex-CA/OR/WA DIP to one from 2004-06 that omits southern Mexico (Wade,
2021) suggests that the annual population growth rate is much lower than the 8.2% rate
estimated for humpback whales off the U.S. West Coast as a whole (Calambokidis and
Barlow, 2020). Population growth rate calculated directly from the current estimate
including Southern Mexico and the Wade estimate is 4.8% per year (SD = 2.0%).
Resummarizing our model results to exclude Southern Mexico animals results in a rate
of 1.6% per year (SD = 2.0%).
We deduced the number of humpback whales from the MMex-CA/OR/WA DIP
migrating to the U.S. West Coast EEZ by subtracting the new estimate for the
CentAm/SMex-CA/OR/WA DIP from the most recent estimate of total abundance in the
U.S. West Coast EEZ used in the draft 2021 stock assessment report (Calambokidis
and Barlow, 2020; 86 FR 58887, October 25, 2021). The resulting mean estimate of
abundance for humpback whales from the MMex-CA/OR/WA DIP using U.S. West
Coast waters is 3,477 animals (CV=0.101).
Introduction
Humpback whales (Megaptera novaeangliae) have a circumglobal distribution, with
most populations migrating between high-latitude feeding areas and low-latitude
wintering areas (Kellogg, 1929). Individuals show fidelity to both their feeding and
wintering areas. In the North Pacific, the relationships among humpback whale
wintering and feeding areas are predominantly many-to-many, with animals from
multiple wintering areas occurring in one feeding area, and vice versa (Calambokidis et
al., 2001; Baker et al., 2013).
Under U.S. law, humpback whales are protected by the Endangered Species Act (ESA)
and the Marine Mammal Protection Act (MMPA). While the two laws share similar goals
of conservation and management of threats, the units for conservation differ. The unit of
conservation under the ESA is a taxonomic species or a Distinct Population Segment
(DPS) of a species. The unit of conservation under the MMPA is a “stock” of marine
mammals, usually comprised of one or more demographically independent populations
(DIPs).
Humpback whales in the North Pacific have been split into five DPSs under the ESA,
based on genetic differences among wintering areas (Baker et al., 2013; 81 FR 62260,
September 8, 2016). The vast majority of humpback whales occurring off the U.S. West
Coast belong to the Central America DPS and the Mexico DPS (Calambokidis et al.,
2000; Wade et al., 2016), which are listed as endangered and threatened, respectively,
under the ESA. A much smaller number of whales from the Hawaii DPS have also been
sighted or tagged in U.S. West Coast waters (Palacios et al., 2020; Calambokidis et al.,
2000, 2001), and one animal seen near the border of Washington and British Columbia
was even identified as being from the Western North Pacific DPS (Darling et al., 1996).
2At the population level, individuals that share both feeding and wintering areas are
considered to belong to the same “migratory herd”, a unit considered to be
demographically independent from other migratory herds (Martien et al., 2020). Almost
all whales in the Central America DPS migrate to the U.S. West Coast to feed, which
corresponds to a single demographically independent population (DIP), known as the
CentAm/SMex-CA/OR/WA DIP (Taylor et al., 2021). Whales from the Mexico DPS
migrate either to the U.S. West Coast or to destinations further north off British
Columbia, Alaska, the Aleutian Islands, and Russia, so they include multiple DIPs
(Calambokidis et al., 2000; Urbán et al., 2000; Wade et al., 2016; Martien et al., 2021;
Cheeseman, unpublished data). Those whales migrating from mainland Mexico to the
U.S. West Coast are termed the MMex-CA/OR/WA DIP (Martien et al., 2021). Recent
population estimates are available for total humpback whales in the U.S. West Coast
EEZ (Becker et al., 2020; Calambokidis and Barlow, 2020), but not for abundance of
whales from each of the two main contributing DIPs, which also would align with DPS-
specific abundances.
The abundance of humpback whales in the North Pacific has been estimated at the
basin scale and for individual feeding and wintering areas from photo-identification data
collected in a coordinated effort called SPLASH (Structure of Populations, Levels of
Abundance and Status of Humpback Whales in the North Pacific) (Barlow et al., 2011;
Wade et al., 2016; Wade, 2021). SPLASH sampled all known wintering and feeding
areas of humpback whales synoptically and repeatedly from 2004 to 2006
(Calambokidis et al., 2008). The wintering area abundance estimate from SPLASH for
the Central America DPS is now 17 years old and also geographically out of date. Very
few samples were obtained from Southern Mexico during SPLASH, and it was not
included in either of the adjacent DPSs (Central America or Mexico) in analysis. The
wintering area of the CentAm/SMex-CA/OR/WA DIP is now recognized as including
southern Mexico based on recent photo-identification and genetic data, adding many
animals to the population and rendering historic estimates inapplicable (Fig. 1; García
Chávez et al., 2015; Ramírez Barragan et al., 2019; Martínez-Loustalot et al., 2020;
Taylor et al., 2021). The abundance of humpback whales off the U.S. West Coast has
been updated using mark-recapture analysis of photo-identification data collected off
California and Oregon, with the most recent estimate (4,973 ±239 SE) based on data
from 2015 to 2018 (Calambokidis and Barlow, 2020). A separate study using
independent data and a different approach, habitat-based density estimation based on
2018 line-transect data along the entire U.S. West Coast, arrived at similar numbers,
though with less precision (4,784 ±1,469 SE) (Becker et al., 2020). The former estimate
was used in the draft 2021 stock assessment report for California/Oregon/Washington
humpback whales (86 FR 58887, October 25, 2021).
Humpback whale photo-identification effort varies temporally and spatially off the
Central American, Mexican, and U.S. West Coasts, which violates the assumptions of
simple mark-recapture analysis methods. Moreover, humpback whales off the U.S.
West Coast have been observed to exhibit spatial fidelity within their feeding area,
3returning to similar locations each year (Calambokidis, unpublished data), which leads
to individual heterogeneity in capture rates if effort is not spatiotemporally uniform.
Similar individual fidelity to specific wintering locations is also likely. Spatial capture-
recapture models, originally developed for terrestrial wildlife studies employing camera
trap arrays, allow analysis of data with spatiotemporal heterogeneity in capture
probability and individual variation in space use. These models have been adapted to
one-dimensional systems, such as rivers, which closely approximate the narrow band of
habitat along the coast that humpback whales inhabit (Royle et al., 2013).
We conducted a closed-population, mark-recapture analysis to estimate abundance of
the CentAm/SMex-CA/OR/WA DIP from photo-identification data collected in its
wintering area. First, we assessed divergence of individual space use from random for
this population within its wintering area. We adapted a closed, one-dimensional, spatial
capture-recapture framework to the context of spatially continuous photo-identification
data collected in a narrow coastal band without effort information, and estimated
population size from three years of spatial annual capture histories from 2019 to 2021.
Sex heterogeneity in capture probability can also be an important source of bias in
abundance estimates based on photo-identification data from wintering areas (Brown et
al., 1995; Barlow et al., 2011). We estimated sex heterogeneity in capture probabilities
in the CentAm/SMex-CA/OR/WA DIP’s wintering area from capture histories of known-
sex animals, quantified this source of anticipated bias in the abundance estimate using
simulation, and combined the results with existing estimates of bias due to births,
deaths, and exclusion of first-year whales from the North-Pacific-wide analysis to
estimate a corrected abundance (Barlow et al., 2011). Finally, we calculated an
estimate of the number of whales from the MMex-CA/OR/WA DIP using U.S. West
Coast waters by subtracting the abundance estimate for the CentAm/SMex-CA/OR/WA
DIP from the most recent U.S. West Coast capture-recapture-based abundance
estimate.
Methods
We used sightings of humpback whales that were individually identified based on
pigmentation, scarring, shape, and trailing edge serration in photographs of the ventral
side of their flukes. These were collected both opportunistically and during dedicated
research surveys, primarily from small vessels conducting daily trips from different
locations in five Central American countries and southern Mexico (western Panama to
Guerrero, Mexico) during the winter season. The winter season for a given year is
defined as November of the preceding year to April, and also corresponds to the annual
occasions we used for mark recapture analysis, so henceforth “year”, “annual”, or
“occasion” all refer to this definition of the winter season. While our analysis focused on
the data from the 2019 to 2021 seasons, we also used the entire available data series
from 1988 to 2021 for some elements of the analysis as detailed below. These
photographic identifications have been the basis of a number of past analyses using
4subsets of these data (e.g., Rasmussen et al., 2011; Dobson et al., 2015; García
Chávez et al., 2015; Steiger, et al., 2017; Ramírez Barragan et al., 2019; Ortega-Ortiz et
al., In press). These include a coordinated effort and analyses from a collaborative
North-Pacific-wide effort called SPLASH, conducted from 2004 to 2006, that included
Central America and southern Mexico (Calambokidis et al. 2008, Barlow et al. 2011,
Wade et al. 2016).
Photographic equipment and scoring and matching of identification photographs have
changed through the years. Prior to 2005, photographs were generally taken with film
SLR cameras with telephoto lenses, and after 2005, generally with Digital SLR
cameras. For each individual humpback whale photographed in an encounter, the best
photograph of the ventral side of the fluke was selected. Photographs were historically
assigned to three quality levels based on five quality features (proportion visible, vertical
angle, lateral angle, focus/sharpness, and exposure), using the same process
developed previously (Calambokidis et al., 1997, 2000, 2008); more recently, a fourth,
lower quality category has been added, as automated matching capabilities exceeded
manual matching capabilities (see below) (Table 1). Photographs in the lower two
quality levels were generally only retained for matching under special circumstances
(e.g., photographs of individuals with a biopsy or known since birth). Photographs of
individuals that matched the existing Cascadia Research Collective catalog of known
individuals were assigned the corresponding identification number; those that did not
match were assigned a new identification number and added to the catalog as new
individuals. Through 2015, matching was performed manually by experienced matchers
who compared photographs to similar ones based on general coloration patterns
(Katona and Whitehead, 1981). From 2016 onward, increasing levels of automated
matching were incorporated into the photo-identification matching process as
automated matching algorithms developed and implemented through the Wildbook and
Happywhale platforms. Initially, image recognition automation assisted with finding
matches while manual review was retained to confirm new individuals (Flynn et al.,
2017; Weideman et al., 2017; Weideman et al., 2020). In 2019, a sufficiently accurate
algorithm was established that exceeded the accuracy of manual matching, allowing
review of all previous identifications and more rapid management of new data
(Cheeseman et al., 2021). All matches continue to be verified by humans.
We used data from the most recent three years (2019-2021), aggregated to annual
occasions, to estimate abundance with a closed capture-recapture model. During this
time, photographic identifications were not gathered in all locations in every year,
especially in 2020 due to the start of the global pandemic in March, and identifications
came from varying amounts of survey time in each region (Table 2). In 2021, a
coordinated undertaking to obtain identifications in all countries/regions resulted in more
dedicated surveys, more even effort among locations, and the largest sample of
identifications compared to any previous year (Table 2). For the 2019-2021 period,
information on survey effort was available only for 2021 at the time of the analysis.
5Several violations of the assumptions of a closed-population model with constant
capture probability among occasions and individuals (i.e., an M0 model) are likely for
this dataset, including (1) variation in effort with time, (2) non-random sampling of the
population, (3) errors in photo matching to the catalog, and (4) violation of the
population closure assumption. These sources of bias were, where possible, assessed
directly for this population, and addressed through data filtering, model specification, or
estimation of bias correction factors from simulation.
Data filtering
Photographs in the lower two quality levels were omitted to minimize one cause of non-
random sampling, individual heterogeneity in capture probability resulting from lower
quality thresholds for individuals of interest. With use of Happywhale’s matching
algorithm, this quality filter, and exclusion of first-year whales (which may undergo
substantial change in markings), bias due to missed matches is expected to be
negligible in this data set (Cheeseman et al., 2021).
Model development: Assessment of potential biases
We further considered the following potential sources of bias: varying effort by occasion,
varying effort with space and potential for associated non-random sampling, and sex
heterogeneity in capture probability in the wintering area leading to non-random
sampling. We did not consider individual heterogeneity, effectively assuming that given
sex and individual space use, all whales are otherwise equally likely to fluke up, migrate
to the wintering area, and migrate at a time overlapping with sampling in the wintering
area.
Extensive variation in annual captures is evident in both time and space from 2019 to
2021 (Fig. 2). Spatial variation in capture probability is a concern if the population does
not mix completely over its range among capture occasions. We used photo-
identification data collected in the Central American and southern Mexico wintering area
from 1988 to 2021 to test whether individuals are redistributed randomly or show
consistency in spatial location among annual occasions (i.e., site fidelity at a finer scale
than the extent of the population’s wintering area). Data were subset to individuals
captured during more than one occasion (totaling 268 individuals, or 31% of all
identified whales). Distance along the relatively linear coast of Central America and
southern Mexico was approximated by latitude. To account for spatiotemporal variation
in effort, we compared mean individual differences in capture latitude among occasions
from 1,000 replicates each of true and permuted datasets, preserving the distribution of
effort for each occasion. For each replicate, a true dataset was drawn from a complete
daily-resolution dataset of captures, randomly subsampling at most one daily mean
capture location per occasion per individual. A corresponding “test” dataset was created
6by permuting individual identifications among all capture locations within each occasion.
For each dataset, mean distance among annual capture locations was calculated for
each individual, then averaged across individuals for an overall mean inter-occasion
distance per dataset (see Appendix A for code). The resulting distributions of true and
permuted distances among captures on different occasions show that the individual
distances among captures on different occasions are less than expected at random in
the wintering area, indicating some level of site fidelity within the population’s wintering
area (Fig. 3). Results were similar when distances were calculated in kilometers from
latitude and longitude. Whales may be identified en route to a destination further south,
and much of the effort since 2014 has been in the northern portion of the wintering area
in Southern Mexico, so we also ran the test constrained to data from 1988 to 2013, with
similar results.
To assess sex heterogeneity in capture probability in the wintering area for the
CentAm/SMex-CA/OR/WA DIP, we compared the number of annual recaptures of
males versus females over the full time series (1988-2021), using individuals that were
genetically sexed from biopsies taken independently off the U.S. West Coast (Baker et
al., 2013; Martien et al., 2020). Photo-identifications for quantifying annual captures
were filtered for quality following the same procedure as for capture-recapture analysis
(see “Data Filtering”). Genetic sex assignment followed either of two methods, using the
Sry gene (Gilson et al., 1998) or the ZFX/ZFY 5’ exonuclease qPCR assay (Morin et al.,
2005). Where assigned sex from more than one biopsy for the same animal disagreed,
the assigned sex from the more accurate Morin et al. (2005) technique was used.
Biopsies were filtered to those for which certainty of associated tail fluke identification
was positive or probable, including all biopsies collected before this field started being
assigned. Males were recaptured an average of 0.81 times (±0.133 SE, n=68), and
females an average of 0.24 times (±0.104 SE, n=34). We approximated the ratio of
male to female recaptures, and thus capture probabilities, as a lognormal distribution
with the median equal to the ratio of the means, 0.81/0.24 = 3.4, and coefficient of
variation (CV) CVh estimated analytically from the CVs of male and female recapture
frequencies, CVm and CVf, as
.
Model development: Specification and data preparation
We specified a closed capture-recapture model using parameter-expanded data
augmentation (Royle et al., 2007; Royle and Dorazio, 2012), and fitted it using a
Bayesian analytical approach. Capture histories were aggregated to annual occasions,
with or without a spatial dimension, as described below. The observed dataset was
augmented by all-zero capture histories such that the total number of M potential
individuals did not constrain the posterior for total existing individuals in preliminary
7Markov Chain Monte Carlo (MCMC) simulations. A latent state of existence was
estimated for each individual zi with probability ψ as
,
using a vague prior for ψ,
.
In a non-spatial model, realized abundance N is equal to total existing individuals Ʃzi,
and expected abundance is ψM.
Given evidence for some level of spatial fidelity and the spatially and temporally
unbalanced sampling design (Fig. 2), we adapted a spatial capture-recapture (SCR)
framework to account for individual space use (Efford 2004; Royle et al., 2013). Spatial
capture-recapture models were originally developed for terrestrial wildlife studies
employing camera trap arrays, and allow analysis of data with spatiotemporal
heterogeneity in capture probability and individual variation in space use. We
approximated space as one-dimensional, in degrees latitude, since the adjoining coast
is roughly linear over the range of the population’s wintering area (Fig. 1). A latent
‘center of activity’ covariate si, a latitude value, was estimated for each individual i,
constrained to the model domain. Those individuals with an estimated si within specified
population limits, which are potentially distinct from but contained within the model
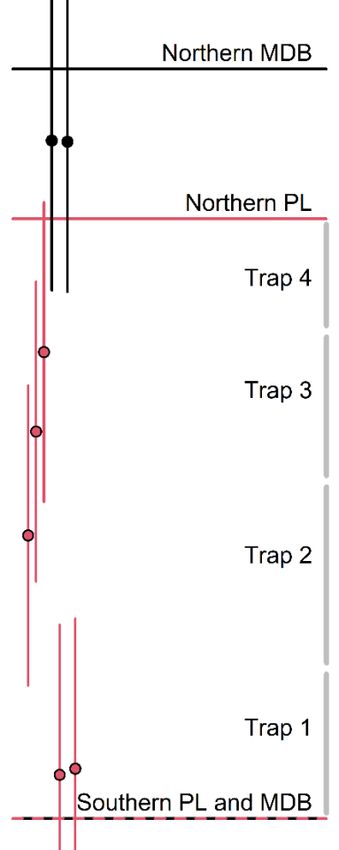
domain boundaries, were counted as part of the population (Fig. 4). The southern model
domain boundary was defined as the accepted southern limit of the DIP, at the southern
border of Panama (~7.25°N). The northern model domain boundary was defined as the
northern border of the Mexican state of Colima (~19.2°N), halfway between the northern
coastal border of Guerrero (~18°N) and the southern end of Bahía de Banderas, Jalisco
(~20.4°N). We used a vague prior for si, corresponding to the model domain:
.
We accommodated uncertainty in the northern population limit, which may overlap with
the Mexico DPS between the states of Guerrero and Nayarit (Taylor et al., 2021), by
uniformly varying it from 18°N to 19.2°N in summarizing abundance from the posteriors.
We explored model uncertainty in terms of sensitivity to the northern model domain
boundary, and thus to the range of geographic activity centers from which animals are
“allowed” to be sighted in Guerrero, by fitting models with alternate northern model
domains bounded to the north instead at 18.6°N (approximate northern border of
Michoacán state) and 20.4°N. Both of these alternate scenarios used a northern
population limit of 18.6°N, resulting in an envelope of reasonable minimum and
maximum population estimates that capture the extent of geographic uncertainty in the
population’s distribution.
To create spatial annual capture histories that we could fit without effort information, we
discretized capture locations into eight “traps” based on breaks in capture locations for
8the full 1988 to 2021 time series. Seven of these traps contained captures for the 2019
to 2021 dataset (Fig. 2). Spatial captures within each trap were approximated as a point
location, calculated as the mean latitude of all daily-level captures in that trap, so trap
point locations correspond roughly to locations of focused field effort. Preliminary
analyses showed abundance estimates were not sensitive to shifting cutoff points
between traps or to increasing the number of traps. Individual capture probability by
occasion and trap was calculated as
,
where Xj is the latitude of trap j, p0 is the capture probability intercept, which was
allowed to vary by occasion k and trap j and given a uniform prior between zero and
one,
,
and σ is the standard deviation of a univariate normal model of individual space usage,
with vague prior
.
The model for the individual encounter events is
,
where yi,j,k is a binary variable recording whether individual i was observed in trap j and
occasion k.
Preliminary simulations indicated that this model tends to underestimate abundance in
the parameter space of this analysis, with more accurate results returned by a model
assuming a constant capture probability intercept across traps and occasions. However,
preliminary abundance estimates from the two models were very similar, and the
individual activity centers estimated in the model with constant capture probability were
likely biased northward by the geographic gradient in effort (Table 2), so we used the
model with space-and time-varying capture probability intercepts.
A non-spatial model with time-varying capture probabilities (i.e., an Mt model; Otis et al.,
1978) with an otherwise similar specification using Bayesian parameter-expanded data
augmentation was also fitted to the data for comparison to the results of the SCR model
described above, providing additional information with respect to model uncertainty.
Preliminary simulation results based on maximum likelihood estimation (MLE)
suggested that a model incorporating individual capture heterogeneity (i.e., an Mh
model; Otis et al., 1978), such as that caused by sex heterogeneity, would not produce
reliable results in the parameter space of this analysis. Mh models explored included
Chao’s, Poisson, and Darroch’s models. Directly modeling sex heterogeneity was also
not a viable option, because little or no information on sex heterogeneity in capture
9probability was captured within the sparse 2019-2021 dataset. Instead, sex
heterogeneity was addressed by estimating bias from simulations (see Bias estimation).
The posterior distribution for abundance was then multiplied by the estimated
distribution for bias correction to obtain a corrected abundance posterior.
Three MCMC chains were run for 22,500 iterations each after a burn-in of 2,500
iterations for the non-spatial Mt model, and for 55,000 iterations each after a burn-in of
5,000 iterations for the SCR model. MCMC chain mixing and stability and posterior
sample size were evaluated by examining trace plots, running mean plots, and potential
scale reduction factors (psrf) for each parameter. Trace plots of all parameters in each
model showed good mixing of all three chains, running mean plots demonstrated stable
results, and psrf was ≤1.01 for both point estimates and credible intervals.
Posterior-predictive goodness-of-fit checks were performed as described in Royle et al.
(2013), including for deviation of spatial activity centers from a uniform distribution,
deviation of expected from observed number of captures per individual per trap,
deviation of expected from observed number of captures per trap, and deviation of
expected from observed number of captures per individual. A posterior predictive check
was also performed for the non-spatial Mt model results to evaluate deviation of
expected from observed number of captures per individual.
Code for models and posterior predictive checks is provided in Appendix B.
Bias estimation
The magnitude of some important sources of bias had previously been estimated via
simulation, and corresponding corrections estimated, for a three-year photo-
identification data set of North-Pacific-wide humpback whales fitted with a closed
capture-recapture model (Barlow et al., 2011). These sources of bias include not
sampling animals in their first year (one source of non-random sampling) and violation
of the population closure assumption.
To estimate the magnitude of bias expected from sex heterogeneity in capture
probability, 5000 data sets were simulated based on abundance and occasion-specific
capture probabilities estimated from the SCR and Mt models, respectively, as described
above, an assumed sex ratio of 1:1, and a ratio of male to female capture probabilities
set, in turn, to the 16th, 50th, and 84th percentiles of the lognormal distribution for the
ratio estimate (see “Model development: Assessment of potential biases”). Male capture
probabilities were set to those estimated from the Mt model. An Mt model was fitted to
each dataset using MLE, and the mean ratio of estimated abundance to true abundance
calculated. The three resulting estimates of bias were used to parameterize a normal
distribution for estimation bias due to sex heterogeneity, with the mean equal to the bias
estimated at the 50th percentile of the estimated distribution for sex heterogeneity, and
10standard error calculated as the mean absolute difference between estimated bias at
the 50th percentile and those at the 16th and 84th percentiles.
The biases considered here are approximately additive (Barlow et al., 2011). A
distribution of correction factors was parameterized as
,
where bopen+calf and σb,open+calf (mean and standard error of combined bias due to births
and deaths and excluding calves) were drawn from Barlow et al. (2011); and bh and σb,h
(mean and standard error of estimated bias due to sex heterogeneity in capture
probability) were estimated through simulation as described above. To obtain bias-
corrected estimates, random samples were drawn from this distribution for multiplication
by the values in the posterior distributions for abundance from the SCR and Mt models.
Data manipulation and filtering, visualization, simulations, and post-processing were
conducted in R 3.6.2 (R Core Team, 2019), using the DBI, tidyverse, lubridate, coda,
and mcmcplots packages (Plummer et al., 2006; Grolemund and Wickham, 2011;
Curtis, 2015; R Special Interest Group on Databases (R-SIG-DB) et al., 2019; Wickham
et al. 2019). Model fitting was implemented with NIMBLE for Bayesian estimation, using
the nimble and nimbleEcology packages (de Valpine et al., 2017; Goldstein et al., 2021;
de Valpine et al., 2021), and with Rcapture for MLE (Rivest and Baillargeon, 2019).
Results and Discussion
A total of 430 distinct individuals were included in the 2019 to 2021 dataset off Central
America and southern Mexico, of which 38 were captured during two distinct occasions
and one in three occasions, and 59 were captured in more than one trap (i.e., spatial
recaptures), in some cases within an occasion.
Two of the key abundance estimation biases anticipated in this analysis, along with
associated uncertainty, were quantified by Barlow et al. (2011), with means of -10.5%
for excluding animals in their first year and +5.2% for violating the population closure
assumption. Barlow et al. (2011) based their simulations on sampling occasions
separated by a maximum of 1.5 years, whereas the duration of our dataset is two years,
which would lead to a greater positive bias due to births and deaths. If current vital rates
in this DIP are markedly different from those simulated by Barlow et al. (2011) (0.96
annual adult survival rate, 11% birth rate, and 0.85 semi-annual survival rate for new
calves), that could also affect the resulting bias, with lower adult survival increasing it
and lower birth rates and calf survivals decreasing it. Similarly, the -10.5% estimated
mean bias from excluding first-year animals would be an overprediction of the negative
bias if the current population had lower birth rates than simulated in Barlow et al. (2011).
Calambokidis and Barlow (2020) found a population growth rate for U.S. West Coast
11humpbacks that is commensurate with that of the SPLASH years (Calambokidis et al.,
2009), but we see evidence of lower growth rates for the CentAm/SMex-CA/OR/WA DIP
(see below). Since the negative bias due to exclusion of first years is greater in
magnitude than the opposing positive bias due to births and deaths, it would change
faster with a change in birth rate. If the current population is growing more slowly due to
a decrease in birth rate, the two combined biases would likely be less than the mean of
-5.3% estimated in Barlow et al. (2011), making the current bias-corrected estimate a
slight overestimate. Our simulations of unaccounted-for sex heterogeneity in capture
probability, within the parameter space estimated from SCR and Mt models (1,100 total
individuals; annual capture probabilities of 0.06, 0.06, and 0.23 in 2019, 2020, and
2021, respectively), resulted in a mean estimation bias of -19.0% (CV=0.521). Summing
these biases and their associated uncertainties, and inverting the difference from unity,
produces a mean overall correction factor of 1.35 (CV=0.143).
The base SCR model (northern model domain boundary at 19.2°N) resulted in a mean,
bias-corrected, realized abundance estimate of 1,496 (CV=0.171) for the
CentAm/SMex-CA/OR/WA DIP, with a 20th percentile of 1,284 (Fig. 5; Table 3). This
estimate is somewhat lower than – though still above the 18th percentile of – that from
the non-spatial Mt model, which resulted in a mean bias-corrected estimate of expected
abundance of 1,804 (CV=0.191) (Table 3). Expected rather than realized abundance
was calculated from the Mt model to take advantage of MCMC efficiencies in NIMBLE,
but the two quantities were practically equivalent. The SCR estimate is only moderately
sensitive to the location of the northern model domain boundary. To understand
alternate model results, it is important to bear in mind that the dataset is the same
throughout, limited to collections from Guerrero southward. Shifting the northern model
domain boundary, and thus the limit of the potential activity center locations of animals
in the dataset, southward to 18.6°N, at northern border of Michoacán state, increased
the bias-corrected mean estimate slightly to 1,601 (CV=0.166), because it forced the
spatial activity centers of observed animals to be concentrated in a smaller area, driving
down the estimates of capture probability for the same number of captures. Shifting the
northern model domain boundary northward to 20.4°N, at the transition to Bahía de
Banderas, correspondingly drove up estimates of capture probability and lowered the
bias-corrected mean abundance estimate to 1,313 (CV=0.167) (Table 3).
The mean estimate of space use σ in the SCR model is 3.0 degrees latitude (CV=0.131;
Fig. 5). This estimate is similar to the mean individual difference in capture latitude
among occasions found in the diagnostic randomization test using all years of data (Fig.
3). Note that this estimate cannot be translated to a distance in terms of kilometers,
because it does not account for the corresponding change in longitude. Based on this
estimate, traps are spaced at sufficient resolution (i.e., ≤ σ; Fig. 2) to expose all
individuals in the population to sampling and minimize bias and imprecision due to trap
spacing alone (Sollman et al., 2012; Royle et al., 2013).
12The posterior predictive checks for deviation of expected from observed number of
captures per individual did not detect unexplained individual heterogeneity in either the
Mt or SCR model (0.45 and 0.77 probabilities, respectively, of deviation from expected
being less in the observed data than in the posterior predicted datasets). However,
goodness-of-fit tests have extremely limited power to detect unexplained individual
heterogeneity in relatively sparse captures histories (e.g., White and Cooch, 2017). Of
the remaining posterior predictive checks – for deviation from a uniform distribution of
spatial activity centers, deviation of expected from observed number of captures per
trap, and deviation of expected from observed number of captures per individual per
trap – none of the resulting statistics suggested a lack of fit (probabilities of deviation
from expected being less in the observed data than in the posterior predicted datasets
of 0.43, 0.38, and 0.84).
Given the goodness-of-fit results, the support for the importance of space in explaining
capture probabilities of humpback whales in the CentAm/SMex-CA/OR/WA DIP in its
wintering area, and the lower abundance estimate resulting from the SCR model, the
estimate from the SCR model is the conservative choice. Sampling the full extent of the
wintering area over multiple years, better characterizing the northern population limit for
the wintering area, and obtaining effort data to be included as a covariate are crucial to
obtaining a more robust abundance estimate for the CentAm/SMex-CA/OR/WA DIP.
Limited evidence is available to assess whether the CentAm/SMex-CA/OR/WA DIP,
which corresponds to the endangered Central America DPS, has been growing at the
same rate as observed for total humpback whales off the U.S. West Coast, estimated
by Calambokidis and Barlow (2020) at 8.2% per year. The abundance estimate
provided here for the CentAm/SMex-CA/OR/WA DIP is not comparable to a previous
estimate for the Central American DPS for the years 2004-2006 (755, CV= 0.242)
(Wade, 2021), because the DIP now includes animals off southern Mexico. The current
abundance estimate is nearly double that obtained 15 years earlier, and would
correspond to an increase of 4.8% per year (analytical SD = 2.0%) if it were purely due
to population growth. Given the inclusion of southern Mexico whales in the current
estimate, the true growth rate of this population is likely lower, and substantially lower
than that observed for total humpback whales off the U.S. West Coast over the same
time period. Alternatively, a population growth rate can be derived by resummarizing the
results of the SCR model to include only whales with activity centers south of 14.5°N in
the abundance estimate. Comparing this resummarized and bias-corrected result to the
Wade estimate, for which the main sources of bias may nearly cancel each other out
(Wade 2021), gives an increase of 1.6% per year (SD = 2.0%).
If the population growth rate for the CentAm/SMex-CA/OR/WA DIP is lower than that for
U.S. West Coast humpbacks as a whole, we would expect a decrease over time in the
proportion of Central America whales relative to Mexico whales in this feeding area. The
current estimate for the CentAm/SMex-CA/OR/WA DIP (1,496, CV=0.171) represents
30% of the most recent mark-recapture-based estimate for the U.S. West Coast (4,973,
13CV=0.048), which was based on data from 2015-2018 (Calambokidis and Barlow, 2020;
86 FR 58887, October 25, 2021). Previous estimates of this proportion, based on data
from 2004-6, are indeed somewhat higher, at 42% in Wade (2021) and 55% (95% CI:
27-67%) in Lizewski et al. (2021), though still within the confidence interval of the latter.
Although Martien et al. (2020) found no evidence of a change in genetic composition for
the U.S. West Coast between 1988-89, 2004, and 2018, their statistical power was
extremely low for detecting a change in proportions of this magnitude (K. Martien, pers.
comm., February 2, 2022).
An estimate for the abundance of whales from the MMex-CA/OR/WA DIP in U.S. waters
can be deduced from the remaining proportion of the U.S. West Coast estimate: 4,973 –
1,496 = 3,477, with an analytical CV of 0.101. The 20th percentile of the corresponding
lognormal distribution equals 3,179. The U.S. West Coast estimate was based on data
from California and Oregon, but likely includes Washington animals due to interchange
with that area (Calambokidis and Barlow, 2020).
The West Coast estimate is not bias-corrected for births and deaths or exclusion of
calves from the dataset. The magnitude of the bias due to exclusion of calves would be
expected to be similar to that of -10.5% estimated by Barlow et al (2011). But since the
three-year (four annual occasions) timespan of the West Coast estimate is double that
considered in Barlow et al. (2011), the positive bias due to births and deaths would be
substantially greater than +5.2%, largely cancelling out the former.
Conclusions
We present the first population estimate for the CentAm/SMex-CA/OR/WA DIP, with a
best estimate of 1,496 (CV=0.171) and a 20th percentile of 1,284. We also found
evidence that the growth rate for this population is considerably lower than that found
for total humpback whales along the U.S. West Coast. Our analysis provides strong
support for spatial fidelity of the CentAm/SMex-CA/OR/WA DIP in their wintering area,
with important implications for sampling needs to obtain accurate population estimates.
We also provide an estimate of the magnitude of sex heterogeneity in capture
probabilities in the wintering area for this population, with annual male capture
probability a factor of 3.4 (CV=0.46) times higher than that for females. Finally, a recent
estimate for humpback whales off the U.S. West Coast allows us to subtract the
estimate for the CentAm/SMex-CA/OR/WA DIP for a first estimate of the number of
humpback whales from the MMex-CA/OR/WA DIP in U.S. waters, at 3,477 (CV=0.101).
Acknowledgments
Elana Dobson, Jessie Huggins, and Ian Flynn-Thomas processed 2021 photos and
data for SPLASH-2. Numerous interns and Cascadia Research Collective staff
contributed to data and photo processing over the course of the time series. Chelina
14Batista and Jose Aristides Ponce assisted in the field in Panama. Additional
opportunistic field effort in Panama was made possible by Jose Julio Casas and Didiel
Núñez of the Ministerio de Ambiente de Panamá. Rafael Sánchez and Cindy Thiele
permitted use of the Bahia Aventuras tourism boats as platforms of opportunity in Osa,
Costa Rica. Marlenne Vázquez-Cuevas, Diana Martínez, Mirna Valencia, Marvin Morán
and Jorge Herrera assisted with field work in El Salvador. A number of field assistants
and fishermen helped with fieldwork in Guatemala. Elena Dobson, Astrid Frisch Jordan,
Christian Ortega-Ortiz, Rachel Cartwright, and Mari Smultea provided advice and
support to Whales of Guerrero. Victoria Pouey-Santalou, Claudia Auladell-Quintana,
Anthony Kaulfuss, Cristina Martin, Dane McDermott, Pablo Chevallard Navarro, Abel
Organis, Avimael Cadena, and Florine Martineau assisted in field work and data
management and processing for Guerrero. The community of Barra de Potosí, regional
captains, and spotting network members supported the work in Guerrero with gifts of
time, space, resources, attention and kindness. Karen Martien and Morgane Lauf
provided genetic sex identifications from the SWFSC Tissue Archive Database. Andy
Royle, Penny Ruvelas, and Barb Taylor provided helpful comments on a draft of the
report. Karin Forney provided an internal peer review.
Funding
Funding for data analysis was provided by Protected Species Science Branch,
Assessment and Monitoring Division, Office of Science and Technology, NOAA
Fisheries, through the Protected Species Toolbox Initiative. Funding for 2021 field
collections and SPLASH 2 coordination was partially provided by NOAA Fisheries West
Coast Region and NOAA Fisheries Office of Protected Resources. Field work in El
Salvador was additionally supported financially by the Rufford Foundation and the
Society of Marine Mammalogy, and research equipment was gifted by Idea Wild.
Whales of Guerrero also received funding or gifts in kind from the San Francisco Bay
American Cetacean Society Chapter, Oceanic Society, SEE Turtles, Cetacean Society
International, Smultea Environmental Sciences, Mysticetus, Adobe, National
Geographic Society, Norcross Foundation, Idea Wild, SEMARNAT, US Department of
Fish and Wildlife Service, Rodrigo y Gabriela, and individual project supporters. The
funders had no role in the design or execution of the study, decision to publish, or
preparation of the report.
Supplementary Information
Appendix A. R code for permutation test for individual spatial fidelity
Appendix B. NIMBLE and R code for models and posterior predictive checks
15References
Baker, C. S., Steel, D., Calambokidis, J., Falcone, E. A., González-Peral, U., Barlow, J.,
Burdin, A. M., Clapham, P. J., Ford, J. K. B., Gabriele, C. M., Mattila, D., Rojas-Bracho,
L., Straley, J. M., Taylor, B. L., Urbán-R., J., Wade, P., Weller, D., Witteveen, B. H., and
Yamaguchi, M. 2013. Strong maternal fidelity and natal philopatry shape genetic
structure in North Pacific humpback whales. Marine Ecology Progress Series, 494: 291-
306.
Barlow, J., Calambokidis, J., Falcone, E. A., Baker, C. S., Burdin, A. M., Clapham, P. J.,
Ford, J. K. B., and Gabriele, C. M. 2011. Humpback whale abundance in the North
Pacific estimated by photographic capture-recapture with bias correction from
simulation studies. Marine Mammal Science, 27: 793-818.
https://doi.org/10.1111/j.1748-7692.2010.00444.x.
Becker, E. A., Forney, K. A., Miller, D. L., Fiedler, P. C., Barlow, J., and Moore, J. E.
2020. Habitat-based density estimates for cetaceans in the California Current
Ecosystem based on 1991–2018 survey data. U.S. Department of Commerce, NOAA
Technical Memorandum NMFS-SWFSC-638.
Brown, M. R., Corkeron, P. J., Hale, P. T., Schultz, K. W., and Bryden, M. M. 1995.
Evidence for a sex-segregated migration in the humpback whale (Megaptera
novaeangliae). Proceedings of the Royal Society B: Biological Sciences, 259: 229-234.
https://doi.org/10.1098/rspb.1995.0034.
Calambokidis, J., and Barlow, J. 2020. Updated abundance estimates for blue and
humpback whales along the U.S. West Coast using data through 2018. U.S.
Department of Commerce, NOAA Technical Memorandum NMFS-SWFSC-634.
Calambokidis, J., Steiger, G. H., Straley, J. M., Quinn II, T. J., Herman, L. M., Cerchio,
S., Salden, D. R., Yamaguchi, M., Sato, F., Urbán R., J., Jacobsen, J., von Ziegesar,
O., Balcomb, K. C., Gabriele, C. M., Dahlheim, M. E., Higashi, M., Uchida, S., Ford, J.
K. B., Miyamura, Y., Ladrón de Guevara P., P., Mizroch, S. A., Schlender, L., and
Rasmussen, K. 1997. Abundance and population structure of humpback whales in the
North Pacific Basin. Report to Southwest Fisheries Science Center, National Marine
Fisheries Service, La Jolla, California. 71pp.
Calambokidis, J., Steiger, G. H., Rasmussen, K., Urbán R., J., Balcomb, K. C., Ladrón
de Guevara, P., Salinas Z., M., Jacobsen, J. K., Baker, C. S., Herman, L. M., Cerchio,
S., and Darling, J. D. 2000. Migratory destinations of humpback whales from the
California, Oregon and Washington feeding ground. Marine Ecology Progress Series,
192: 295-304.
Calambokidis, J., Steiger, G. H., Straley, J. M., Herman, L. M., Cerchio, S., Salden, D.
R., Urbán R., J., Jacobsen, J. K., von Ziegesar, O., Balcomb, K. C., Gabriele, C. M.,
Dahlheim, M. E., Uchida, S., Ellis, G., Miyamura, Y., Ladrón de Guevara P., P.,
Yamaguchi, M., Sato, F., Mizroch, S. A., Schlender, L., Rasmussen, K., Barlow, J., and
16Quinn II, T. J. 2001. Movements and population structure of humpback whales in the
North Pacific. Marine Mammal Science, 17: 769-794.
Calambokidis, J., Falcone, E.A., Quinn, T.J., Burdin, A.M., Clapham, P.J., Ford, J.K.B.,
Gabriele, C.M., LeDuc, R., Mattila, D., Rojas-Bracho, L., Straley, J.M., Taylor, B.L.,
Urbán R., J., Weller, D., Witteveen, B.H., Yamaguchi, M., Bendlin, A., Camacho, D.,
Flynn, K., Havron, A., Huggins, J., and Maloney, N. 2008. SPLASH: Structure of
Populations, Levels of Abundance and Status of Humpback Whales in the North Pacific.
Final report for Contract AB133F-03-RP-00078, available from Cascadia Research,
Olympia, WA.
Calambokidis, J., Falcone, E., Douglas, A., Schlender, L., and Huggins, J. 2009.
Photographic identification of humpback and blue whales off the U.S. West Coast:
Results and updated abundance estimates from 2008 field season. Final Report for
Contract AB133F08SE2786 from Southwest Fisheries Science Center. 18pp.
Cheeseman, T., Southerland, K., Park, J., Olio, M., Flynn, K., Calambokidis, J., Jones,
L., Garrigue, C., Frisch Jordán, A., Howard, A., Reade, W., Neilson, J., Gabriele, C.,
and Clapham, P. 2021. Advanced image recognition: a fully automated, high-accuracy
photo-identification matching system for humpback whales. Mammalian Biology,
https://doi.org/10.1007/s42991-021-00180-9
Curtis, S. M. 2015. mcmcplots: Create plots from MCMC output. R package version
0.4.2. https://CRAN.R-project.org/package=mcmcplots.
Darling, J. D., Calambokidis, J., Balcomb, K. C., Bloedel, P., Flynn, K. R., Mochizuki, A.,
Mori, K., Sato, F., Suganuma, H., and Yamaguchi, M. 1996. Movement of a humpback
whale (Megaptera novaeangliae) from Japan to British Columbia and return. Marine
Mammal Science, 12: 281-287.
de Valpine, P., Turek, D., Paciorek, C. J., Anderson-Bergman, C., Temple Lang, D., and
Bodik, R. 2017. Programming with models: writing statistical algorithms for general
model structures with NIMBLE. Journal of Computational and Graphical Statistics, 26:
403-413. https://doi.org/ 10.1080/10618600.2016.1172487.
de Valpine, P., Paciorek, C., Turek, D., Michaud, N., Anderson-Bergman, C.,
Obermeyer, F., Wehrhahn Cortes, C., Rodrìguez, A., Temple Lang, D., and Paganin, S.
2021. NIMBLE: MCMC, Particle Filtering, and Programmable Hierarchical Modeling.
http://doiorg/10.5281/zenodo.1211190. R package version 0.11.1, https://cran.r-
project.org/package=nimble.
Dobson, E., Calambokidis, J., Audley, K., Pouey-Santalou, V., de Weerdt, J., García
Chávez, A., and Kaulfuss, A. 2015. Migratory destinations of North Pacific humpback
whales from Guerrero state in Southwest Mexico reveal extension of Central American
breeding grounds. Society for Marine Mammalogy Biennial Conference, San Francisco,
California, USA. DOI: 10.13140/RG.2.2.17100.10880
17Efford, M. G. 2004. Density estimation in live-trapping studies. Oikos, 106: 598–610.
Flynn, K., J. Calambokidis, H. Weideman, J. Crall, Z. Jablons, C. Stewart, C. Kingen, J.
Van Oast, and Holmberg, J. 2017. Testing of two new automated fluke identification
algorithms and comparison to non-automated methods for humpback whales. Abstract
(Proceedings) 22nd Biennial on the Biology of Marine Mammals, Halifax, Nova Scotia,
October 22-27, 2017.
García Chávez, A. J., Kaulfuss, A., de Weerdt, J., Pouey Santalou, V., Smultea, M., and
Audley, K. 2015. First systematic humpback whale studies in the state of Guerrero,
Southwest Mexico. Society for Marine Mammalogy Biennial Conference, San Francisco,
California.
Gilson A., Syvanen, M., Levine, K., and Banks, J. 1998. Deer gender determination by
polymerase chain reaction: validation study and application to tissues, bloodstains, and
hair forensic samples from California. California Fish and Game, 84: 159−169.
Goldstein, B., Turek, D., Ponisio, L., and de Valpine, P. 2021. nimbleEcology:
Distributions for Ecological Models in nimble. R package version 0.4.0. https://cran.r-
project.org/package=nimbleEcology.
Grolemund, G., and Wickham, H. 2011. Dates and Times Made Easy with lubridate.
Journal of Statistical Software, 40: 1-25. https://www.jstatsoft.org/v40/i03/.
Katona, S.K., and Whitehead, H.P. 1981 Identifying humpback whales using their
natural markings. Polar Record, 20: 439–444.
Kellogg, R. 1929. What is known of the migrations of some of the whalebone whales.
Smithsonian Institution. Annual Report, 1928: 467−494.
Lizewski, K., Steel, D., Lohman, K., Albertson, G. R., González Peral, Ú., Urbán R., J.,
Calambokidis, J., and Baker, C. S. 2021. Mixed-stock apportionment of humpback
whales from feeding grounds to breeding grounds in the North Pacific based on mtDNA.
Paper SC/68C/IA/01Rev01 submitted to the Scientific Committee of the International
Whaling Commission, April 2021. 12 pp. Available at https://archive.iwc.int/.
Martien, K. K., Hancock-Hanser, B. L., Lauf, M., Taylor, B. L., Archer, F. I., Urbán, J.,
Steel, D., Baker, C. S., and Calambokidis, J. 2020. Progress report on genetic
assignment of humpback whales from the California-Oregon feeding aggregation to the
mainland Mexico and Central America wintering grounds. U.S. Department of
Commerce, NOAA Technical Memorandum NMFS-SWFSC-635.
Martien, K. K., Taylor, B. L., Archer, F. I., Audley, K., Calambokidis, J., Cheeseman, T.
De Weerdt, J., Frisch Jordán, A., Martínez-Loustalot, P., Ortega-Ortiz, C. D., Patterson,
E. M., Ransome, N., Ruvelas, P., Urbán Ramírez, J., and Villegas-Zurita, F. 2021.
Evaluation of Mexico Distinct Population Segment of Humpback Whales as units under
the Marine Mammal Protection Act. U.S. Department of Commerce, NOAA Technical
Memorandum NMFS-SWFSC-658. https://doi.org/10.25923/nvw1-mz45
18You can also read