Machine learning approach to dynamic risk modeling of mortality in COVID 19: a UK Biobank study - Nature
←
→
Page content transcription
If your browser does not render page correctly, please read the page content below
www.nature.com/scientificreports
OPEN Machine learning approach
to dynamic risk modeling
of mortality in COVID‑19: a UK
Biobank study
Mohammad A. Dabbah1, Angus B. Reed1, Adam T. C. Booth1, Arrash Yassaee1,2,
Aleksa Despotovic1,3, Benjamin Klasmer1, Emily Binning1, Mert Aral1, David Plans1,4*,
Davide Morelli1,6, Alain B. Labrique5 & Diwakar Mohan5
The COVID-19 pandemic has created an urgent need for robust, scalable monitoring tools supporting
stratification of high-risk patients. This research aims to develop and validate prediction models, using
the UK Biobank, to estimate COVID-19 mortality risk in confirmed cases. From the 11,245 participants
testing positive for COVID-19, we develop a data-driven random forest classification model with
excellent performance (AUC: 0.91), using baseline characteristics, pre-existing conditions, symptoms,
and vital signs, such that the score could dynamically assess mortality risk with disease deterioration.
We also identify several significant novel predictors of COVID-19 mortality with equivalent or greater
predictive value than established high-risk comorbidities, such as detailed anthropometrics and prior
acute kidney failure, urinary tract infection, and pneumonias. The model design and feature selection
enables utility in outpatient settings. Possible applications include supporting individual-level risk
profiling and monitoring disease progression across patients with COVID-19 at-scale, especially in
hospital-at-home settings.
The COVID-19 pandemic has posed a significant challenge to global healthcare systems. Although large-scale
vaccination programmes have begun, many countries will not have widespread access to vaccines until 2023,
meaning that non-pharmaceutical interventions are likely to remain indispensable national strategies for some
time1.
COVID-19 shows highly varied clinical presentation, with a significant proportion (17–45%) of cases
being asymptomatic and requiring no specific care2,3. Conversely, the case fatality rate is reported between
2–3% worldwide4. Between these two extremes, typical symptoms include fever, continuous cough, anosmia,
and dyspnoea, which may range from requiring only self-management at home to inpatient care. Understand-
ing which individuals are most vulnerable to severe disease, and thereby in most need of resources, is critical to
limit the impact of the virus.
Decision-making at all levels requires an understanding of individuals’ risk of severe disease. Various patient
characteristics, comorbidities, and lifestyle factors have been linked to greater risk of death and/or severe ill-
ness following i nfection5–7. Once patients are infected with SARS-CoV-2, additional physiological parameters,
such as symptoms and vital signs, can inform real-time p rognostication8. Laboratory testing and imaging can
also inform risk stratification for early, aggressive intervention, though this data is only accessible to hospital
inpatients, who are likely to be already severely a ffected9,10.
Robust, predictive models for acquisition and prognosis of COVID-1911–16 and resource management17,18 have
been developed to support risk stratification and population management at-scale, offering important insights
for organizational decision-making. For example, QCOVID is a leading COVID-19 risk model developed using
primary care data from 8 million a dults11, with evidence of external validation19. It is currently implemented in
the NHS as a clinical assessment tool20. However, the individual is currently overlooked, and granular, patient-
specific risk-scoring could unify decision-making across all levels. Existing individualized risk scores, however,
1
Huma Therapeutics Limited, London, UK. 2Centre for Paediatrics and Child Health, Faculty of Medicine, Imperial
College London, London, UK. 3Faculty of Medicine, University of Belgrade, Belgrade, Serbia. 4University of
Exeter, SITE, Exeter, UK. 5Johns Hopkins Bloomberg School Public Health, Baltimore, MD, USA. 6Department of
Engineering Science, Institute of Biomedical Engineering, University of Oxford, Oxford, UK. *email: david.plans@
huma.com
Scientific Reports | (2021) 11:16936 | https://doi.org/10.1038/s41598-021-95136-x 1
Vol.:(0123456789)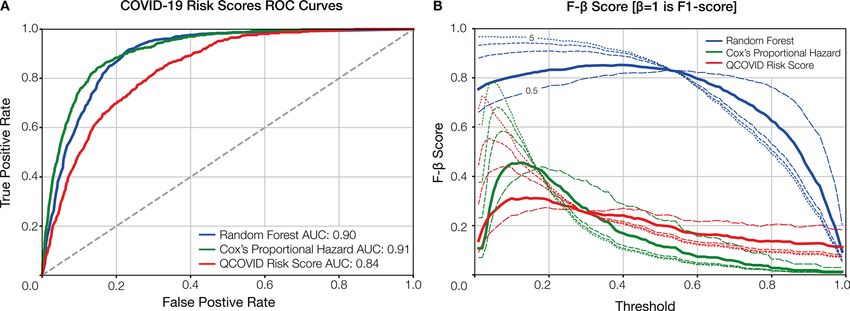
www.nature.com/scientificreports/
often conflate risk of COVID-19 acquisition with risk of mortality following infection11,14, which can limit their
utility in patient management.
For predictive models to achieve impact at scale, assessment of risk factors should be inexpensive and acces-
sible to the general population, ideally without the need for specialized testing or hospital visits. Such risk predic-
tion tools, through improved patient triage, could be used to further increase the efficiency of, and confidence in,
hospital-at-home solutions, which have shown promise in reducing hospital burden throughout the p andemic21.
Risk scores in these circumstances need to be dynamic and contemporaneous, ideally incorporating symptoms
and vital sign data to maximise utility to clinical and research teams. Therefore, the primary aim of this study
is to develop and validate a population-based prediction model, using a large, rich dataset and a selective, clini-
cally informed approach, which dynamically estimates the COVID-19 mortality risk in confirmed diagnoses.
Results
Clinical characteristics of patients in the derivation cohort. There were 55,118 adults in the UK
Biobank (UKB) tested for COVID-19. After excluding negative test results and patients without hospital records
data, 11,245 adults (aged 51–85 years, mean: 66.9, SD: 8.7) were included in the analysis, of whom 640 (5.7%)
had died as a result of COVID-19 (Supplementary Fig. 1). The mean age of survivors was 66.4 years (SD: 8.6),
compared to 76.0 years (SD: 5.6) for those that died. The most common pre-existing conditions in patients were
hypertension (36.2%), osteoarthritis (23.3%), and asthma (13.3%) (Table 1).
Leave‑one‑out validation. To maximise the potential of the dataset, a leave-one-out (LOO) cross-valida-
tion approach was implemented (Fig. 1C). In this process, each data point is used as a test set while the remain-
ing data points are used to train a Random Forest (RF) classifier using the entire feature space. This approach
is the most extreme version of k-fold cross-validation and results in lower model bias and variance than the
typical train/test split method. Feature importance is calculated by aggregating individual importance across
all trained classifiers in the LOO experiment. The feature selection process (Fig. 1B) ensured the combination
of data-driven insights with clinical experience, shortlisting approximately 12,000 features to 64 characteristics.
The shortlisted features included: 3 vital signs; 12 symptoms; 32 pre-existing clinical conditions; 5 medications
and treatments; and 13 patient characteristics (Table 1).
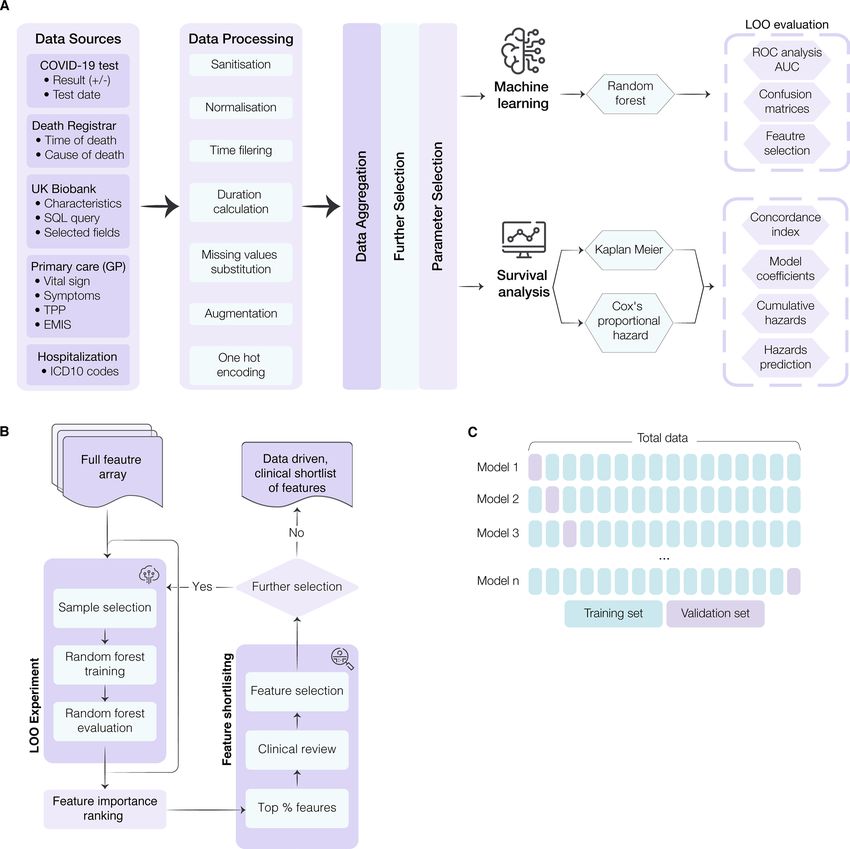
Model performance and comparison. The receiver operating characteristic (ROC) curves for the pre-
diction models are presented in Fig. 2A. With an area under the curve (AUC) of 0.90, the Random Forest (RF)
model showed excellent performance. A Cox Proportional Hazard (CPH) model was trained using the final set
of RF-defined variables to maximize explainability of the RF, CPH model coefficients are detailed in Supplemen-
tary Table 1. This model had improved performance, reaching a higher AUC of 0.91.
Figure 2A also shows the ROC curves for both the RF and C PH22 models against the sex-aggregated QCOVID
11
model . As shown, the ROC curves for the RF and CPH are very comparable with a slight advantage for the CPH.
From Fig. 2A, it can be seen that when QCOVID is applied to the UKB dataset it performs well and achieves
an AUC of 0.84, showcasing resilience to unseen data. To explore the performance further, it is essential to look
at the robustness of the generated models. Figure 2B illustrates the use of F-β statistical analysis to examine
the performance of the various models. As expected, despite the CPH having a slightly greater AUC score, it is
clear that the RF has much more stable performance. Moreover, it can be seen that both the CPH and QCOVID
models achieve optimal F-β scores when β is small. However, for the RF model, the F-β scores are considerably
larger than its comparators and are more consistent across the range of thresholds, thereby demonstrating greater
stability and increased capabilities regarding recall (i.e. minimizing false-negatives).
The results of this model highlighted both known and novel risk factors for mortality in COVID-19 (Fig. 3).
Age was the most important feature of the model. To test for overfitting due to this feature, and limitations in
the dataset, the model was re-processed excluding age, which had minimal effect on model performance (CPH
AUC: 0.90, Supplementary Fig. 2).
Novel features. Novel features highlighted by the CPH included demographic and lifestyle features, such as
waist circumference and sleep duration (Fig. 3). Key features in recent medical history are also elucidated, with
prior acute kidney failure, respiratory failure, bacterial pneumonia, and non-bacterial pneumonia (diagnosed
between one week and one month prior to COVID-19 infection) comprising the most prominent predictors of
mortality. Acute kidney failure and bacterial pneumonia remain in the top features, even with a more distant
diagnosis window of between one month and 12 months prior to COVID-19 infection (Fig. 3).
Discussion
This study developed and validated machine learning models to predict mortality in patients with COVID-19
using comprehensive data from 11,245 COVID-19 patients in the UKB. The results show that by using easily
accessible patient characteristics, brief medical history, symptoms, and vital signs we can predict mortality in
patients with COVID-19 with excellent performance (AUC: 0.91). The features selected in the presented model
mirror much of the current clinical understanding regarding risk factors associated with COVID-19 mortality,
highlighting age23 and obesity24 as significant contributors.
In addition, we identified many novel features that may be strong predictors of mortality in patients with
COVID-19. The most interesting findings concern the impact of prior inpatient diagnosis of urinary tract infec-
tion (UTI), respiratory failure, acute kidney failure, bacterial and non-bacterial pneumonias, and other bacte-
rial infections. With the exception of UTI, dividing each feature into time groupings by their proximity to the
COVID-19 diagnosis highlights diminishing risk the more distant the event. For respiratory conditions and other
Scientific Reports | (2021) 11:16936 | https://doi.org/10.1038/s41598-021-95136-x 2
Vol:.(1234567890)www.nature.com/scientificreports/
n (%) [count]
Characteristic All Participants Survived Died
Total 11,245 10,605 (94.3) 640 (5.7)
Demographic
Male sex 5,274 4,850 (92) 424 (8)
Age (yrs), mean (SD) 66.9 (8.7) 66.4 (8.6) 76.0 (5.6)
Lifestyle and anthropometrics
Body mass index, mean (SD) 28.4 (5.1) [11,153] 28.3 (5.1) [10,528] 30.0 (5.7) [625]
Waist circumference (cm), mean (SD) 92.5 (14.0) [11,185] 92.1 (13.9) [10,556] 100.1 (14.7) [629]
Hip circumference (cm), mean (SD) 104.8 (9.9) [11,181] 104.6 (9.8) [10,552] 106.7 (11.3) [629]
Body weight (kg), mean (SD) 80.9 (16.9) [11,172] 80.6 (16.7) [10,544] 85.9 (18.6) [628]
Obesity (BMI > 30) 1,307 1,167 (89.3) 140 (10.7)
Standing height (cm), mean (SD) 168.5 (9.2) [11,245] 168.5 (9.2) [10,605] 168.9 (9.3) [640]
Blood type
Unknown 353 318 (90.1) 35 (9.9)
AA 892 834 (93.5) 58 (6.5)
AB 435 417 (95.9) 18 (4.1)
AO 4,074 3,858 (94.7) 216 (5.3)
BB 67 62 (92.5) 5 (7.5)
BO 1,051 999 (95.1) 52 (4.9)
OO 4,373 4,117 (94.1) 256 (5.9)
Sleep duration (hrs), mean (SD) 7.0 (1.4) [11,245] 7.0 (1.4) [10,605] 7.2 (1.7) [640]
Alcohol intake
Unknown 33 30 (90.9) 3 (9.1)
Daily or almost daily 1,662 1,562 (94) 100 (6)
Three or four times a week 2,168 2,068 (95.4) 100 (4.6)
Once or twice a week 3,010 2,862 (95.1) 148 (4.9)
One to three times a month 1,284 1,228 (95.6) 56 (4.4)
Special occasions only 1,398 1,300 (93) 98 (7)
Never 1,690 1,555 (92) 135 (8)
Smoking status
Unknown 68 60 (88.2) 8 (11.8)
Never 6,195 5,915 (95.5) 280 (4.5)
Previous 3,933 3,642 (92.6) 291 (7.4)
Current 1,049 988 (94.2) 61 (5.8)
Gait and mobility issues 68 60 (88.2) 8 (11.8)
Medication and treatment
Allergy to antibiotics 1,143 1,044 (91.3) 99 (8.7)
Long-term use of anticoagulants 981 821 (83.7) 160 (16.3)
Radiation therapy 274 237 (86.5) 37 (13.5)
Maintenance chemotherapy 476 420 (88.2) 56 (11.8)
Chemotherapy 256 210 (82) 46 (18)
Pre-existing medical conditions
General diseases of the circulatory
1,216 1,030 (84.7) 186 (15.3)
system
Chronic ischemic heart disease 1,388 1,200 (86.5) 188 (13.5)
Atrial fibrillation 1,007 834 (82.8) 173 (17.2)
Hypertension 4,074 3,624 (89) 450 (11)
Stroke 767 624 (81.4) 143 (18.6)
General diseases of the respiratory
169 143 (84.6) 26 (15.4)
system
Asthma 1,497 1,391 (92.9) 106 (7.1)
Chronic obstructive pulmonary disease 670 537 (80.1) 133 (19.9)
Interstitial lung disease 107 71 (66.4) 36 (33.6)
Respiratory failure
less than 1 month 291 171 (58.8) 120 (41.2)
between 1 and 12 months 180 117 (65) 63 (35)
more than 12 months 154 109 (70.8) 45 (29.2)
Continued
Scientific Reports | (2021) 11:16936 | https://doi.org/10.1038/s41598-021-95136-x 3
Vol.:(0123456789)www.nature.com/scientificreports/
n (%) [count]
Characteristic All Participants Survived Died
Non-bacterial pneumonia
less than 1 month 812 542 (66.7) 270 (33.3)
between 1 and 12 months 512 368 (71.9) 144 (28.1)
more than 12 months 624 508 (81.4) 116 (18.6)
Bacterial pneumonia
less than 1 month 734 485 (66.1) 249 (33.9)
between 1 and 12 months 349 240 (68.8) 109 (31.2)
more than 12 months 45 38 (84.4) 7 (15.6)
General diseases of the nervous system 640 554 (86.6) 86 (13.4)
Parkinson’s disease 164 124 (75.6) 40 (24.4)
MND, MS, or HD 21 18 (85.7) 3 (14.3)
Dementia 491 373 (76) 118 (24)
Haematological Cancer
less than 12 months 85 52 (61.2) 33 (38.8)
between 12 and 60 months 95 71 (74.7) 24 (25.3)
more than 60 months 111 86 (77.5) 25 (22.5)
Non-haematological Cancer
less than 12 months 208 180 (86.5) 28 (13.5)
between 12 and 60 months 590 545 (92.4) 45 (7.6)
more than 60 months 908 834 (91.9) 74 (8.1)
Diabetes (Type 1) 143 110 (76.9) 33 (23.1)
Diabetes (Type 2) 1,416 1,204 (85) 212 (15)
Osteoarthritis 2,625 2,394 (91.2) 231 (8.8)
Depression and anxiety disorder 1,404 1,271 (90.5) 133 (9.5)
Rheumatoid arthritis 317 268 (84.5) 49 (15.5)
Anemia 1,260 1,067 (84.7) 193 (15.3)
Urinary tract infection
less than 1 month 96 72 (75) 24 (25)
between 1 and 12 months 171 136 (79.5) 35 (20.5)
more than 12 months 875 730 (83.4) 145 (16.6)
Acute kidney failure
less than 1 month 262 164 (62.6) 98 (37.4)
between 1 and 12 months 288 199 (69.1) 89 (30.9)
more than 12 months 443 331 (74.7) 112 (25.3)
Any bacterial infection
less than 1 month 169 110 (65.1) 59 (34.9)
between 1 and 12 months 209 145 (69.4) 64 (30.6)
more than 12 months 484 395 (81.6) 89 (18.4)
Diverticulum 1,657 1,507 (90.9) 150 (9.1)
Haemorrhoids 1,120 1,065 (95.1) 55 (4.9)
Irritable bowel syndrome 399 368 (92.2) 31 (7.8)
Gastroenteritis
less than 1 month 161 135 (83.9) 26 (16.1)
between 1 and 12 months 157 133 (84.7) 24 (15.3)
more than 12 months 1,700 1,546 (90.9) 154 (9.1)
Symptoms
Joint pain 1,156 1,035 (89.5) 121 (10.5)
Delirium 250 175 (70) 75 (30)
Hematemesis 563 512 (90.9) 51 (9.1)
Syncope and collapse 19 17 (89.5) 2 (10.5)
Dyspnea 282 246 (87.2) 36 (12.8)
Cough 70 60 (85.7) 10 (14.3)
Myalgia 248 221 (89.1) 27 (10.9)
Nausea and vomiting 38 29 (76.3) 9 (23.7)
Chest pain 831 757 (91.1) 74 (8.9)
Continued
Scientific Reports | (2021) 11:16936 | https://doi.org/10.1038/s41598-021-95136-x 4
Vol:.(1234567890)www.nature.com/scientificreports/
n (%) [count]
Characteristic All Participants Survived Died
Hematuria 42 35 (83.3) 7 (16.7)
Malaise and fatigue 49 41 (83.7) 8 (16.3)
Hypotension 342 266 (77.8) 76 (22.2)
Vital signs
Diastolic blood pressure, mean (SD) 77.9 (12.2) [123] 77.2 (10.9) [104] 81.9 (17.4) [19]
Systolic blood pressure, mean (SD) 129.3 (19.2) [124] 128.2 (17.6) [104] 135.1 (25.7) [20]
Heart rate, mean (SD) 84.7 (17.5) [80] 84.0 (16.9) [71] 90.9 (22.0) [9]
Body temperature, mean (SD) * 37.5 (1.2) [41] 37.7 (1.1) [37] 36.1 (0.9) [4]
Oxygen saturation, mean (SD) * 94.7 (3.3) [20] 94.4 (3.6) [16] 95.8 (1.5) [4]
Respiratory rate, mean (SD) * 24.1 (7.4) [18] 24.8 (8.5) [11] 22.9 (5.8) [7]
Table 1. Descriptive characteristics of the UK Biobank cohort with positive COVID-19 test results. Pre-
existing medical conditions included only when reported more than one week prior to COVID-19 positive
test result. Symptoms and vitals included only from primary care (GP) records when reported within + /-
two weeks of COVID-19 positive test result. MND = motor neurone disease; MS = multiple sclerosis;
HD = Huntington’s disease. * Oxygen saturation, respiratory rate, and body temperature were included in the
initial analysis, however, they were removed from the model due to low data availability.
infections, the risk returns to approximately baseline when > 12 months prior to COVID-19 diagnosis. The outly-
ing significance of acute kidney failure at > 12 months before COVID-19 diagnosis suggests the impact of renal
damage may be more integral to COVID-19 prognosis than that of the respiratory system. This is supported by
findings related to UTIs, where they appear as a less severe, but persistent, risk factor regardless of the time since
diagnosis. Respiratory and renal complications are a hallmark of severe COVID-1925. It is, therefore, unsurprising
that previous pathology of these organs effectively forecasts prognosis. To date, however, the relationship between
non-severe urogenital pathology and COVID-19 has not been effectively assessed. A recent systematic review
on urological manifestations of COVID-19 found urinary symptoms were absent from all included s tudies26.
Where data has been collected, sample sizes have been too low to draw strong conclusions. Though the occur-
rence of de novo urinary symptoms has been documented without noticeable impact on prognosis27,28, it has
been previously suggested, and recently evidenced, that the presence of pre-existing urinary conditions may be
associated with a poorer disease prognosis proportional to their severity29,30. Our investigation provides the first
reliable evidence that a history of UTI is predictive of greater COVID-19 mortality risk, roughly equivalent to
the predictive value of type 2 diabetes or a prior stroke (Fig. 3). We hypothesise that the underlying nature of
this association reflects the effect of poorer, possibly sub-clinical, baseline health status. While this sub-clinical
deterioration previously had no noticeable impact, in the context of a highly infective, fatal pathogen such as
SARS-CoV-2, even a small deterioration can take on clinical significance.
The unique value of the UKB can be attributed to its well-established, longitudinal background dataset.
Encompassing non-traditional health data, including anthropometric measurements and lifestyle insights, allows
for the assessment of commonly overlooked, yet easily collectable, variables to supplement the already-known
clinical factors. The ability to capture a deeper phenotype of the individual prior to infection has proved integral
to the model’s performance, in line with other disease-specific prediction models developed on the UKB31–33.
Notably, we identified baseline waist circumference, height, weight, and hip circumference to be valuable inde-
pendent of BMI and obesity, accounting for four of the top-seven RF-ranked features (Supplementary Fig. 3).
Although the pathophysiological link between adiposity and severe COVID-19 outcomes is not fully understood,
our results indicate that comprehensive body composition may provide more granular risk profiling than BMI
alone34,35. Moreover, while baseline sleep duration has been demonstrated to be highly predictive of all-cause
mortality36, cardiovascular d iseases37, and type 2 d
iabetes38, our findings mark the first instance of its signifi-
cant predictive influence within COVID-19 prognosis. While we present novel features associated with severe
COVID-19 outcomes, it is important to consider that correlations identified in this observational dataset often
will not reflect direct causation. We encourage further investigation of these novel features, both those previ-
ously established outside of COVID-19 and those discovered de novo, in a prospective setting to establish the
underlying pathophysiology conferring their predictive association with COVID-19 mortality.
Our model’s critical component is the distinction of variables with respect to their time of onset. Classifying
variables in a time-dependent fashion enables discrimination between pre-existing conditions, symptoms, and
complications. This was especially important as several of our novel features are also established complications of
COVID-19. Studies have emphasised the need for distinguishing pre-existing conditions from complications of
COVID-19 infection and their respective impact on p rognosis39,40 but, to our knowledge, no predictive models for
this disease have stratified variables in such a way. Applied in the context of patient management, and enriched by
the explainability of variable time-filtering, our results could help clarify crucial aspects of patients’ past medical
history and their relation to predicted prognosis. Models which forecast infection risk as a component of their
mortality prediction have been criticised for generalizing human behaviour, which results in underestimation
of risk factors and leaves their calibration extremely vulnerable to changes in local population d ynamics41. One
Scientific Reports | (2021) 11:16936 | https://doi.org/10.1038/s41598-021-95136-x 5
Vol.:(0123456789)www.nature.com/scientificreports/
Figure 1. Workflow for model development and feature selection. (A) Conceptual diagram of the data
ingestion pipeline and analysis methods. To combine databases, several data pre-processing steps were carried
out, including: sanitisation (eliminating redacted records and nuanced entries); normalization (scaling values
to ensure fitting with a reasonable range for further processing); time filtering; duration calculation (computing
the time interval between testing positive and mortality); missing value substitution (replacing missing values
or records with the mean value of the UK Biobank database); augmentation (bringing all data for each subject
into a single unified record); and one-hot-encoding (codifying the presence of a pre-existing condition or
symptom into a binary sequence for each subject). This data ingestion process standardized the input features
and attributes for all subjects in this study regardless of their unique and variable conditions, symptoms,
vital signs, and records. (B) Illustration of the data-driven and clinically reviewed feature refinement process.
(C) Schematic representation of the leave-one-out cross-validation method for feature selection and model
validation. Each sample is systematically left out in each fold (purple). Prediction error estimates are based on
left out samples. AUC = area under the curve; GP = general practice; LOO = Leave-One-Out; ROC = receiver
operating characteristic.
Scientific Reports | (2021) 11:16936 | https://doi.org/10.1038/s41598-021-95136-x 6
Vol:.(1234567890)www.nature.com/scientificreports/
Figure 2. Model performance evaluation. (A) the receiver operating characteristic (ROC) curve comparison
shown for our Random Forest (RF) and Cox models against QCOVID. (B) the F-β score generated at β = 1
(F1-score in bold), β = [ 0.5, 2, 3, 5], shown in decreasing size dashed line. AUC = area under the curve. Both the
ROC and F-β score curves show the performance at various thresholds (i.e. operation points). Threshold value
may be dependent on the application of the model. For example, in clinical circumstances requiring low false
negatives, the threshold would be optimised for recall, though this would also correspond to higher numbers of
false positives.
Figure 3. Plot of Cox model coefficients of COVID-19 mortality in UK Biobank cohort. Values show
HR ± 95%CI. AKF = acute kidney failure, MND = motor neurone disease, MS = multiple sclerosis,
HD = Huntington’s disease, HR = hazard ratio, CI = confidence interval.
strength of our model is that the risk of mortality is predicated on the assumption of a positive COVID-19 test,
avoiding the associated ambiguity of multi-event prediction and enabling its use in clinical practice.
The approach taken in the development of this model is a symbiosis of machine learning and traditional
statistical modeling, boosting the acceptability of the derived algorithm. From an optimisation perspective, the
objective of the model is to reduce the full feature array to a minimal subgroup (Fig. 1) while maintaining a
Scientific Reports | (2021) 11:16936 | https://doi.org/10.1038/s41598-021-95136-x 7
Vol.:(0123456789)www.nature.com/scientificreports/
high prediction accuracy for COVID-19 mortality. However, by significantly reducing the number of features
through the data-driven approach and clinical refinement, the model also overcomes the curse of dimensionality,
where beforehand the full feature array was far greater in size than the available samples, resulting in improved
performance (AUC: 0.91). The results show that both the RF and CPH models are comparable in terms of accu-
racy. However, the RF was integral to the CPH’s construction by searching through the large feature space and
selecting the most important of the original ~ 12,000. Moreover, the RF model is more resilient to overfitting the
data, and this could explain the improved F1-scores. Owing to its stability, we would recommend the RF model
as the preferred implementation in clinical practice. Given the different performance characteristics of the RF and
CPH models, an ensemble of the two models may be of interest for investigation to further improve stability and
performance. Prior to deployment in clinical practise, calibration of the final resulting model would be required
alongside external validation on a new dataset. In addition, further investigation into differing machine learning
models, such as S VMs42 or Deep Neural N etworks43 would be of merit. Such models could then be interpreted
using methodologies such as the S HAP or LIME45.
44
Several studies have reported risk models for COVID-19 mortality. In a review of prediction models for
COVID-19, Wynatts et al. report all current prediction models show high risk of bias, and lack evidence from
independent external validation46. While this model is yet to be externally validated, we have considerably larger
sample size than comparable models46 and, by implementing LOO cross-validation, our results have reduced
overall variability and bias than the traditional train-test-validate method. A recent study utilising only age,
minimum oxygen saturation during encounter, and health-care setting of patient encounter as features achieved
comparable results (AUC: 0.91)47, however, the intended use of this model differs from the one presented. While
the model presented outperforms QCOVID (AUC: 0.91 vs. 0.84), and best efforts were made in the comparison,
it cannot be considered a direct comparison. In replication of the QCOVID algorithms, variables were mapped
to related fields in the UKB, however, we were unable to confirm these were fully paired. Moreover, as the UKB
is not linked to GP databases in the same manner, there were some missing variables (Supplementary Table 2).
Importantly, contrasting with our purpose of supporting patient management, QCOVID is designed for popula-
tion risk stratification to aid public health decision-making, and was used to exemplify the necessity of specific
model design for specific purposes.
The COVID-19 pandemic has resulted in extraordinary acceptance of digital technology in healthcare48. Risk
assessment tools can support the streamlining of clinical time and resource prioritization, whether on a national,
organizational, or patient level. Models such as those presented, can support the latter by monitoring patients
at-scale and identifying those at-risk of severe illness, in real-time, and without requiring specialist equipment
or clinical input. Algorithm performance may be further improved by inclusion of passive, continuous variables
via smartphones or wearables. Establishing our model in a prospective healthcare setting may enable this when
coupled with high quality, continuous vital sign information and replete data on the course of symptomatol-
ogy. Similar digital phenotyping has also shown potential in predicting COVID-19 infection at early symptoms
onset49,50. We believe a combination of these two types of digital tools, in union with dedicated hospital-at-home
services, may become considered standard practice in infectious disease management, particularly during his-
torically resource-intense periods, such as annual influenza outbreaks.
While the use of the UKB is a key strength in the development of the model, there are associated limita-
tions which may impact the generalizability of the model. The UKB cohort trends towards being healthier and
wealthier than the general population, which poses a notable limitation when modeling noncommunicable
diseases51. As COVID-19 acquisition, however, is determined by exposure, this limitation is minimised in our
investigation. Separately, the UKB COVID-19 data subset is less likely to capture asymptomatic or non-severe
cases, in part as such individuals may not have received a test or sought medical treatment, but predominantly
owing to UKB’s enrichment for older age resulting in lesser rates of such presentation. The restricted age distribu-
tion (51–85 years) may further limit generalization of our findings to outside of this age range, however, Office
for National Statistics figures show those aged ≥ 50 have accounted for 97.97% of all COVID-19-related deaths
in England and Wales (up to 19th February 2021)52.
Although age is clearly an important feature, our sensitivity analysis (Supplementary Fig. 2) demonstrated
negligible performance drop, likely because much of the risk associated with older age is captured within other
included features. One reason for using uniform leave-one-out (LOO) training is to overcome such issues of
feature reliance and generalize the model as much as possible. The F-score in Fig. 2B illustrates this robustness,
however, this must be tested on a separate representative dataset for a conclusive answer. Our robust development
approach, paired with deep individual phenotyping, strengthens the evidence towards effective COVID-19 risk
profiling. Granular symptoms and vital measurements are significant in determining deterioration. However,
owing to the nature of this dataset, we could not model trajectories at this resolution but encourage further inves-
tigation in an appropriate dataset. In addition to the limitations of the dataset, it is likely that there are regional
variances in COVID-19 outcomes. As such, the model would strongly benefit from external validation, especially
with the continued emergence of disruptive SARS-CoV-2 v ariants53. Evidence of real-world utility, with the asso-
ciated incomplete and missing data, is lacking for COVID-19 risk models. Further research is required to both
establish prospective, real-world model performance and to understand the maximal data quality reduction, with
respect to advanced techniques to handle missing data, which still produces clinically acceptable performance.
Conclusion
In conclusion, we present a comprehensive, robust model based on readily accessible factors (AUC: 0.91). In
our analysis, we combine data-driven model development and clinical refinement to produce a model that
uniquely incorporates time-to-event, symptoms, and vital signs. We identify several significant novel predictors
of COVID-19 mortality with equivalent or greater predictive value than established high-risk comorbidities,
Scientific Reports | (2021) 11:16936 | https://doi.org/10.1038/s41598-021-95136-x 8
Vol:.(1234567890)www.nature.com/scientificreports/
such as detailed anthropometrics, lifestyle factors, and prior acute kidney failure, urinary tract infection, and
pneumonias. The design and feature selection of the framework lends itself for deployment at-scale in a digital
setting. Possible applications of this include supporting individual-level risk profiling and monitoring deteriora-
tion in high volumes of COVID-19 patients, particularly in hospital-at-home settings.
Online methods
Study population. The development and validation of the risk model was carried out using the UKB. The
UKB is a large cohort study with rich phenotype mapping of participants, including over 500,000 individuals
aged between 40- and 69-years-old at recruitment, between 2006 and 2010, from across England, Scotland, and
Wales54. The open dataset contains detailed health data and outcomes obtained prospectively from electronic
health records and self-reported health measures from on-site testing over the past 15-years. The current analy-
sis was approved under the UKB application number 55668. The UK Biobank study received ethical approval
from the North West Research Ethics Committee (16/NW/0274) and all participants provided written informed
consent.
COVID‑19 status and sample selection. For this study, only participants with a positive RT-PCR
COVID-19 test were included (Supplementary Fig. 1). Public Health England provided data on SARS-CoV-2
tests, including the specimen date, location, and result55. COVID-19 test result data were available for the period
16th March 2020 to 24th February 2021, and were linked with hospital admission (28th February 2021), pri-
mary care (1st October 2020), and death records (16th February 2021). In total, 101,062 COVID-19 tests were
conducted on 55,118 participants in the available cohort. Of these, 42,599 were excluded due to negative test
results. Overall, 12,519 participants tested positive of which 10,605 were survivors, 640 non-survivors, and 1,274
were excluded due to missing information. Deaths were defined as COVID-19-related if ICD-10 codes U07.1 or
U07.2 were present on the death records. No COVID-19 test data were available for UKB assessment centers in
Scotland and Wales, thus data from these centers were not included.
Time filtering. Considering the chronology of medical events is critical to distinguish between, for exam-
ple, pre-existing conditions and complications resulting from COVID-19. Specific attributes, therefore, can be
included or excluded in the prediction model for various use cases. This study focuses on developing a model to
predict mortality for COVID-19 patients before hospital admission. Accordingly, inclusion of respiratory failure
(ICD-10: J96.9), for example, as a symptom or complication to predict mortality has limited use, as such events
would demand hospital admission. Conversely, it is valuable to include personal history of respiratory failure as
a prognostic indicator. Thus, we implemented a time filter for all features which were not demographics, symp-
toms, or vital signs, excluding any data recorded less than one-week prior to patients’ positive COVID-19 test.
This accounted for the circumstance whereby a patient may have been admitted for severe symptoms of COVID-
19 prior to receiving a test. Further time filtering of < 1 month, 1–12 months, and > 12 months was applied to
specific acute features, and < 12 months, 12–60 months, and > 60 months for cancer related diagnosis, to provide
more granular insight. Similarly, it is important to consider only relevant symptoms and vital signs correspond-
ing to the period of COVID-19 infection. Thus, a two-week window pre- and post- the first COVID-19 positive
test was implemented.
COVID‑19 mortality model. Feature selection. The data ingestion pipeline, Fig. 1A, generates an array
of ~ 12,000 dimensions (including patient characteristics, pre-existing conditions, symptoms, and vital signs).
Owing to the disparity in size between the survivor and non-survivors population in the dataset and the im-
portance of obtaining an unbiased model, a LOO cross-validation experiment56, which is also closely related to
the jack-knife estimation method57, was used to search the full feature array for the most relevant features. LOO
iterates through every sample in the dataset, whereby at each step the current sample was used to evaluate the
model trained on the remaining dataset (Fig. 1C). At each iteration the samples of all classes were balanced to
ensure unbiased training and, following evaluation, the model was discarded and a new model trained. A RF
model was chosen due to its inherent ability to extract features, handle high dimensionality data, and generalize
well to unseen d ata58. During each step of the LOO cross-validation, a ranked list of features was extracted and
averaged across the entire experiment to obtain a final shortlist of features that produced the highest accuracy,
further cross-checked by clinical expertise. Figure 1B illustrates the production of shortlisted features driven by
data, and their validation and review based on clinical judgement.
Clinical feature selection was informed by a review of ranked feature importance in RF model. The highest
ranked 1,000 features were screened by at least two reviewers. Any disagreements were settled by consensus
with input of additional reviewers. Features were excluded where: (i) they could not be readily obtained through
self-reporting or measured outside of the clinical setting; (ii) there was high confounding with higher ranked
features; (iii) clinical consensus concluded that the feature’s rank was more likely to be explained by database bias.
Subsequently, features which were closely related (e.g. cancer diagnoses) were grouped together. Supplementary
ICD-10 codes were included and, where possible, generalized (Supplementary Table 3).
Model construction and validation. The LOO evaluation was selected to maximize the value of the available
datasets. The LOO is used in this case to quantitatively evaluate the model; it is not used for hyperparameter
tuning of the model. In essence, at each iteration of the LOO, there is a hold-out test set, which is a single sample
of unseen data. At each iteration, a completely new model is trained from scratch on a randomly selected set of
samples and tested on a single hold-out sample. At the end of the experiment, following iteration over all dataset
samples, the results of each of these hold-out sets are aggregated to provide the final evaluation performance of
Scientific Reports | (2021) 11:16936 | https://doi.org/10.1038/s41598-021-95136-x 9
Vol.:(0123456789)www.nature.com/scientificreports/
the model. None of the models at each iteration are used in any other iteration and they are completely discarded
once the iteration is complete. Specifically, this is equivalent to a k-fold evaluation, where k = n − 1, with n
being the total number of samples in the set. Moreover, LOO has been chosen to be as objective as possible when
reporting on the outcome of the model. A single hold-out set could potentially provide a different benchmark
depending on the random split of this set. Conversely, the LOO exhaustively tests against every sample in the
dataset.
In this study, the prediction classes were two: COVID-19 survivors (n = 11,245) and non-survivors (n = 640).
At each LOO iteration, two groups of equal sample size were randomly selected without replacement for training.
The evaluation sample outcome and RF likelihood value were aggregated from all iterations. After aggregating
all the evaluation results from the LOO experiment, the ROC curve analysis was carried out, and the AUC
computed as a measure of a ccuracy58. Furthermore, the F-β statistic was used to evaluate the robustness of the
model. When β is 1, this becomes the F1-score, which gives equal weights to recall and precision. A smaller β
value gives more weight to precision, minimising false-positive errors, while a larger β value gives more weight
to recall, minimising false-negative errors. The F-score range is [0, 1], where a score of 1 is a perfect performance.
The machine learning algorithm used in this study is the RF, which is an ensemble meta-estimator constructed
from several decision t rees58. These trees were fitted to the data using the bootstrap aggregation method (or
bagging), which is robust and resilient to over-fitting59. The Gini impurity was used to compute the model likeli-
hood of prediction. To quantify the prediction uncertainty of the RF model, a Monte Carlo approach was used
to compute the confidence interval of each prediction. A CPH model22, predicting survival time to death from
the first confirmed COVID-19 positive test result, was trained on the same subset of features selected by the RF
feature selection process and tested on in the same manner as the RF to maximise its explainability. We did not
carry out censoring of the data, as such, the AUROC can be considered the same as concordance probability
(Harrel’s C) for binary outcomes—which in this case is COVID-19 mortality and survival.
QCOVID comparison. We compared our model against QCOVID, a leading risk prediction model for infec-
tion and subsequent death due to COVID-19, which was developed by fitting a sub-distribution hazard model
on the QResearch d atabase11. Predictor variables reported in QCOVID were mapped to comparable features in
the UKB dataset. The UKB dataset did not include all of the relevant variables used in the QCOVID algorithm,
hence chemotherapy grades and medication variables were excluded in our analysis (Supplementary Table 2).
QCOVID risk equations for mortality were then implemented for both male and female cohorts. To ensure a
fair comparison between models, QCOVID risk equations were evaluated on the UKB dataset using the same
methods described above.
All methods within this article were performed in accordance with and was written following the TRIPOD
(Transparent Reporting of a Multivariable Prediction Model for Individual Prognosis or Diagnosis) guidelines60,
which are further elaborated in Supplementary Table 4.
Received: 10 March 2021; Accepted: 19 July 2021
References
1. Reuters, Inc. China, India’s COVID-19 vaccinations to stretch to late 2022: study | The Journal Pioneer. http://www.journalpio
neer.com/news/world/china-indias-covid-19-vaccinations-to-stretch-to-late-2022-study-545388/.
2. Oran, D. P. & Topol, E. J. Prevalence of Asymptomatic SARS-CoV-2 Infection. Ann. Intern. Med. 173, 362–367 (2020).
3. Byambasuren, O. et al. Estimating the extent of asymptomatic COVID-19 and its potential for community transmission: Systematic
review and meta-analysis. Off. J. Assoc. Med. Microbiol. Infect. Dis. Can. 5, 223–234 (2020).
4. Cao, Y., Hiyoshi, A. & Montgomery, S. COVID-19 case-fatality rate and demographic and socioeconomic influencers: worldwide
spatial regression analysis based on country-level data. BMJ Open 10, e043560 (2020).
5. Atkins, J. L. et al. Preexisting comorbidities predicting COVID-19 and mortality in the UK biobank community cohort. J. Gerontol.
Ser. A 75, 2224–2230 (2020).
6. Li, B. The association between symptom onset and length of hospital stay in 2019 novel coronavirus pneumonia cases without
epidemiological trace. J. Natl. Med. Assoc. https://doi.org/10.1016/j.jnma.2020.05.015 (2020).
7. Booth, A. et al. Population risk factors for severe disease and mortality in COVID-19: A global systematic review and meta-analysis.
PLOS ONE 16, e0247461. https://doi.org/10.1371/journal.pone.0247461 (2021).
8. Rechtman, E., Curtin, P., Navarro, E., Nirenberg, S. & Horton, M. K. Vital signs assessed in initial clinical encounters predict
COVID-19 mortality in an NYC hospital system. Sci. Rep. 10, 21545 (2020).
9. Zhou, F. et al. Clinical course and risk factors for mortality of adult inpatients with COVID-19 in Wuhan, China: a retrospective
cohort study. Lancet 395, 1054–1062 (2020).
10. Foy, B. H. et al. Association of red blood cell distribution width with mortality risk in hospitalized adults with SARS-CoV-2 infec-
tion. JAMA Netw. Open 3, e2022058 (2020).
11. Clift, A. K. et al. Living risk prediction algorithm (QCOVID) for risk of hospital admission and mortality from coronavirus 19 in
adults: National derivation and validation cohort study. BMJ 371, 1 (2020).
12. Jin, J. et al. Individual and community-level risk for COVID-19 mortality in the United States. Nat. Med. 1–6. https://doi.org/10.
1038/s41591-020-01191-8.
13. Barda, N. et al. Developing a COVID-19 mortality risk prediction model when individual-level data are not available. Nat. Com-
mun. 11, 4439 (2020).
14. Williamson, E. J. et al. Factors associated with COVID-19-related death using OpenSAFELY. Nature 584, 430–436 (2020).
15. Bertsimas, D. et al. COVID-19 mortality risk assessment: An international multi-center study. PLoS ONE 15, e0243262 (2020).
16. Yan, L. et al. An interpretable mortality prediction model for COVID-19 patients. Nat. Mach. Intell. 2, 283–288 (2020).
17. Knight, S. R. et al. Risk stratification of patients admitted to hospital with covid-19 using the ISARIC WHO Clinical Characterisa-
tion Protocol: development and validation of the 4C Mortality Score. BMJ 370, 1 (2020).
18. Qian, Z., Alaa, A. M. & van der Schaar, M. CPAS: the UK’s national machine learning-based hospital capacity planning system for
COVID-19. Mach. Learn. 110, 15–35 (2021).
Scientific Reports | (2021) 11:16936 | https://doi.org/10.1038/s41598-021-95136-x 10
Vol:.(1234567890)www.nature.com/scientificreports/
19. Nafilyan, V. et al. An external validation of the QCovid risk prediction algorithm for risk of mortality from COVID-19 in adults:
national validation cohort study in England. medRxiv 2021.01.22.21249968 (2021) doi:https://doi.org/10.1101/2021.01.22.21249
968.
20. Coronavirus (COVID-19) risk assessment. NHS Digital https://digital.nhs.uk/coronavirus/risk-assessment.
21. Shah, S. S., Gvozdanovic, A., Knight, M. & Gagnon, J. Mobile App-Based Remote Patient Monitoring in Acute Medical Conditions:
Prospective Feasibility Study Exploring Digital Health Solutions on Clinical Workload During the COVID Crisis. JMIR Form. Res.
5, 3190 (2021).
22. Cox, D. R. Regression Models and Life-Tables. J. R. Stat. Soc. Ser. B Methodol. 34, 187–220 (1972).
23. Bonanad, C. et al. The Effect of Age on Mortality in Patients With COVID-19: A Meta-Analysis With 611,583 Subjects. J. Am.
Med. Dir. Assoc. 21, 915–918 (2020).
24. Stefan, N., Birkenfeld, A. L. & Schulze, M. B. Global pandemics interconnected—obesity, impaired metabolic health and COVID-
19. Nat. Rev. Endocrinol. 1–15 (2021). https://doi.org/10.1038/s41574-020-00462-1.
25. Singhal, T. A Review of Coronavirus Disease-2019 (COVID-19). Indian J. Pediatr. 87, 281–286 (2020).
26. Chan, V. W.-S. et al. A systematic review on COVID-19: urological manifestations, viral RNA detection and special considerations
in urological conditions. World J. Urol. 1–12 (2020) doi:https://doi.org/10.1007/s00345-020-03246-4.
27. Dhar, N. et al. De novo urinary symptoms associated With COVID-19: COVID-19-associated cystitis. J. Clin. Med. Res. 12, 681–682
(2020).
28. Mumm, J.-N. et al. Urinary frequency as a possibly overlooked symptom in COVID-19 patients: Does SARS-CoV-2 cause viral
cystitis?. Eur. Urol. 78, 624–628 (2020).
29. Zhang-song, Wu., Zhi-qiang, Z. & Song, Wu. Focus on the Crosstalk between COVID-19 and Urogenital Systems. J. Urol. 204,
7–8 (2020).
30. Karabulut, I. et al. The Effect of the Presence of Lower Urinary System Symptoms on the Prognosis of COVID-19: Preliminary
Results of a Prospective Study. Urol. Int. 104, 853–858 (2020).
31. Alaa, A. M., Bolton, T., Angelantonio, E. D., Rudd, J. H. F. & Schaar, M. van der. Cardiovascular disease risk prediction using
automated machine learning: A prospective study of 423,604 UK Biobank participants. PLOS ONE 14, e0213653 (2019).
32. Rezaee, M., Putrenko, I., Takeh, A., Ganna, A. & Ingelsson, E. Development and validation of risk prediction models for multiple
cardiovascular diseases and Type 2 diabetes. PLOS ONE 15, e0235758 (2020).
33. Sanikini, H. et al. Anthropometry, body fat composition and reproductive factors and risk of oesophageal and gastric cancer by
subtype and subsite in the UK Biobank cohort. PLOS ONE 15, e0240413 (2020).
34. Petersen, A. et al. The role of visceral adiposity in the severity of COVID-19: Highlights from a unicenter cross-sectional pilot
study in Germany. Metabolism 110, 154317 (2020).
35. Watanabe, M. et al. Obesity and SARS-CoV-2: A population to safeguard. Diabetes Metab. Res. Rev. e3325 (2020) doi:https://doi.
org/10.1002/dmrr.3325.
36. Cappuccio, F. P., D’Elia, L., Strazzullo, P. & Miller, M. A. Sleep Duration and All-Cause Mortality: A Systematic Review and Meta-
Analysis of Prospective Studies. Sleep 33, 585–592 (2010).
37. Cappuccio, F. P., Cooper, D., D’Elia, L., Strazzullo, P. & Miller, M. A. Sleep duration predicts cardiovascular outcomes: a systematic
review and meta-analysis of prospective studies. Eur. Heart J. 32, 1484–1492 (2011).
38. Gangwisch, J. E. et al. Sleep Duration as a Risk Factor for Diabetes Incidence in a Large US Sample. Sleep 30, 1667 (2007).
39. Guan, W.-J. et al. Comorbidity and its impact on 1590 patients with COVID-19 in China: A nationwide analysis. Eur. Respir. J. 55,
1 (2020).
40. Wang, Z. et al. Clinical symptoms, comorbidities and complications in severe and non-severe patients with COVID-19. Medicine
(Baltimore) 99, 1 (2020).
41. Sperrin, M. & McMillan, B. Prediction models for covid-19 outcomes. BMJ 371, m3777 (2020).
42. Van Belle, V., Pelckmans, K., Van Huffel, S. & Suykens, J. A. K. Support vector methods for survival analysis: a comparison between
ranking and regression approaches. Artif. Intell. Med. 53, 107–118 (2011).
43. Katzman, J. L. et al. DeepSurv: personalized treatment recommender system using a Cox proportional hazards deep neural network.
BMC Med. Res. Methodol. 18, 24 (2018).
44. Lundberg, S. & Lee, S.-I. A Unified Approach to Interpreting Model Predictions. ArXiv170507874 Cs Stat (2017).
45. Ribeiro, M. T., Singh, S. & Guestrin, C. Model-Agnostic Interpretability of Machine Learning. ArXiv160605386 Cs Stat (2016).
46. Wynants, L. et al. Prediction models for diagnosis and prognosis of covid-19: systematic review and critical appraisal. BMJ 369,
(2020).
47. Yadaw, A. S. et al. Clinical features of COVID-19 mortality: development and validation of a clinical prediction model. Lancet
Digit. Health 2, e516–e525 (2020).
48. Whitelaw, S., Mamas, M. A., Topol, E. & Spall, H. G. C. V. Applications of digital technology in COVID-19 pandemic planning
and response. Lancet Digit. Health 2, e435–e440 (2020).
49. Mishra, T. et al. Pre-symptomatic detection of COVID-19 from smartwatch data. Nat. Biomed. Eng. 4, 1208–1220 (2020).
50. Miller, D. J. et al. Analyzing changes in respiratory rate to predict the risk of COVID-19 infection. PloS One 15, e0243693 (2020).
51. Fry, A. et al. Comparison of Sociodemographic and Health-Related Characteristics of UK Biobank Participants With Those of the
General Population. Am. J. Epidemiol. 186, 1026–1034 (2017).
52. Office for National Statistics. Deaths registered weekly in England and Wales, provisional. https://www.ons.gov.uk/peoplepopu
lationandcommunity/birthsdeathsandmarriages/deaths/datasets/weeklyprovisionalfiguresondeathsregisteredinenglandandwales.
53. Williams, T. C. & Burgers, W. A. SARS-CoV-2 evolution and vaccines: cause for concern? Lancet Respir. Med. 0 (2021).
54. Sudlow, C. et al. UK Biobank: An Open Access Resource for Identifying the Causes of a Wide Range of Complex Diseases of Middle
and Old Age. PLOS Med. 12, e1001779 (2015).
55. Armstrong, J. et al. Dynamic linkage of COVID-19 test results between Public Health England’s Second Generation Surveillance
System and UK Biobank. Microb. Genomics 6, e000397 (2020).
56. Webb, G. I. et al. Leave-One-Out Cross-Validation. in Encyclopedia of Machine Learning (eds. Sammut, C. & Webb, G. I.) 600–601
(Springer US, 2011). https://doi.org/10.1007/978-0-387-30164-8_469.
57. Efron, B. The jackknife, the bootstrap, and other resampling plans. (Society for Industrial and Applied Mathematics, 1982).
58. Breiman, L. Random Forests. Mach. Learn. 45, 5–32 (2001).
59. Breiman, L. Bagging Predictors. Mach. Learn. 24, 123–140 (1996).
60. Collins, G. S., Reitsma, J. B., Altman, D. G. & Moons, K. G. Transparent reporting of a multivariable prediction model for individual
prognosis or diagnosis (TRIPOD): the TRIPOD Statement. BMC Med. 13, 1 (2015).
Acknowledgements
This research has been conducted using data from UK Biobank, a major biomedical database (www.ukbiobank.
ac.uk).
Scientific Reports | (2021) 11:16936 | https://doi.org/10.1038/s41598-021-95136-x 11
Vol.:(0123456789)www.nature.com/scientificreports/
Author contributions
All authors have approved the final version of the manuscript submitted. All authors agree to be accountable for
all aspects of the work in ensuring that questions related to the accuracy or integrity of any part of the work are
appropriately investigated and resolved. M.A.D. conceived and designed the study, interpreted the results, devel-
oped the computation models, analysed the data, and wrote and reviewed the manuscript. A.B.R. and A.T.C.B.
conceived and designed the study, interpreted the results, and wrote and reviewed the manuscript. B.K. inter-
preted the results, developed the computation models, analysed the data, and wrote and reviewed the manuscript.
D. MOR developed the computation models, analysed the data, and wrote and reviewed the manuscript. A.Y. and
A.D. interpreted the results and wrote and reviewed the manuscript. E.B. and M.A. conceived and designed the
study and reviewed the manuscript. D.MOH., A.L., and D.P. interpreted the results and reviewed the manuscript.
Funding
This research was funded by Huma Therapeutics Ltd.
Competing interests
M.A.D., A.B.R., A.T.C.B., A.Y., A.D., B.K., E.B., M.A., D.MOR, and D.P. are employees of Huma Therapeutics
Ltd. D.MOH & A.L. declare that they have no conflicts of interest to report.
Additional information
Supplementary Information The online version contains supplementary material available at https://doi.org/
10.1038/s41598-021-95136-x.
Correspondence and requests for materials should be addressed to D.P.
Reprints and permissions information is available at www.nature.com/reprints.
Publisher’s note Springer Nature remains neutral with regard to jurisdictional claims in published maps and
institutional affiliations.
Open Access This article is licensed under a Creative Commons Attribution 4.0 International
License, which permits use, sharing, adaptation, distribution and reproduction in any medium or
format, as long as you give appropriate credit to the original author(s) and the source, provide a link to the
Creative Commons licence, and indicate if changes were made. The images or other third party material in this
article are included in the article’s Creative Commons licence, unless indicated otherwise in a credit line to the
material. If material is not included in the article’s Creative Commons licence and your intended use is not
permitted by statutory regulation or exceeds the permitted use, you will need to obtain permission directly from
the copyright holder. To view a copy of this licence, visit http://creativecommons.org/licenses/by/4.0/.
© The Author(s) 2021
Scientific Reports | (2021) 11:16936 | https://doi.org/10.1038/s41598-021-95136-x 12
Vol:.(1234567890)You can also read