New Genetic Insights in Rheumatoid Arthritis using Taxonomy3, a Novel method for Analysing Human Genetic Data
←
→
Page content transcription
If your browser does not render page correctly, please read the page content below
medRxiv preprint doi: https://doi.org/10.1101/2023.02.21.23286176; this version posted February 24, 2023. The copyright holder for this
         preprint (which was not certified by peer review) is the author/funder, who has granted medRxiv a license to display the preprint in
                                                                        perpetuity.
                                                All rights reserved. No reuse allowed without permission.

New Genetic Insights in Rheumatoid Arthritis
using Taxonomy3®, a Novel method for
Analysing Human Genetic Data
                                                                         Authors:
                        1*
Justyna Kozlowska
Neil Humphryes-Kirilov1
Anastasia Pavlovets1
Martin Connolly1
Zhana Kuncheva1
Jonathan Horner1
Ana Sousa Manso1
Clare Murray1
J. Craig Fox1
Alun McCarthy1

                                                      Affiliations:
1
    C4X Discovery Ltd, Manchester One, 53 Portland Street, Manchester, M1 3LD, UK

*
    Corresponding author e-mail address: justyna.kozlowska@c4xdiscovery.com

           NOTE: This preprint reports new research that has not been certified by peer review and should not be used to guide clinical practice.

                                                                                                                                                    1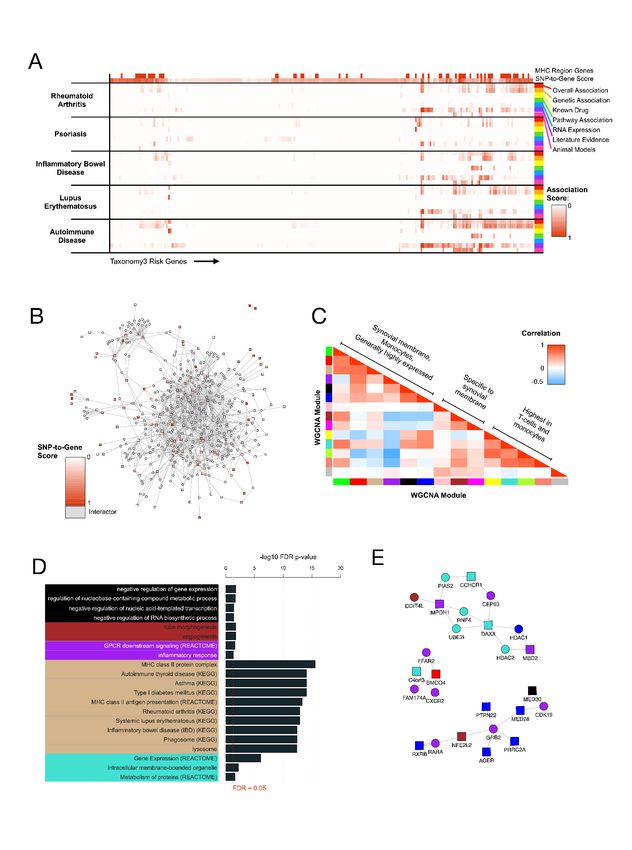
medRxiv preprint doi: https://doi.org/10.1101/2023.02.21.23286176; this version posted February 24, 2023. The copyright holder for this
      preprint (which was not certified by peer review) is the author/funder, who has granted medRxiv a license to display the preprint in
                                                                     perpetuity.
                                             All rights reserved. No reuse allowed without permission.

Abstract:
Genetic support for a drug target has been shown to increase the probability of success in drug development, with
the potential to reduce attrition in the pharmaceutical industry alongside discovering novel therapeutic targets. It is
therefore important to maximise the detection of genetic associations that affect disease susceptibility.
Conventional statistical methods used to analyse genome-wide association studies (GWAS) only identify some of the
genetic contribution to disease, so novel analytical approaches are required to extract additional insights. C4X
Discovery has developed a new method Taxonomy3® for analysing genetic datasets based on novel mathematics.
When applied to a previously published rheumatoid arthritis GWAS dataset, Taxonomy3® identified many additional
novel genetic signals associated with this autoimmune disease. Follow-up studies using tool compounds support the
utility of the method in identifying novel biology and tractable drug targets with genetic support for further
investigation.

Keywords:
Keywords: Rheumatoid arthritis (RA), genome-wide association studies (GWAS), Multivariate Analysis, Auto-immune
disease, Genetic susceptibility, Target ID

                                                                                                                                              2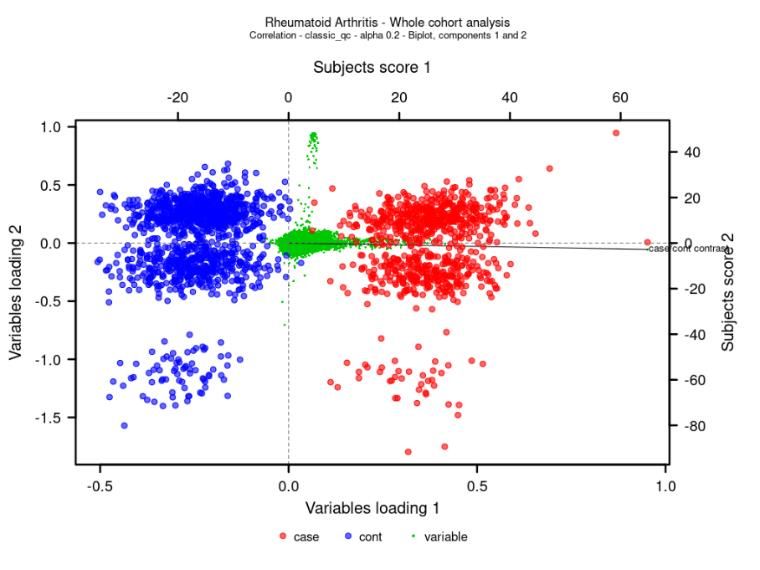
medRxiv preprint doi: https://doi.org/10.1101/2023.02.21.23286176; this version posted February 24, 2023. The copyright holder for this
       preprint (which was not certified by peer review) is the author/funder, who has granted medRxiv a license to display the preprint in
                                                                      perpetuity.
                                              All rights reserved. No reuse allowed without permission.

Introduction:
Attrition in drug development is a major issue for the pharmaceutical industry, particularly for complex diseases,
with significant R&D resources spent on projects that do not deliver new medicines for patients. It is now widely
accepted that genetic support of a therapeutic drug target leads to an increased probability of successful delivery to
patients of a new medicine, with the potential to significantly reduce attrition 1,2. These observations have directed
the focus of drug discovery groups on results from genetic studies of disease. As opposed to rare diseases, which are
often caused by the dysfunction of a single gene, common diseases are complex traits influenced by the added
contribution of many genetic variants. Conventional analysis of Genome-wide association studies (GWAS) have
generated thousands of associations, initially based on the study of single-nucleotide polymorphisms (SNPs) arrays
but increasingly using whole exome - or whole genome-sequence data 3. A critically important observation is that
>90% of GWAS variants identified fall in non-coding regions of the genome and thus do not directly affect the coding
sequence of a gene but rather accumulate in DNA regulatory elements and can disrupt binding sites for transcription
factors likely regulating the expression levels of genes in a cell type-specific manner. Therefore, it is unclear which
genes these variants regulate and in which cell types or physiological contexts this regulation occurs. This has
hindered the translation of GWAS findings and insights into clinical interventions 4.

Another key current limitation of using GWAS datasets to provide insights on relevant disease biology is that no
analysis method can extract all the genetic information relevant to a disease embedded in the genetics, leading to
the concept of ‘missing heritability’ i.e. the genetic component of disease susceptibility that is calculated from family
or twin studies, but cannot be fully accounted for by the known genetic associations detected.

Many explanations for this missing heritability have been proposed, including: the existence of many rare mutations
with strong effect not captured by the standard GWAS analysis methodologies 5 ; gene-gene interactions with strong
effect (where the individual genes are not in themselves sufficiently strongly associated with the disease to be
detected) 6–8; or ‘omnigenic’ models proposing that many thousands of genes with small effect impact disease
susceptibility such that even current meta-analyses are insufficiently powered to detect most of the signals 6–8.

Based on twin and family studies, heritability of rheumatoid arthritis (RA) is estimated at ~60%, showing a significant
impact of genetic variation on disease aetiology 9. A number of RA GWAS have been published, with datasets that
have included over 300,000 people 10–12. The largest of these studies identified ~75 loci associated with diagnosis of
RA (11 of which were novel) and while this is an important contribution to understanding the aetiology of the
disease, the authors calculate that the total of all these findings accounts for 40-50% of the heritability thought to
affect development of RA, leaving significant missing heritability still to be identified 12.

Whatever the reasons for the missing heritability, it is clear that many different analytical approaches are required to
maximise the extraction of genetic insights from disease datasets. To this end, C4X Discovery has developed a unique
method (called Taxonomy3®) for analysing human genetic datasets based on applying novel mathematics. The core
of the method converts genotypes into numbers that retain the information content of the genotypes in the context
of the case/control distinction being studied. This conversion allows linear algebra methods to be applied directly to
the data, probing the data in new ways. In this paper, we present details of application of Taxonomy3® to a
rheumatoid arthritis case/control dataset, show the additional genetic insights generated by the method, and
provide examples where the findings allow the potential initiation of drug discovery programmes based on drug
targets identified through these new genetic findings.

                                                                                                                                               3
medRxiv preprint doi: https://doi.org/10.1101/2023.02.21.23286176; this version posted February 24, 2023. The copyright holder for this
preprint (which was not certified by peer review) is the author/funder, who has granted medRxiv a license to display the preprint in
perpetuity.
All rights reserved. No reuse allowed without permission.
Methods:
Overview of Taxonomy3® Method:
Taxonomy3® is based on correlations of individualized divergences (named Log Bayes Factors, LBFs) 13, and
their Eigen decomposition: the mathematical principle of the method has been described previously 14–16. Briefly, for
each genotype in a case/control group, the LBF is calculated, and for all subjects, each genotype is replaced by the
calculated LBF for that genotype. In this way, the initial genotype data matrix is transformed into a LBF matrix of the
same dimension, representing the information gain provided by each subject and SNP pertaining to the overall
case/control distinction. LBFs have additive properties allowing the use of linear algebra tools. Eigen decomposition
of correlations of LBFs (PCA) is the preferred multivariate analysis method as it produces independent sets of
correlated variables. To accurately determine how much each variable contributes to case/control distinction, we
projected variable loadings on to the observed case/control direction in relevant dimensional space. Other datatypes
(gene expression, clinical variables etc.) can also be transformed into LBFs, which in turn can be co-analysed
alongside genotype LBFs 15.
The principal component results are visualized using biplots to display the relative position of subjects and variables.
From this, variables can be identified that are important for discriminating cases from controls. Statistical
significance is assessed by permutation of the case/control labels and re-analysis. For each variable, p-values are
obtained by comparing the true observer projected loading to the Gaussian mixture model (Mixmod software 17)
fitted to the distribution of the permuted projected loadings. The Family Wise Error Rate Šidák correction for
multiple testing is used to define the genome-wide threshold for significant variables using the exact number of tests
being carried out.
All analyses were performed with proprietary software on a cluster of Linux machines (Amazon Web Services). The
software has had various iterations and the latest production code has been developed in C++ and CUDA and passes
an exhaustive set of tests.
Taxonomy3® Analysis Data Management:
Before running the Taxonomy3® analysis of the case/control datasets, subjects and variables with poor quality data
were excluded, and Taxonomy3® co-analysis with HapMap populations used to identify case and control cohorts for
analysis that were matched for genetic ancestry.
Subjects and Phenotype Data
We analysed the rheumatoid arthritis (RA) dataset from the Welcome Trust Case Control Consortium (WTCCC),
comprising RA cases (n=1999) recruited from sites across the UK 11. As controls, we studied UK National Blood
Service (NBS) controls (n=1480) from the same source. Both cases and controls were genotyped with the Affymetrix
500K SNP chip (For more information on the cases and controls, see 11. The WTCCC has limited phenotype data on
the disease samples: disease status, age, sex and broad geographical region within Britain. The downloaded data
were stored and analysed on the Amazon Web Services cloud computing facilities. To ensure security, the data were
encrypted, stored behind a HIPAA-compliant firewall, and access to the data was restricted to a defined list of IP
addresses.
Genotypes
The latest annotations file for the discontinued Affymetrix 500K DNA chip was obtained from the manufacturer. We
used genotypes derived using the Chiamo algorithm as in the original WTCCC analysis, discarding genotypes having a
call probability lower than 90% 11.
4medRxiv preprint doi: https://doi.org/10.1101/2023.02.21.23286176; this version posted February 24, 2023. The copyright holder for this
preprint (which was not certified by peer review) is the author/funder, who has granted medRxiv a license to display the preprint in
perpetuity.
All rights reserved. No reuse allowed without permission.
Univariate Quality Control
The case and control data were first subject to conventional data quality control. The objective of this procedure was
to detect and remove potential biases that could undermine the analysis.
Gender: Checking for gender discrepancies is critical to Taxonomy3® as LBFs are not defined in the same way for X-
linked SNPs in males and females. Gender was inferred for each patient from intensities of X-linked genotypes and X
chromosome heterozygosity, and checked against the reported gender.
Missing values: Subjects with a missing value rate above 5% were removed from the analysis.
Relatedness: The objective of this analysis was to detect and remove inter-related subjects/samples from
subsequent analyses. We selected a total of 35,941 highly variable SNPs having a high Minor Allele Frequency (above
48%). We then determined the percentage of identical genotypes in all possible pairs of subjects.
Variables: Variables were excluded from the analysis for any of the following reasons:
1. Monomorphic in the whole population
2. Missing >5% of values
3. SNPs departing from Hardy Weinberg Equilibrium in the control group (threshold p=10-8).
In classical GWAS, SNPs having a low minor allele frequency (MAF) are usually removed due to power
considerations. This is not necessary in Taxonomy3®, as the method can handle rare variants.
HLA Imputation
Human leukocyte (HLA) genotyping is not available in WTCCC RA dataset, therefore imputation of antigen (HLA)
genotypes from SNP genotype data was performed in-house using the HIBAG imputation method 18 with pre-trained
parameter estimates specific to Affymetrix500k for European ancestry.
Multivariate Quality Control
As Taxonomy3® is a very sensitive method for identifying genetic associations, it is essential that the groups being
analysed are ethnically closely matched to avoid introducing bias due to non-disease-related patient stratification.
To achieve this, the cases and controls were co-analysed with HapMap data using Taxonomy3®. Appropriately
matched case and control populations for the trait being studied were selected using probabilistically defined
regions using the Mahalanobis distance around centres determined by k-means clusters for each population. An
appropriate α percentile was selected in order to retain the most subjects while minimising population
heterogeneity. This approach is used to remove – if necessary – subjects causing biases in the analysis, and
potentially confounding the case/control distinction.
Genetic ancestry: We carried out a co-analysis of the HapMap data with the RA (cases) and NBS (healthy
controls) datasets, looking to define an ethnically homogenous sub-group of subjects. The objective of the
analysis was to position RA and NBS subjects within a Caucasian/non-Caucasian ethnic contrast and to define an
ethnically homogenous subgroup of Caucasians. The Taxonomy3® analysis was conducted as follows:
- Reference population: HapMap Caucasians (CEU)
- Contrast populations: HapMap Chinese (CHB), Japanese (JPT), Tuscan (TSI) and Africans (YRI)
- Unknown subjects: RA and NBS subjects
SNP-to-Gene Mapping
A custom SNP-to-gene mapping pipeline was used, which implemented both FUMA 19 and variant to gene (V2G)
from Open Targets Genetics 20 to gather evidence. First, SNPs in high LD (r2 ≥ 0.6) with Taxonomy3® SNPs were
extracted from the EUR population of 1000 Genomes Data Phase 3 21. These SNPs were then mapped to genes
(“Tax3 genes”) by genomic distance (medRxiv preprint doi: https://doi.org/10.1101/2023.02.21.23286176; this version posted February 24, 2023. The copyright holder for this
preprint (which was not certified by peer review) is the author/funder, who has granted medRxiv a license to display the preprint in
perpetuity.
All rights reserved. No reuse allowed without permission.
and used to calculate a prioritisation score TOPSIS from the MCDA R package 23 based on a theoretical best and
worst SNP-to-gene mapping. Standard evidence weights were based on Open Targets Genetics V2G scoring
(functional prediction: 0.35, QTL evidence: 0.35, genomic distance: 0.2, chromatin proximity: 0.1). A TOPSIS score
threshold of 0.4 was implemented to represent high quality mappings, whereby the SNP occurs within a gene or has
a significant eQTL. This pipeline is available on GitHub (github.com/c4x-discovery/tax3-s2g).
Assessment of Novelty
To assess the novelty of the findings at the SNP and gene level, data curated by the Open Targets 24 and Open
Targets Genetics 20 platforms were used. All reported GWAS results related to EFO_0000685 (rheumatoid arthritis) in
European populations were downloaded using the Open Targets Genetics API (November 2021) and lead SNPs were
subjected to our SNP-to-gene mapping pipeline. Open Targets Indirect Disease Association Scores for Tax3 genes
were investigated for novelty at the gene level (Open Targets download version 06.21).
Bioinformatic Assessment of Drug Tractability
Target tractability details were downloaded from Open Targets 24 (Open Targets download version 11.21) to identify
potential modalities to drug genetic targets directly or via relevant biological interactions. Scores were allocated to
terms to aid visualisation of druggable targets. (Approved Drug: 1, Advanced Clinical: 0.9, Phase 1 Clinical: 0.8,
Structure with Ligand: 0.5, UniProt loc high conf: 0.5, Literature: 0.5, GO CC high conf: 0.45, High-Quality Ligand: 0.4,
UniProt loc med conf: 0.4, UniProt Ubiquitination: 0.4, High-Quality Pocket: 0.3, UniProt SigP or TMHMM: 0.3,
Database Ubiquitination: 0.3, Med-Quality Pocket: 0.2, GO CC med conf: 0.2, Half-life Data: 0.2, Druggable Family:
0.1, Human Protein Atlas loc: 0.1, Small Molecule Binder: 0.1)
Network and Pathway Enrichment
Network expansion was conducted on the protein-coding Tax3 genes from SNP-to-gene mapping, using
experimental protein-protein interaction data from IntAct 25 (downloaded from Open Targets). A minimum IntAct
score threshold of 0.5 was used to identify medium-high confidence known protein-protein interactions between
Tax3 genes, and interactors were included that interacted with at least 2 Tax3 genes. This provided a network of
potential interactors that may be occurring in relevant cells and tissues. Disease-relevant gene expression data was
obtained from Genevestigator 26. 511 mRNA-seq samples were retrieved from studies relevant to RA, including only
human samples labelled as RA or healthy control. This relevant set included blood and synovial tissues and cell types.
Gene expression-based clustering was performed on Tax3 genes + interactors using WGCNA27 and clusters were
analysed in the context of the protein-protein interaction network. Network and pathway enrichment was
performed using the anRichment R package 27 using the built-in “GO” and “biosys” collections. Network visualisation
and clustering was performed within R using igraph (Csardi and Nepusz, 2006) and visNetwork.
Cell Assays:
Preliminary validation of putative targets was performed using tool compounds in a cytokine release assay with
peripheral blood mononuclear cells (PBMCs). Briefly, human PBMCs from healthy donors (n=3) were prepared from
buffy coats and resuspended in RPMI-1640 containing 10% FBS, 1% penicillin/streptomycin, 2 mM L-glutamine and 50
μM 2-Mercaptoethanol. 1x10⁵ cells were added per well to a 96-well flat-bottomed plate, and for stimulated wells,
anti-CD3 (final concentration 0.25 µg/mL) was added to cells immediately prior to seeding to the plate. Compounds
(BML-210, CTLA-4 Fc Chimera, C4X_17358 and Merimepodib) were solubilised in DMSO with the final vehicle
concentration in wells of 0.1%. Treatments were added in triplicate to wells in a final volume of 100 µL per well. Cells
were cultured for 72 hours at 37°C, 5% CO2. At the end of the culture period, cells were stained for viability using
eBioscience Fixable Viability Dye eFluor 780, and supernatants were collected for subsequent assessment of cytokine
production by multiplex using ThermoFisher custom ProcartaPlex kits.
6medRxiv preprint doi: https://doi.org/10.1101/2023.02.21.23286176; this version posted February 24, 2023. The copyright holder for this
preprint (which was not certified by peer review) is the author/funder, who has granted medRxiv a license to display the preprint in
perpetuity.
All rights reserved. No reuse allowed without permission.
Results:
Univariate Quality Control
Subjects and patients: Gender discrepancies were discovered in 19 subjects, 2 subjects had a missing value rate
above 5%, and 5 subjects were found to be related: these subjects were removed from the analysis. A total of 26
subjects, predominantly RA patients, were removed due to univariate QC deviations.
Variables: The following steps were combined to establish the variables that were used in subsequent analyses
(Table 1):
Table 1 Univariate QC procedures for SNPs (using the 90% genotype call probability threshold)
Filter Number of Outcome
variables*
Monomorphic SNPs 15,858 Removed
> 5% missing value rate 17,485 Removed
SNPs departing from HWE in controls 3,663 Removed
* There are some overlaps between these filters (e.g. a SNP may monomorphic and have >5% missing data)
We obtained the latest annotations file from Affymetrix pertaining to their discontinued 500K chip. Table 1 in
supplementary material shows descriptive statistics for merged NBS & RA datasets and Table 2 in supplementary
material shows the chromosomal location of available variables.
From an initial list of 500,306 variables, the final QC’d data for multivariate QC analysis included 480,785 variables.
Multivariate Quality Control
Chiamo generated genotype calls were used. A total of 480,785 SNPs shared by all datasets, non-monomorphic and
having a total missing value rate lower than 5%, were analysed.
Fig. 1a shows the global Caucasian/non-Caucasian ethnic contrast. Subjects were somewhat dispersed, but the
majority overlapped with the CEU cluster.
Fig. 1 PCA score plot of Taxonomy3® co-analysis of HapMap, RA (case) and NBS (control) subjects. A Caucasian/non-
Caucasian ethnic contrast with RA (case), NBS (control) and other genetic ancestries as unknowns – in correlation
PCA. B PCA score plot of Taxonomy3® co-analysis of HapMap subjects. Patients within pink and green ellipses
represent subjects associated with RA and NBS cohorts respectively, close to the CEU cohort. This is an expanded
view of the region of interest.
7medRxiv preprint doi: https://doi.org/10.1101/2023.02.21.23286176; this version posted February 24, 2023. The copyright holder for this
preprint (which was not certified by peer review) is the author/funder, who has granted medRxiv a license to display the preprint in
perpetuity.
All rights reserved. No reuse allowed without permission.
A. B.
Fig. 1b shows the ethnic boundaries for cases and controls defined using a Mahalanobis distance from the Caucasian
cluster centre. A percentile value of α=0.2 was selected to define subjects in both cohorts using their respective
ellipses.
The RA population in the WTCCC dataset was heavily skewed towards females. To reduce the chance for spurious
associations the sample was gender balanced to achieve an odds ratio of 1.
The output from the multivariate analysis gives a final population of 2005 subjects (Table 2) Subsequent
Taxonomy3® analyses were restricted to these subjects.
Table 2 Final Case/Control Cohorts
Cases Controls
pre univariate QC 1860* 1480
post univariate QC 1834 1471
post multivariate QC 1563 1212
post multivariate QC gender balanced 793 1212
*1860 subjects available from the initial 1999 after applying manufacturer’s exclusion criteria.
Taxonomy3® Analysis Results
The primary output of Taxonomy3® analysis is shown in the biplot in Fig. 2. The cases and controls are well separated
by the 1st principal component (PC), and the case/control dummy variable is closely aligned with the X-axis, showing
that case/control separation is the biggest source of variation in the dataset (Fig. 2a). This is confirmed by the Scree
plot (Fig. 2b) which shows that most variation is accounted for by the first principal component, with much smaller
contributions from the other components. Variables projecting from the central origin along the case/control axis
are relevant to discriminating cases and controls. 2nd PC reveals a clustering pattern splitting both cases and controls
into three distinct subgroups. Fig. 2c and d show the loci driving the separation in PC1 and PC2, respectively.
8medRxiv preprint doi: https://doi.org/10.1101/2023.02.21.23286176; this version posted February 24, 2023. The copyright holder for this
preprint (which was not certified by peer review) is the author/funder, who has granted medRxiv a license to display the preprint in
perpetuity.
All rights reserved. No reuse allowed without permission.
Permutation analysis was used to determine statistical significance of these findings. A total of 10,000 permutations
of case/control labels and re-analysis were carried out. Based on the inspection of the Scree plot, 5 PCA components
were retained. The Šidák genome wide significance threshold was used (alpha=5%, p-value = 1.13e-07). The resulting
Manhattan plot is shown in Fig. 2e. Statistically significant loci were spread across the genome with large LD block
located on chromosome 6. Many of the loci on chromosome 6 are located within the major histocompatibility
complex (MHC) region as indicated by HLA imputed variables (on the Manhattan plot Fig. 3e plotted as chromosome
HLA).
Fig. 2 Taxonomy3® analysis plots. A Biplot of the first two PCA components, showing NBS controls (blue), RA cases
(red) and SNPs variables (green). B PCA Scree plot, showing that most of the signal was retained by the first few
principal components. C, D Manhattan plots for loadings 1 and 2. E Manhattan plot based on 10, 000 permutations
of the case/control status representing projected loadings as p-values. The red and blue dotted lines represent the
Šidák and Benjamini-Hochberg whole genome statistical thresholds, respectively. Plotted as HLA are imputed HLA
variables and as P - data collection centres
A. B.
C. D.
9medRxiv preprint doi: https://doi.org/10.1101/2023.02.21.23286176; this version posted February 24, 2023. The copyright holder for this
preprint (which was not certified by peer review) is the author/funder, who has granted medRxiv a license to display the preprint in
perpetuity.
All rights reserved. No reuse allowed without permission.
E.
Interpretation of Taxonomy3® Findings (SNP-to-gene)
Taxonomy3® genetic findings were mapped to genes using the parameters and pipeline described in Methods. The
combined Taxonomy3® analysis revealed 173 SNPs that exceeded the Šidák significance threshold. As expected, and
consistent with variants detected by conventional analysis all of these SNPs except for one SNP (rs1800416) are
located in non-coding regions of the genome. 109 significant SNPs mapped to the MHC region on chr6. The MHC
region presents a challenge for SNP-to-gene mapping, as it is highly polymorphic, has a very high gene density and a
low recombination rate resulting in a strong LD structure. Using the SNP-to-gene thresholds detailed in methods, a
list of 233 genes was obtained (190 protein-coding genes).
Novelty of Taxonomy3® Findings
The novelty of Tax3 SNPs were assessed in two ways, by colocalising Taxonomy3® genetic signals with published
GWAS results, and using gene-level disease association scores from Open Targets 24 to explore known associations
(genetic and others) between Tax3 genes and RA and related autoimmune disorders.
First, Tax3 SNPs were compared to significant GWAS results by matching exact rsIDs or matching rsIDs to SNPs in
high LD (r2 ≥ 0.6 in 1KG Ph3 EUR). Using this method, 2 loci within the MHC region were matched (rs6457620/HLA-
DQB1 and rs9268557/HLA-DRA) and 1 locus on chr1 (rs6679677/PTPN22). To expand this genetic mapping,
significant GWAS SNPs were mapped to genes using the same pipeline as Tax3 SNPs. This identified 6 additional loci
outside the MHC region mapping to the same top genes, RTN4IP1 and SUPT3H on chr6, ACOXL on chr2, TTC34 on
chr1, LYZL1 on chr10 and AMOTL1 on chr11.
For gene-level disease association, 3 related autoimmune disorders were selected (psoriasis, inflammatory bowel
disease (IBD) and systemic lupus erythematosus) based on their potential overlap of disease aetiology with RA and
the understanding of heritable elements for these diseases. The scores are hierarchically cumulative, so the
autoimmune disease scores represent an accumulated score for all autoimmune disorders according to Open Targets
24
. Fig. 3a displays a heatmap of these scores, excluding 86 Tax3 genes that have a value of 0 for all selected scores.
SNP-to-gene evidence (TOPSIS) is also displayed, and MHC region genes are labelled. Rows and columns are
hierarchically clustered using hclust from the fastcluster 29 R package. This analysis revealed 3 additional weak known
10medRxiv preprint doi: https://doi.org/10.1101/2023.02.21.23286176; this version posted February 24, 2023. The copyright holder for this
preprint (which was not certified by peer review) is the author/funder, who has granted medRxiv a license to display the preprint in
perpetuity.
All rights reserved. No reuse allowed without permission.
genetic associations with RA (chr2 rs4338920 LRP1B, chr13 rs17086772 SLC46A3 and chr4 rs17669915 LEF1). These
weak associations are from GWAS for non-European populations, case-case comparative GWAS and similar disease
GWAS. Other interesting genes without known genetic association with RA include 2 genes targeted by drugs in RA
clinical trials (PDE5A: Dipyridamole, IMPDH1: Mizoribine), 1 additional gene targeted by drugs in clinical trials for
other autoimmune diseases (ADRA1: Isoxsuprine for multiple sclerosis), 6 genes with known genetic association to
autoimmune diseases but not RA (C1QTNF6, BCL2L11, KAZN, ETV3, MACROD2, PROK2, KCNE4), and 3 genes from
pathways linked to IBD (PROK2, CYTH4, RAC2).
Taxonomy3® findings have been shown to support many existing genetic associations with RA, reveal unknown
genetic associations with genes that are known to be associated with RA or related autoimmune disorders, and
provide 150 novel, genetically associated RA targets for further validation and exploration.
In-silico exploration of Taxonomy3® Findings
Bioinformatics analysis was performed to interpret and prioritise the Tax3 genes. The 190 protein-coding genes
underwent enrichment analysis as described in Methods. The top significantly enriched terms included Antigen
processing and presentation (KEGG) (FDR p=3.96e-03), MHC class II antigen presentation (REACTOME) (FDR
p=8.27e-03), and many KEGG terms for autoimmune and infectious diseases, including Staphylococcus aureus
infection (FDR p=3.96e-03), Autoimmune thyroid disease (FDR p=8.27e-03), Systemic lupus erythematosus (FDR
p=1.69e-02), Asthma (FDR p=8.27e-03), and Rheumatoid arthritis (p=1.69e-02). These results were highly dominated
with HLA genes, so a separate enrichment was performed excluding genes from the MHC region. The top terms for
this analysis were transferase activity (p=1.53e-03) and bone morphogenic protein (BMP) signalling pathway
(p=1.53e-03), the latter of which has been linked to autoimmune disease 30.
Fig. 3 In-silico Exploration of Taxonomy3® Findings. A Known disease associations with genes mapped from Tax3
SNPs, using data from the Open Targets platform. B Network of protein-protein interactions between Tax3 genes
(red/pink) and known interactors, using data from the IntAct database. C Broad clustering of WGCNA co-expression
modules, showing enrichment across various tissues relevant to RA. D Significantly enriched terms for WGCNA co-
expression modules. E Network expansion of purple module genes. Square nodes represent Tax3 genes and circular
nodes represent interactors
11medRxiv preprint doi: https://doi.org/10.1101/2023.02.21.23286176; this version posted February 24, 2023. The copyright holder for this
preprint (which was not certified by peer review) is the author/funder, who has granted medRxiv a license to display the preprint in
perpetuity.
All rights reserved. No reuse allowed without permission.
12medRxiv preprint doi: https://doi.org/10.1101/2023.02.21.23286176; this version posted February 24, 2023. The copyright holder for this
preprint (which was not certified by peer review) is the author/funder, who has granted medRxiv a license to display the preprint in
perpetuity.
All rights reserved. No reuse allowed without permission.
Genetic association can only elucidate part of the mechanistic network for complex diseases, and our inclusive SNP-
to-gene mapping pipeline will include false positives, so in order to contextualise our gene list and encourage
dropout of false positives, a network expansion and clustering approach was undertaken. Experimentally validated
protein-protein interactions (PPI) from IntAct 25 were obtained between genes within the 190 protein-coding Tax3
genes, and also between interactor proteins and at least 2 Tax3 genes. The resulting PPI network included 114 Tax3
genes and 359 interactors. Network visualisation and clustering revealed some peripheral clusters, some clusters
formed of pairs of Tax3 nodes with many common interactors, and a large central subnetwork of interconnected
nodes (Fig. 3b). These interactions are mainly from in-vitro studies, so represent potential protein-protein
interactions that could occur in a physiological context. To interpret this network and identify relevant clusters and
subnetworks, 2 complementary approaches were undertaken, PPI network community identification using network
clustering methods within igraph 28, and network coexpression clustering using WGCNA 27.
PPI subnetworks were identified using the cluster walktrap method from the igraph R package 28. This identified 20
clusters with at least 5 members. For coexpression clustering, relevant gene expression data was downloaded from
Genevestigator 26. 511 patient samples from RA studies were selected, representing multiple disease-relevant tissue
types, and 233 Tax3 genes + 349 interactors underwent network coexpression clustering using WGCNA 27. This
identified 14 clusters, 13 of which had distinct eigengene expression profiles in RA-relevant tissues. Correlation
analysis of cluster eigengenes revealed 3 overall cluster groups (Fig. 3c) representing targets that were 1: widely
expressed but highest in synovial membrane and monocytes, and low in fibroblast synoviocytes, 2: synovial
membrane-specific, 3: highest expression in T-cells and monocytes, showing that Tax3 genes are enriched for genes
expressed in highly disease-relevant cell types. 5 of these coexpression clusters had significantly enriched pathway
terms, using a combined collection of GO, KEGG and REACTOME terms (Fig. 3d). The tan cluster was highly enriched
for MHC class II genes, and many diseases for which MHC-II factors are associated. The purple cluster was enriched
for inflammatory response genes (FDR p=4.53e-02). This cluster did not feature any direct protein-protein
interactions, but expanding this cluster for direct interactors displayed multiple purple interactor genes that may
provide additional druggable targets to perturb the RA-specific inflammatory network identified through Tax3
genetic associations (Fig. 3e). This analysis provides potential drug targets that could be taken forward into a variety
of assays to explore and validate their role in disease aetiology.
Small-molecule druggability (tractability) assessment was also conducted on network nodes using data from the
Open Targets platform 24 as described in methods. 3 additional interactor genes were identified that are targeted by
drugs in clinical trials for autoimmune diseases (FGFR3: Masitinib for RA, KCNA3: Dalfampridine for multiple
sclerosis, PSMB5: Bortezomib and Ixazomib for autoimmune thrombocytopenic purpura) In order to progress the
analysis and validate potential therapeutic targets, genes with available tool compounds were selected that may
impact and disrupt the disease network.
In vitro validation of Taxonomy3® findings
In an attempt to validate the novel genetic associations from Taxonomy3® analysis in a preliminary cellular context,
we identified those putative RA targets which were entirely novel, and those established RA targets without a
genetic link that have been previously found to be expressed in leukocytes. Publicly available tool compounds were
available for MEF2B and IMPDH1, and an internal compound (C4X_17358) was synthesized as an inhibitor of the
potassium channel Kv1.3 (IC50 2nM determined via SyncroPatch, data not shown), of which the Tax3 gene KCNE4 is a
functional co-factor (Table 3). These compounds were tested in the PBMC validation assay as described in the
Methods. CTLA-4 Fc Chimera was included in the study as a positive control 31,32. Whilst it not certain that the
putative genetic variants modulate the mapped genes in PBMCs specifically, using tool compounds to investigate
potential modulation of inflammatory pathways in these cells would provide justification to investigate this further.
Table 3 Taxonomy3® targets to be tested in PBMC validation assay
13medRxiv preprint doi: https://doi.org/10.1101/2023.02.21.23286176; this version posted February 24, 2023. The copyright holder for this
preprint (which was not certified by peer review) is the author/funder, who has granted medRxiv a license to display the preprint in
perpetuity.
All rights reserved. No reuse allowed without permission.
Target Tool compound Genetic link to RA Established mechanism in RA
MEF2B BML-210 33 NO NO
Kv1.3 (KCNE4) C4X_17358 NO YES 34
IMPDH1 Merimepodib 35 NO YES 36
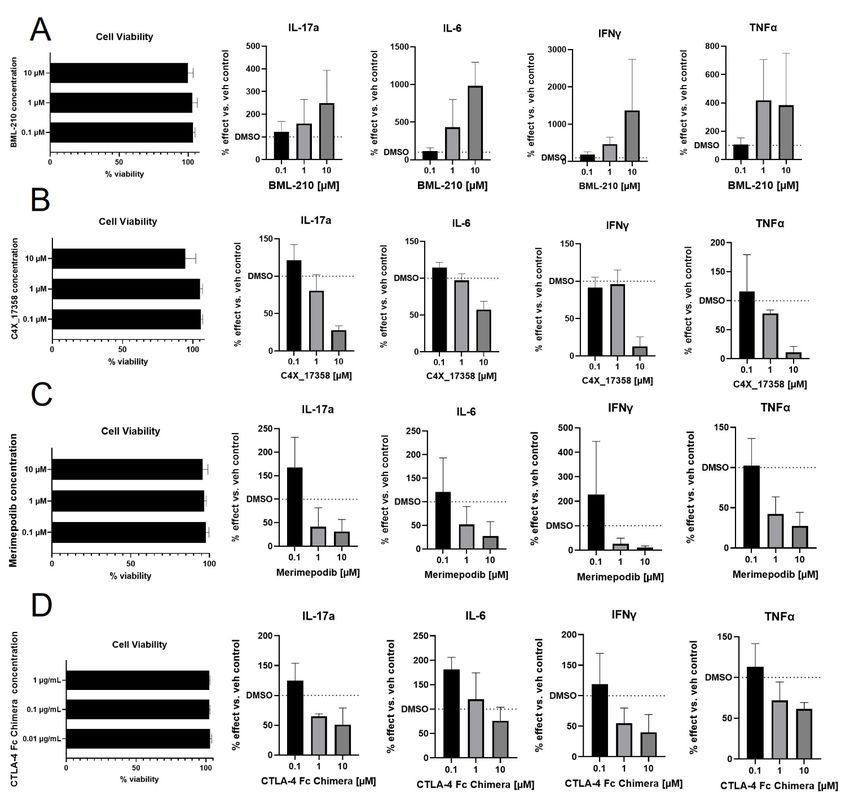
Following 72 hours of treatment, no compound was found to reduce cell viability below 75% (Fig. 4). Pro-
inflammatory cytokine measurements were carried out for (interleukins) IL-17a, IL-6, interferon gamma (IFNγ) and
tumour necrosis factor alpha (TNFα) (Fig. 4a-d) in cells stimulated with anti-CD3. BML-210 treatment resulted in a
trend to further increase inflammatory cytokine release with increasing compound concentration (Fig. 4a).
Comparatively, treatment with C4X_17358, merimepodib or CTLA-4 Fc Chimera resulted in a trend toward a
decrease in pro-inflammatory cytokines with increasing compound concentration (Fig. 4b-d).
Fig. 4 PBMC assay validation of Taxonomy3® targets. PBMCs were cultured, stimulated with anti-CD3 and treated
with tool compounds as listed for 72 hours. A BML-210 treatment. B C4X_17358 treatment. C Merimepodib
treatment. D CTLA-4 Fc Chimera treatment. Viability of PBMCs was measured via eBioscience Fixable Viability Dye
eFluor 780. Viability is represented as a percent of the viability of vehicle control cells. Levels of secreted IL-17a, IL-6,
IFNγ and TNFα were determined via multiplex. Levels of cytokines are represented as a percent of cytokine secreted
compared to vehicle control cells. PBMC assays were performed in technical triplicates, and an average of the three
values taken to represent one biological replicate; three biological replicates were performed (three different
donors)
14medRxiv preprint doi: https://doi.org/10.1101/2023.02.21.23286176; this version posted February 24, 2023. The copyright holder for this
preprint (which was not certified by peer review) is the author/funder, who has granted medRxiv a license to display the preprint in
perpetuity.
All rights reserved. No reuse allowed without permission.
Discussion:
To date, divergences – which were originally conceived in vector calculus to explore fluid mechanics - have not been
extensively used in biology. LBFs have been used in assessing diagnostic kit performance 37, and more recently they
have been used in Bayesian Analysis of Gene Essentiality (BAGEL) methodology to analyse pooled CRISPR studies 38.
Taxonomy3® is the first application of which we are aware that applies individualised LBFs to human genetic data
linked to a binary outcome. By replacing individual genotypes with the corresponding LBF, a wide range of linear
algebra methods can be brought to bear on the genetic data. Analysing the LBF matrix using PCA generates a
number of outputs:
● Variables of interest relevant for case/control discrimination;
● Heterogeneity in the case/control populations, allowing for sub-groups within the populations to be
identified;
● Variables of interest relevant for sub-group separation.
15medRxiv preprint doi: https://doi.org/10.1101/2023.02.21.23286176; this version posted February 24, 2023. The copyright holder for this
preprint (which was not certified by peer review) is the author/funder, who has granted medRxiv a license to display the preprint in
perpetuity.
All rights reserved. No reuse allowed without permission.
As this is a different approach to exploring genetic data, it is not surprising that the outputs are not identical to the
output of the conventional GWAS analysis. In the original analysis of this RA case/control dataset 11, two peaks were
seen, one on chromosome 6 in the MHC region, and one on chromosome 1. The Manhattan plot from our
Taxonomy3® analysis (Fig. 2 a, e) shows that we have replicated these two findings and also greatly increased the
number of significant associations. Comparison of our findings with the data currently available on Open Targets
shows that while some of our additional findings have been observed in other, subsequent larger studies or meta-
analyses (which provides additional validation for our methodology), there are other findings that provide truly novel
insights.
Bioinformatic analysis of the Tax3 genes showed significant clustering in immune-related pathways (Fig. 3 b),
providing good validation for the newly-identified genes. Likewise, co-expression clustering analysis showed that
changes of expression of the genes were enriched in T-cells, synovial tissues and monocytes – highly disease-relevant
cell types (Fig. 3 c).
Suitable tool compounds were only available for a few of the Tax3 genes – Kv1.3 (KCNE4), IMPDH1 and MEF2B: two
of these are of particular note:
KCNE4: Association with this gene was identified through Taxonomy3® analysis. This gene has not previously been
associated with RA, and codes for an accessory protein modulating the activity of Kv1.3 39,40. This K+ channel is
important for the functioning of TEM cells, which have a key role in maintaining the autoimmune drive in RA 41–43. For
this reason, inhibiting this channel has been proposed as a possible target for various inflammatory diseases 44–46
including RA. We consider that the addition of genetic support for the pathway from our Taxonomy3® analysis
significantly increases the likelihood of successful clinical development for inhibitors of Kv1.3.
MEF2B: This gene mapped from a SNP identified in Taxonomy3® analysis. The gene has not been associated with RA
in published GWAS, and there is limited data to implicate the gene in RA. Examination of the tool compound BML-
210, that blocks the interaction of MEF2 with histone deacetylase (HDAC), in in vitro models showed consistent
effects of inhibition of MEF2B on immune cell function. This result underlines the ability of Taxonomy3® analysis to
generate novel genetic insights, adding significantly to our knowledge of disease aetiology, and flagging novel drug
targets with genetic support.
Association with NR4A3 was also identified in Taxonomy3® analysis passing the Benjamini-Hochberg genome wide
significance threshold (false discovery rate correction). This nuclear receptor is known to impact expression of FoxP3,
the key gene required for regulatory T-cell (Treg) formation 47–49. A number of publications have demonstrated a
dysfunction of Treg cells in RA patients 50–52, and therapeutic modulation of Tregs for RA has been proposed 53.
Unfortunately, no suitable tool compounds were available to probe the functioning of this gene in the PBMC model.
There are a number of limitations to this study. Firstly, we have not been able to analyse other datasets (potentially
from other genetic ancestries) to examine the translation of our findings to other populations. Secondly, as with all
genetic studies, the inherent uncertainties of SNP-to-gene mapping means that the genes described here may not be
the true genes involved in the genetic susceptibility detected by Taxonomy3®. However, we have maximised the
chance of including the causal gene by using a combination of positional and functional mapping in our SNP-to-gene
process and downstream triaging to identify the genes with a high probability of impacting disease aetiology.
Furthermore, as non-coding variants are thought to regulate genes in a cell type specific manner, it is possible that
some or all of the subset of Tax3 genes we examined in the PMBC assay (MEF2B, Kv1.3 (KCNE4), IMPDH1) are in fact
regulated by the variants detected, in a different cell type (e.g. fibroblast synoviocytes). Once confidence in a SNP-
gene mapping is achieved, along with demonstrating clear impact of the target in a disease relevant context
(conduct of additional studies extending beyond the remit of this publication) validation of the genetics will need to
be confirmed e.g. show differential regulation of the gene in question depending on which allele is present. As the
genotypes for the PBMC donors were not available this could not be examined alongside the tool compound
examination.
16medRxiv preprint doi: https://doi.org/10.1101/2023.02.21.23286176; this version posted February 24, 2023. The copyright holder for this
preprint (which was not certified by peer review) is the author/funder, who has granted medRxiv a license to display the preprint in
perpetuity.
All rights reserved. No reuse allowed without permission.
In this paper, we describe a unique method of analysing genetic datasets, which extracts additional genetic insights
in a hypothesis-free way to complement those discovered through conventional analysis of GWAS. The results of our
Taxonomy3® analyses have significant value for drug discovery programmes for treating RA, the identified novel
targets (e.g. MEF2B) benefitting from the increased chances of success due to their genetic association with the
disease subject to further experimental validation. The method can be applied to all datasets with well-defined
dichotomous cohorts e.g. case/control, mild/severe, responders/non-responders , and has the added benefit that
other data types (e.g. mRNA expression, clinical data, longitudinal phenotypes) can all be converted into LBFs and co-
analysed with genetic data 15, although this application of the method is currently limited by the availability of
suitable datasets. The method can identify novel genes or pathways of interest for a disease (or other phenotype of
interest) leading to innovative drug discovery programmes with the added confidence of genetic support.
Data Availability:
This study makes use of data generated by the Wellcome Trust Case Control Consortium. A full list of the
investigators who contributed to the generation of the data is available from www.wtccc.org.uk. Funding for the
project was provided by the Wellcome Trust under award 076113. A Accession numbers for data used in this study:
EGAD00000000007 - WTCCC1 project Rheumatoid arthritis (RA) samples, EGAD00010000250 - NBS control samples.
Access to summary data and individual-level genotype data is available by application to the Wellcome Trust Case
Control Consortium Data Access Committee.
17medRxiv preprint doi: https://doi.org/10.1101/2023.02.21.23286176; this version posted February 24, 2023. The copyright holder for this
preprint (which was not certified by peer review) is the author/funder, who has granted medRxiv a license to display the preprint in
perpetuity.
All rights reserved. No reuse allowed without permission.
References:
1. Nelson, M. R. et al. The support of human genetic evidence for approved drug indications. Nature Genetics 47,
856–860 (2015).
2. King, E. A., Davis, J. W. & Degner, J. F. Are drug targets with genetic support twice as likely to be approved?
Revised estimates of the impact of genetic support for drug mechanisms on the probability of drug approval.
PLoS Genet 15, e1008489 (2019).
3. Uffelmann, E. et al. Genome-wide association studies. Nat Rev Methods Primers 1, 1–21 (2021).
4. Cano-Gamez, E. & Trynka, G. From GWAS to Function: Using Functional Genomics to Identify the Mechanisms
Underlying Complex Diseases. Frontiers in Genetics 11, (2020).
5. Manolio, T. A. Genomewide Association Studies and Assessment of the Risk of Disease. New England Journal of
Medicine 363, 166–176 (2010).
6. Mathieson, I. The omnigenic model and polygenic prediction of complex traits. The American Journal of Human
Genetics 108, 1558–1563 (2021).
7. Boyle, E. A., Li, Y. I. & Pritchard, J. K. An Expanded View of Complex Traits: From Polygenic to Omnigenic. Cell
169, 1177–1186 (2017).
8. Liu, X., Li, Y. I. & Pritchard, J. K. Trans Effects on Gene Expression Can Drive Omnigenic Inheritance. Cell 177,
1022-1034.e6 (2019).
9. MacGregor, A. J. et al. Characterizing the quantitative genetic contribution to rheumatoid arthritis using data
from twins. Arthritis Rheum 43, 30–37 (2000).
10. Stahl, E. A. et al. Genome-wide association study meta-analysis identifies seven new rheumatoid arthritis risk
loci. Nat Genet 42, 508–514 (2010).
11. Wellcome Trust Case Control Consortium. Genome-wide association study of 14,000 cases of seven common
diseases and 3,000 shared controls. Nature 447, 661–678 (2007).
12. the RACI consortium et al. Genetics of rheumatoid arthritis contributes to biology and drug discovery. Nature
506, 376–381 (2014).
13. Kullback, S. & Leibler, R. A. On Information and Sufficiency. The Annals of Mathematical Statistics 22, 79–86
(1951).
18medRxiv preprint doi: https://doi.org/10.1101/2023.02.21.23286176; this version posted February 24, 2023. The copyright holder for this
preprint (which was not certified by peer review) is the author/funder, who has granted medRxiv a license to display the preprint in
perpetuity.
All rights reserved. No reuse allowed without permission.
14. Delrieu, O. & Bowman, C. Visualizing gene determinants of disease in drug discovery. Pharmacogenomics 7,
311–329 (2006).
15. Delrieu, O. & Bowman, C. E. On using the correlations of divergences. 9 (2007).
16. Delrieu, O. & Bowman, C. E. Visualisation of gene and pathway determinants of disease. Quantitative Biology,
Shape Analysis, and Wavelets 21–24 (2005).
17. Biernacki, C., Celeux, G., Govaert, G. & Langrognet, F. Model-based Cluster and Discriminant Analysis with the
MIXMOD software. Computational Statistics and Data Analysis 51, 587–600 (2006).
18. Zheng, X. et al. HIBAG—HLA genotype imputation with attribute bagging. Pharmacogenomics J 14, 192–200
(2014).
19. Watanabe, K., Taskesen, E., van Bochoven, A. & Posthuma, D. Functional mapping and annotation of genetic
associations with FUMA. Nat Commun 8, 1826 (2017).
20. Ghoussaini, M. et al. Open Targets Genetics: systematic identification of trait-associated genes using large-scale
genetics and functional genomics. Nucleic Acids Research 49, D1311–D1320 (2021).
21. The 1000 Genomes Project Consortium et al. A global reference for human genetic variation. Nature 526, 68–74
(2015).
22. McLaren, W. et al. The Ensembl Variant Effect Predictor. Genome Biol 17, 122 (2016).
23. Bigaret, S., Hodgett, R. E., Meyer, P., Mironova, T. & Olteanu, A.-L. Supporting the multi-criteria decision aiding
process: R and the MCDA package. EURO Journal on Decision Processes 5, 169–194 (2017).
24. Ochoa, D. et al. Open Targets Platform: supporting systematic drug–target identification and prioritisation.
Nucleic Acids Research 49, D1302–D1310 (2021).
25. del Toro, N. et al. The IntAct database: efficient access to fine-grained molecular interaction data. Nucleic Acids
Research 50, D648–D653 (2022).
26. Hruz, T. et al. Genevestigator V3: A Reference Expression Database for the Meta-Analysis of Transcriptomes.
Advances in Bioinformatics 2008, 1–5 (2008).
27. Langfelder, P. & Horvath, S. WGCNA: an R package for weighted correlation network analysis. BMC
Bioinformatics 9, 559 (2008).
28. Csardi, G. & Nepusz, T. The igraph software package for complex network research. 10 (2006).
19medRxiv preprint doi: https://doi.org/10.1101/2023.02.21.23286176; this version posted February 24, 2023. The copyright holder for this
preprint (which was not certified by peer review) is the author/funder, who has granted medRxiv a license to display the preprint in
perpetuity.
All rights reserved. No reuse allowed without permission.
29. Müllner, D. fastcluster : Fast Hierarchical, Agglomerative Clustering Routines for R and Python. J. Stat. Soft. 53,
(2013).
30. Eixarch, H. et al. Inhibition of the BMP Signaling Pathway Ameliorated Established Clinical Symptoms of
Experimental Autoimmune Encephalomyelitis. Neurotherapeutics 17, 1988–2003 (2020).
31. Lei, C. et al. Association of the CTLA-4 gene with rheumatoid arthritis in Chinese Han population. Eur J Hum
Genet 13, 823–828 (2005).
32. Cutolo, M., Sulli, A., Paolino, S. & Pizzorni, C. CTLA-4 blockade in the treatment of rheumatoid arthritis: an
update. Expert Rev Clin Immunol 12, 417–425 (2016).
33. Jayathilaka, N. et al. Inhibition of the function of class IIa HDACs by blocking their interaction with MEF2. Nucleic
Acids Res 40, 5378–5388 (2012).
34. Serrano-Albarrás, A., Cirera-Rocosa, S., Sastre, D., Estadella, I. & Felipe, A. Fighting rheumatoid arthritis: Kv1.3 as
a therapeutic target. Biochemical Pharmacology 165, 214–220 (2019).
35. Tong, X. et al. Merimepodib, an IMPDH inhibitor, suppresses replication of Zika virus and other emerging viral
pathogens. Antiviral Res 149, 34–40 (2018).
36. Ratcliffe, A. J. Inosine 5’-monophosphate dehydrogenase inhibitors for the treatment of autoimmune diseases.
Curr Opin Drug Discov Devel 9, 595–605 (2006).
37. Weissler, A. M. & Bailey, K. R. A Critique on Contemporary Reporting of Likelihood Ratios in Test Power Analysis.
Mayo Clinic Proceedings 79, 1317–1318 (2004).
38. Hart, T., Brown, K. R., Sircoulomb, F., Rottapel, R. & Moffat, J. Measuring error rates in genomic perturbation
screens: gold standards for human functional genomics. Molecular Systems Biology 10, 733 (2014).
39. Solé, L. et al. The C-terminal domain of Kv1.3 regulates functional interactions with the KCNE4 subunit. Journal
of Cell Science 129, 4265–4277 (2016).
40. Solé, L. et al. KCNE4 suppresses Kv1.3 currents by modulating trafficking, surface expression and channel gating.
Journal of Cell Science 122, 3738–3748 (2009).
41. Brennan, F. M. et al. Resting CD4+effector memory T cells are precursors of bystander-activated effectors: a
surrogate model of rheumatoid arthritis synovial T-cell function. Arthritis Res Ther 10, R36 (2008).
20medRxiv preprint doi: https://doi.org/10.1101/2023.02.21.23286176; this version posted February 24, 2023. The copyright holder for this
preprint (which was not certified by peer review) is the author/funder, who has granted medRxiv a license to display the preprint in
perpetuity.
All rights reserved. No reuse allowed without permission.
42. Matsuki, F. et al. CD45RA−Foxp3low non-regulatory T cells in the CCR7−CD45RA−CD27+CD28+ effector memory
subset are increased in synovial fluid from patients with rheumatoid arthritis. Cellular Immunology 290, 96–101
(2014).
43. Toh, M.-L. & Miossec, P. The role of T cells in rheumatoid arthritis: new subsets and new targets. Current Opinion
in Rheumatology 19, 284–288 (2007).
44. Azam, P., Sankaranarayanan, A., Homerick, D., Griffey, S. & Wulff, H. Targeting Effector Memory T Cells with the
Small Molecule Kv1.3 Blocker PAP-1 Suppresses Allergic Contact Dermatitis. Journal of Investigative Dermatology
127, 1419–1429 (2007).
45. Beeton, C. et al. Targeting Effector Memory T Cells with a Selective Peptide Inhibitor of Kv1.3 Channels for
Therapy of Autoimmune Diseases. Mol Pharmacol 67, 1369–1381 (2005).
46. Wulff, H. et al. The voltage-gated Kv1.3 K(+) channel in effector memory T cells as new target for MS. J Clin
Invest 111, 1703–1713 (2003).
47. Bandukwala, H. S. & Rao, A. ‘Nurr’ishing Treg cells: Nr4a transcription factors control Foxp3 expression. Nat
Immunol 14, 201–203 (2013).
48. Bending, D. & Ono, M. From stability to dynamics: understanding molecular mechanisms of regulatory T cells
through Foxp3 transcriptional dynamics. Clinical & Experimental Immunology 197, 14–23 (2019).
49. Won, H. Y. & Hwang, E. S. Transcriptional modulation of regulatory T cell development by novel regulators
NR4As. Arch. Pharm. Res. 39, 1530–1536 (2016).
50. Chavele, K.-M. & Ehrenstein, M. R. Regulatory T-cells in systemic lupus erythematosus and rheumatoid arthritis.
FEBS Letters 585, 3603–3610 (2011).
51. Ehrenstein, M. R. et al. Compromised Function of Regulatory T Cells in Rheumatoid Arthritis and Reversal by
Anti-TNFα Therapy. Journal of Experimental Medicine 200, 277–285 (2004).
52. Leipe, J., Skapenko, A., Lipsky, P. E. & Schulze-Koops, H. Regulatory T cells in rheumatoid arthritis. Arthritis
Research & Therapy 7, 93 (2005).
53. Esensten, J. H., Wofsy, D. & Bluestone, J. A. Regulatory T cells as therapeutic targets in rheumatoid arthritis. Nat
Rev Rheumatol 5, 560–565 (2009).
21You can also read


