A Major Highway Acts to Genetically Structure a Sugar Glider (Petaurus Breviceps) Population
←
→
Page content transcription
If your browser does not render page correctly, please read the page content below
A Major Highway Acts to Genetically Structure a Sugar Glider
(Petaurus Breviceps) Population
Monica Knipler ( mk972@uowmail.edu.au )
University of Wollongong https://orcid.org/0000-0002-7489-9552
Mark Dowton
University of Wollongong
Katarina Mikac
University of Wollongong
Research Article
Keywords: Petaurus breviceps, population genetics, habitat fragmentation, conservation, barriers
Posted Date: June 9th, 2021
DOI: https://doi.org/10.21203/rs.3.rs-502078/v1
License: This work is licensed under a Creative Commons Attribution 4.0 International License. Read Full License
Page 1/18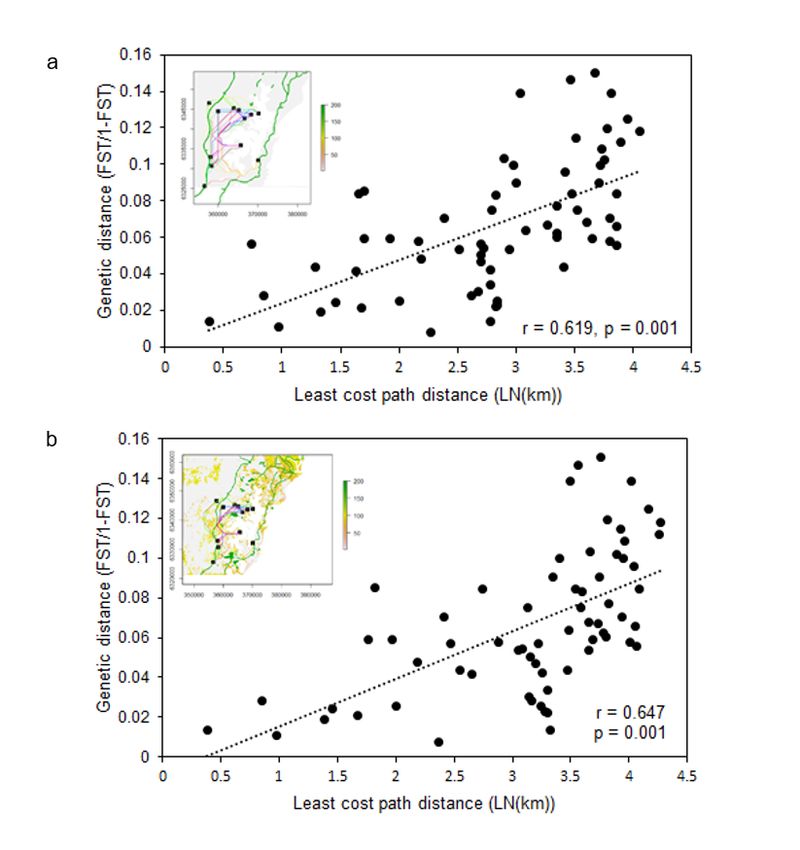
Abstract
Arboreal gliders are vulnerable to habitat fragmentation and to barriers that extend their glide distance threshold. Habitat
fragmentation through deforestation can cause population isolation and genetic drift in gliding mammals which in turn
can result in a loss of genetic diversity and population long-term persistence. This study utilised next generation
sequencing technology to call 11, 292 genome-wide SNPs from 90 adult sugar gliders (Petaurus breviceps). Samples were
collected from 12 locations in the Lake Macquarie Local Government Area (New South Wales), with two of these locations
west of the Pacific Motorway, a potential major barrier to their dispersal. Overall, Lake Macquarie sugar gliders appeared to
have high levels of gene flow and little genetic differentiation, however spatial least cost path analyses identified the
Pacific Motorway as a barrier to their dispersal. This Motorway is still relatively new (< 40 years old), so man-made
crossing structures should be erected as a management priority to mitigate any long-term effects of population isolation
by assisting in the dispersal and gene flow of the species. This study provides further insight into the sugar glider after it
was classed as three separate species in 2020 and could potentially be used as a model for its threatened congener in the
area, the squirrel glider (Petaurus norfolcensis).

Introduction
Eucalypt forests have experienced the greatest rate of deforestation in Australia, with 80% of the remaining forests
modified by human activity (Bradshaw 2012). This habitat loss and fragmentation is a known major threat to arboreal
marsupials that are dependent on forest food resources and require tree hollows for nesting, shelter and predator
avoidance (Braithwaite et al. 1988; Gibbons and Lindenmayer 2000; Lindenmayer 2002). Also, arboreal marsupials have
adaptations for climbing and gliding between trees that leave them slow and vulnerable to predators and vehicles when
forced to cross their habitat on the ground (Bassarova et al. 2009; Warburton et al. 2012; Rupert et al. 2014). Because of
this, there is a real and ongoing risk that populations may become isolated due to habitat fragmentation, resulting in
reduced gene flow and genetic diversity (Frankham et al. 2002). This presents a problem for the long-term viability and
persistence of populations, as genetic diversity facilitates their ability to adapt to stochastic changes in their environment
(Mahoney and Springer 2009).

Conservation genetic research has examined the effect of straight-line distance on genetic distance of populations, with a
non-significant result indicative of features in the landscape that may present barriers or challenges to gene flow and
dispersal (Whitlock and Mccauley 1999). Over time, researchers have incorporated spatial data into Mantel tests to
examine the effect of least cost path on genetic distances of populations (Wang et al. 2009; Milanesi et al. 2016). This
concept of “landscape genetics” has proved extremely useful for pinpointing barriers to gene flow such as roads (Keller
and Largiadèr 2003) and biogeographic barriers (Pérez-Espona et al. 2008; Wei et al. 2012). Additionally, least cost path
analyses have identified corridors for priority conservation when paired with genetic data (Wang et al. 2009; Etherington et
al. 2014). When investigating the effect of habitat fragmentation on population genetics, it is essential to combine spatial
and genetic data to gain a better understanding of genetic structure (Storfer et al. 2007).

While studies have used microsatellites to investigate the effect of Australian habitat fragmentation on gliding mammals
in the past (Pavlova et al. 2010; Taylor et al. 2011; Goldingay et al. 2013; Malekian et al. 2015), researchers are yet to utilise
the power of next generation sequencing and genome-wide single nucleotide polymorphisms (SNPs). SNPs are single base
pair nucleotide changes along the genome that vary for individuals, representing the most common form of sequence
variation (Brumfield et al. 2003). Thanks to advances in next generation sequencing, thousands of bi-allelic, co-dominant
SNP markers can be produced (Kumar et al. 2012). SNPs have wider genome coverage than microsatellites, making them
more precise and informative when answering questions regarding genetic diversity and structure in non-model organisms
(Liu et al. 2005). As a result, SNPs have been successfully used for a vast array of Australian mammal studies in recent
years (Kjeldsen et al. 2016; White et al. 2018; Schultz et al. 2018; Kjeldsen et al. 2019; Martin et al. 2019; Wright et al.
2019).
                                                            Page 2/18
Despite having similar life histories and being congeners, sugar gliders (Petaurus breviceps) are currently listed as
common, while squirrel gliders (Petaurus norfolcensis) are listed as threatened in New South Wales (Threatened Species
Conservation Act 1995). It is possible that these congeners may respond to habitat fragmentation differently, warranting
further investigation into the effects of urbanisation on them. On the other hand, if similar trends are observed, then sugar
glider populations could be used as a ‘model’ for its threatened congener. While they do not often share habitat, certain
locations in their distribution present a unique opportunity to examine this. One such location is in central New South
Wales (ie. Lake Macquarie Local Government Area (LGA)) where the two species occur in high densities with some overlap
(Smith 2002; Smith and Murray 2003; Knipler unpublished raw data).
Although sugar gliders are listed as a common speacies, threats to populations from ongoing urbanisation and land
clearing remains a concern for their ongoing survival. In addition to this, sugar gliders were recently divided into three
separate species: the sugar glider (Petaurus breviceps, found in Lake Macquarie and east of the Great Dividing Range),
krefft’s glider (Petaurus notatus, found in eastern Australia, though west of the Great Dividing Range and in Tasmania
where it is an introduced species) and savanna glider (Petaurusariel, found in northern Australia) (Cremona et al. 2020).
Because of this division, the conservation status of the species’ perhaps need revision since there has likely been an
overestimation of its range and effective population size by past studies that considered these as a single species.
Cremona et al. (2020) call for targeted research on the three seperate species to better understand their ecology and
identify any areas of conservation concern. Here we use genome-wide SNP markers to investigate the effect of habitat
fragmentation on sugar glider (P. breviceps) population genetics in the Lake Macquarie LGA. We report on their current
genetic diversity and structure and thus provide the first baseline data available on their population genetics. Finally, we
investigate barriers to their historical and ongoing dispersal and in doing so hypothesised that biogeographical barriers
and habitat fragmentation would reduce genetic diversity and influence population genetic structure. Least cost path
analyses were used to examine this in detail and subsequently direct conservation measures with the intended outcome of
contributing to data driven conservation outcomes for sugar gliders.
Materials And Methods
Study area
Sugar gliders require tree hollows for sleeping and nesting and primarily rely on the sap, gum and nectar of eucalypt,
acacia, and banksia species (Smith 1982; Lindenmayer 2002). Together the Lake Macquarie LGA and neighbouring
Newcastle LGA contains 47, 100 ha of native forest (55% of total area), the majority of which is comprised of medium
open eucalypt forest that is suitable for glider species (Department of Agriculture Water and Environment 2021). Due to the
eucalypt, acacia and banksia habitat spread across the landscape, Lake Macquarie LGA holds the most abundant squirrel
glider population in New South Wales (NSW) (Smith 2002) and similarly holds a large population of sugar gliders (Smith
and Murray 2003). This location is recognized as being the most genetically diverse for squirrel gliders in Australia, and is
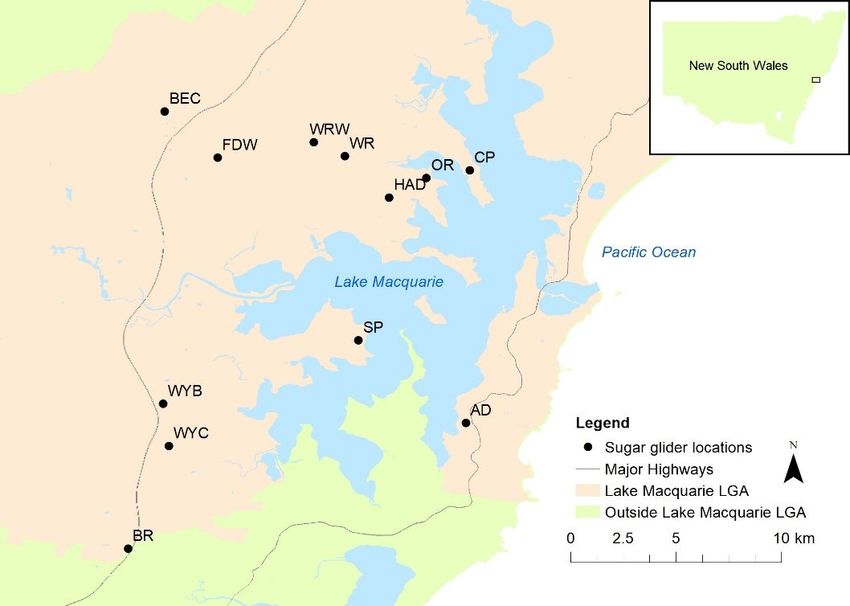
located 130 km north of Sydney, NSW (Pavlova et al. 2010) (Fig. 1). Additionally, Lake Macquarie LGA contains the largest
coastal saltwater lake in Australia, (120 km2) a potential biogeographical barrier to glider gene flow.
Live trapping and DNA collection
Live trapping was conducted at 32 sites from 2017 to 2020, with 113 sugar glider individuals caught across 12 of the sites
(Fig. 1). A combination of Mawbey traps, Elliot B traps, cage traps and Winning and King pipe traps were used to live trap
gliders (Mawbey 1989; Quin 1995; Winning and King 2008). The Winning and King pipe traps were secured one metre from
the base of the tree and the bottom was filled with leaves for bedding and a bait ball made from a mixture of peanut butter,
honey and oats (Winning and King 2008). The other traps were instead secured to wooden planks that were drilled into tree
trunks two metres above the ground. Each of these trap types contained a mix of leaves for bedding and a bait ball. A 1:4
ratio of honey water was then sprayed up and down the tree to a height of six metres as well as around the entrance to
Page 3/18each trap as an olfactory attractant (Sharpe and Goldingay 2007). Each site was subject to at least one week of live
trapping using 12 traps per site (two rows of six with each trap spaced 50 meters apart), and further focus was given to
locations that required a larger sample size for intended genetic analyses. Trapping ceased when no new individuals were
detected after one week or when a previously marked individual was recaught three times within a week.
Traps were checked each morning at sunrise. When a sugar glider was caught, body measurements were recorded. These
measurements included weight, tail length, right hind foot length, head width, head length and sex to monitor the body
condition of any recaptured animals. Individuals were given a unique identifying number in the form of a metal ear tag or a
unique ear marking combination. Before being released, their DNA was collected in the form of an ear biopsy. A 2 mm
metal ear punch (Able Scientific, Australia) was sprayed with 70% ethanol and flamed for sterilization. Once cooled, a
small clipping was taken from the outside edge of the ear and stored in sterilized vials containing 95% ethanol. These were
kept at – 20°C prior to DNA extraction. The processing of each sugar glider was limited to five-minutes to avoid
unnecessary disturbance and following approved animal ethics protocol (AE15/11 and AE19/02). When the processing of
an individual was complete, the glider was safely released onto the tree where it was caught.
SNP genotyping and filtering
Genomic DNA was extracted from ear tissue using DNeasy Blood and Tissue Kit (Qiagen, Hilden, Germany) as per the
manufacturer’s instructions. A set of 96 samples were selected for analysis after DNA concentration and purity were
assessed using agarose gel electrophoresis and a NanoDrop 2000 Spectrophotometer (Thermo Scientific). These samples
were plated and transported to Diversity Arrays Technology (DArTseq), University of Canberra, Australia, for concentration
and sequencing (Kilian et al. 2012). DArTseq technology has effectively assisted with the research of Australian
marsupials in recent years, including koalas (Phascolarctos cinereus) (Schultz et al. 2018; Kjeldsen et al. 2019), bare-nosed
wombats (Vombatus ursinus) (Martin et al. 2019) and Tasmanian devils (Sarcophilus harrisii) (Wright et al. 2019).
DArTseq utilises next generation sequencing and genome complexity reduction methods to call bi-allelic, codominant SNP
markers (Kilian et al. 2012). For this species, a double digest was conducted with PstI and SphI restriction enzymes. The
PstI overhang was compatible with the barcode adapter while the SphI overhang was compatible with the reverse adaptor
and the flowcell attachment region (Elshire et al. 2011; Kilian et al. 2012). The resulting DNA fragments were then amplified
with PCR and sequenced on Illumina Hiseq2500. Reads were cleaned, barcodes were removed, and sequences were
aligned to the Leadbeater’s possum reference genome (Gymnobelideus leadbeateri “, GCA_011680675.1 LBP_v1”) using
DArTseq analytical pipelines. Once the process was complete, genome-wide SNPs were retained with a minimum sequence
identity of 70%. For additional information regarding the DArTseq process, refer to Kilian et al. 2012.
Final filtering was conducted in R 4.0.2 (R Core Team 2015) using the dartR package (Gruber et al. 2018). SNPs were
filtered on call rate (0.95 threshold) and hamming distance (0.2 threshold). Monomorphic loci and linked loci were
removed, as well as those that significantly deviated from Hardy-Weinberg Equilibrium (p < 0.05).
Population structure and genetic diversity analyses
All analyses were undertaken in R 4.0.2 (R Core Team 2020) unless otherwise stated. For sampling locations with two or
more individuals, average observed (Hobs) and expected (Hex) heterozygosity was calculated at each SNP using the
package hierfstat (Goudet 2005). These values were used to assess the level of inbreeding (FIS = (Hex-Hobs)/Hex) at
different geographic locations. Additionally, F-statistics in the form of average FIS and FST were generated for the overall
region.
A Principal Component Analysis (PCOA) ordination enabled visualisation of genetic differentiation between individuals
and between sampling locations (Gower 1966). This was generated with the gl.pcoa.plot function in dartR (Gruber et al.
2018). Similarly, Pairwise FST and an Analysis of Molecular Variance (AMOVA) were used to examine population structure
Page 4/18and population differentiation. Pairwise FST and the corresponding p values were calculated between the 12 sampling
locations using the gl.fst.pop function in the R package dartR 1.1.11. 100 bootstraps were performed across loci to
generate the p-values. The AMOVA was conducted through the R package poppr 2.9.0 using 9,999 permutations (Zhian
Kamvar 2021).
A STRUCTURE analysis examined individual-based structure and admixture. The program STRUCTURE 2.3.4 was
employed to determine the appropriate number of clusters (K) and to visualise the ancestry proportions per individual
(Pritchard et al. 2000; Pritchard et al. 2003). The program tested genetic clusters K = 1 to 15 with 8 repeats of K. Each run
had a 10,000-length burn-in period followed by 10,000 Monte Carlo Markov Chain replications. The results were then
uploaded to Structure Harvester (Web v0.6.94) and the most probable K was chosen based on the Evanno method and the
largest Delta K value (Evanno et al. 2005; Earl and VonHoldt 2012). Individuals with q values > 0.8 were considered pure to
a cluster while individuals with q values < 0.8 were considered admixed.
Isolation by distance and least cost path analyses
An isolation by distance (IBD) Mantel test with 9, 999 permutations assessed whether there was a relationship between
geographic distance and genetic distance of populations. This analysis took the log of straight-line distances between
populations using the gl.ibd function in the dartR package and compared them to genetic distances in the form of pairwise
FST (that is, FST/(1-FST)).
Additionally, three least cost path analyses were performed using the gl.genleastcost function in dartR to account for
habitat suitability and barriers. All rasters (friction matrixes) were created in ARCMAP 10.7.1. The first friction matrix
accounted for biogeographical barriers by assigning “NoData” values to the ocean and lake from a land use spatial layer
(NSW Government 2007), indicating a complete barrier to dispersal. Everything else was assigned a cell value of 1 to allow
easy dispersal. This matrix was used in a Mantel test and will be hereon referred to as Mantel test B (biogeographical
barriers).
The second friction matrix built on Mantel test B by assigning a cell value of 200 to four-lane highways obtained from the
NSW Department of Industry, indicating unsuitable habitat and high effort for dispersal. This was used in a Mantel test
and given the name Mantel test BH (biogeographical barriers and highways). The third and final friction matrix was
created with cells ranging from optimal habitat (1) to unsuitable habitat (200) and given the name BHH (biographical
barriers, highways and habitat). First, Plant Community Type (PCT) spatial layers were taken from Bell et al. (2016) and
Eco Logical Australia Pty Ltd (2003) and vegetation types were divided into five categories with unique cell cost values
based on the habitat and dietary preferences of sugar gliders (Smith 1982; Smith and Murray 2003). These included highly
suitable vegetation (e.g. Eucalyptus haemastoma or racemose, Angophora costata, understorey of Banksia spp and
Xanthorrhoea spp, cell cost value 1), suitable vegetation (10), moderately suitable vegetation (20), moderately unsuitable
vegetation (75) and unsuitable vegetation (e.g. saltmarsh, sedgeland, cell cost value 100). Next, land use spatial layers
were taken from the NSW Government (2007) and divided into the following classes and cell cost values: Urban residential
(80), industrial (100), roads (100), railways (80), rural residential without agriculture (70), rural residential with agriculture
(100), native/exotic pasture matrix (100), grazing irrigated modified pastures (100), irrigated turf farming (100),
mines/quarries and large cleared areas (200) and the Lake and Ocean (‘NoData’, complete biogeographical barrier to
dispersal). Highly suitable vegetation was given a 25-meter buffer so that two patches either side of a barrier (e.g.,
road/river) would intersect with a glide distance threshold of 50 meters, indicating crossing potential. Major highways were
overlayed with a value of 200 with the assumption that sugar gliders would avoid busy four-lane highways (Pacific
Motorway, Pacific Highway).
New geographic distances were calculated using the three friction matrices (cell factor = 15, function = mean) and the
least cost paths between spatial coordinates of individuals. The new pairwise geographic distances were then tested for
Page 5/18correlation with genetic distances and number of neighbours = 8. The results from the four spatial analyses (IBD and three
least cost paths) were compared to find the best fit, as recommended by Milanesi et al. (2016).
Results
SNP loci summary statistics
Many gliders were recaught at the same site they were originally trapped, including one female sugar glider that was
trapped 50 meters from where it was caught as a juvenile three years prior (glider ear tag#041: 1st year 85 grams, 3rd year
130 grams). None were trapped at a different site sampled. This suggests that female adult gliders demonstrate site
philopatry. Additionally, a male sugar glider was trapped on both sides of a 30-meter powerline easement during one week
of live trapping, thus indicating crossing structure potential of wooden power poles and powerline easements.
25, 241 genome-wide SNPs were identified through DArTseq’s analytical pipeline. Three sugar glider samples were
excluded during the DArTseq process and two sugar glider samples were excluded during the final filtering stage. A sixth
sample was also excluded as it was identified as a squirrel glider/sugar glider hybrid. In total, 11, 292 SNPs were retained
from 90 sugar glider individuals sampled from 12 different sites spanning 20 km of the landscape (Table 1). The 11, 292
filtered genome-wide SNPs were used to undertake population genetics statistics for the sugar gliders sampled.
Population genetic diversity and structure estimates
To gain insight into the genetic diversity of sugar gliders, observed and expected heterozygosity were compared. Observed
heterozygosity was lower than expected heterozygosity for all locations except BEC. This was reflected in the FIS values,
with all sampling locations displaying values from 0.017 to 0.119, except for BEC and CP which had values close to 0
(Table 1). Average overall FST was 0.0566 and average FIS was 0.050.
Next, PCoA analyses were conducted to visualise genetic differentiation between individuals and between sampling
locations. Population differentiation was evident (yet minimal) in the PCoA plots, with populations separating out on
different axes. The cumulative percentage of genetic variation explained by the first eight axes was 20.4%, with axis 1
accounting for only 3.7% of the variation (Fig. 2). The clearest patterns noted in the PCoA plots included the separation of
sampling location CP on the first axis, OR on the second axis, AD on the fourth axis, and BEC on the sixth.
The AMOVA examined population structure and population differentiation and showed that a high proportion of the
genetic variation was contained within sugar glider samples (89.2%) while only 5.4% of the genetic variation was observed
between populations and 5.4% of the genetic variation was observed between samples within populations (Table 2).
Population pairwise FST values allowed a clear comparison of populations to detect differentiation (Table 3). Values were
mostly all significant except for the comparisons between locations HAD and SP, and locations WYC and SP. Significant
pairwise FST values ranged from low genetic differentiation (0.011, HAD vs WR) to moderate genetic differentiation (0.131,
SP vs BR). The pairwise FST values indicated genetic similarity between populations within a large bushland patch in a 5
km radius (WR, WRW and HAD) and moderately high genetic differentiation when comparing the locations on the western
side of the pacific motorway (BEC and BR) with most of the sites on the eastern side (FST average of west compared to
east = 0.083). Additionally, CP which is located on a peninsula, had moderate genetic differentiation from most other sites
sampled (Table 3).
STRUCTURE
The Structure Harvester results for individual-based structure and admixture showed that ΔK had the highest value at K = 5
(Fig. 3). Therefore, it was understood that the sugar glider samples collected from within the Lake Macquarie LGA were
Page 6/18derived from five ancestral genetic clusters. When K = 5, unique, pure clusters appeared in populations CP and OR in the
form of cluster three and cluster five respectively (Fig. 4).
Cluster admixture was present in all sampling locations except for population AD (Fig. 4). In population AD, 100% of the
individuals were considered pure to cluster 1. In BEC, 75% of the individuals were pure to cluster 2. In CP, 70% of the
individuals were pure to cluster 3. In FDW, 27% of the individuals were pure to cluster 4. In OR, 11% of the individuals were
pure to cluster 1, 22% were pure to cluster 4 and 22% were pure to cluster 5. In WR, 27% of the individuals were pure to
cluster 2. And finally, 89% and 55% of individuals were pure to cluster 1 in WYB and WYC consecutively. The rest of the
individuals (including all of those in populations BR, HD, SP and WRW) were admixed (Fig. 4).
Results of least cost path analyses
The IBD analysis produced a significant result, with a correlation between genetic distance and euclidian geographic
distance (IBD Mantel’s r = 0.389, p = 0.011). The proportion of genetic variation explained by geographic distance did not
increase when the lake was included as a biogeographical barrier (Mantel test “B”, Mantel’s r = 0.334, p = 0.098) , however
it did significantly increase once highways were included alongside the biogeographical barriers (Mantel test “BH”, Mantel’s
r = 0.619, p = 0.001) (Fig. 5a). When habitat was incoroporated, the Mantel r statistic only slightly increased (Mantel test
“BHH”, Mantel’s r = 0.647, p = 0.001) (Fig. 5b), indicating that the highways explained the most genetic variation out of the
three factors examined: biogeographical barriers, highways and habitat (Table 4).
Discussion
Habitat fragmentation can inhibit gene flow of arboreal gliders, particularly when gaps exceed their glide distance
threshold and contain dangers to their survival in the form of high-speed vehicles or large bodies of water. In the current
study, genome-wide SNPs proved useful in identifying fine-scale genetic structure and population differentiation of the
sugar glider in the Lake Macquarie LGA.
Locations FDW, HAD, WR and WRW had little to no differentiation from each other and had expansive remnant bushland
between them. On the other hand, location CP appeared moderately differentiated from other locations in the pairwise FST
and the STRUCTURE analysis results. One plausible explanation is biogeographic isolation since CP is on a peninsula,
however the lake did not significantly explain genetic variation in the least cost path analysis. Overall, subtle genetic
variation was detected in the PCoA and the AMOVA. This combined with the initial significant isolation-by-distance result
suggests moderately high connectivity and random mating, and little structure in the overall sugar glider population. This
contrasts with research by Goldingay et al. (2013) who found no isolation-by-distance effect for squirrel glider populations
in Mackay and Brisbane. They assumed this was due to heavy fragmentation and genetic drift. The difference in results
here could be because Lake Macquarie has retained a greater proportion of vegetation in the urban matrix (promoting
dispersal), or perhaps sugar gliders are less susceptible to urbanisation (Caryl et al. 2013). Population genetic analysis of
the Lake Macquarie squirrel gliders could put this speculation to rest (Pavlova et al. 2010).
Despite the low genetic structure, pairwise FST and the least cost path analyses found a significant highway effect on the
genetic distances of populations. In this case, populations BEC and BR West of the Pacific Motorway were differentiated
from populations to the East. The Pacific Motorway was completed in 1987 and 1988 in Lake Macquarie (Stubbs 2015).
Annual average daily traffic is between 40, 000 to 50, 000 vehicles a day (north and south bound combined) (Roads and
Maritime Services 2018), generating edge effects from noise and light pollution (Pocock and Lawrence 2005). Furthermore,
the highway exceeds the glide distance threshold of sugar gliders (70 m) despite containing trees in some parts of the
median strip. These trees are not currently mature (ie. tall) enough to support the crossing of sugar gliders that require an
average glide angle of 29.69° (Jackson 2000).
Page 7/18In Lake Macquarie LGA the Pacific Motorway has been a dispersal barrier for the last 30 – 35 years, impeding gene flow for
approximately ten generations of sugar gliders. This is consistent with microsatellite research by Goldingay et al. (2013)
who found genetic differentiation in populations of squirrel gliders within 30 years of landscape change in Queensland. It
is important to catch this effect early on (as this study has done) to mitigate any long term effects on the genetic structure
and viability of populations. The installation of rope bridges and glider poles would act as an asset to conservation
management of sugar and squirrel gliders, as well as conserving any trees in the median strip to allow them to reach an
optimal height for sugar gliders to successfully utilise them as stepping stones. Taylor and Rohweder (2013) observed
sugar gliders using mature trees to cross a median strip when they were tall enough to support a successful glide (tall
enough to support average glide angle of 29.69°, Jackson 2000). Additionally, rope bridges and glider poles have
successfully encouraged squirrel gliders and sugar gliders to cross highways across the east coast of Australia. These
species were observed using the man-made crossing structures through radio-tracking, hair-trapping and camera trapping
(Ball and Goldingay 2008; Taylor and Goldingay 2012; Soanes et al. 2015; Soanes et al. 2018; Goldingay et al. 2019).
Research in Port Macquarie concluded that glider poles were preferred over rope bridges for squirrel gliders and sugar
gliders, while rope bridges were utilised by non-gliding mammals (Goldingay et al. 2019). With this in mind, Lake
Macquarie should prioritise glider poles or install both options along the Pacific Motorway to facilitate dispersal of the
species across the landscape and thus mitigate the effects of genetic drift. Future research should focus on the western
side of the Pacific Motorway to identify additional locations where sugar gliders are present. This would assist with
identifying optimal locations for man-made crossing structures and subsequently improve genetic connectivity of
populations.
While this study has been particularly insightful into the sugar glider population of Lake Macquarie LGA, future study
should examine the threatened squirrel glider population in the LGA to see if they show similar responses to fragmentation.
As a common species, sugar gliders may occur in higher abundance and therefore have a greater effective population size.
Genetic structure is not as pronounced in larger populations, but can have strong effects in small populations (commonly
the case with threatened species) (Coleman et al. 2018).
In conclusion, this research was particularly insightful due to the recent division of the once sugar gliders into three glider
species (sugar glider, krefft’s glider and savanna glider) (Cremona et al. 2020). The results of this study suggests that the
overall sugar glider population in Lake Macquarie LGA has appropriate levels of random mating with high levels of gene
flow, however there is evidence that the relatively recent installation of the Pacific Motorway (30 – 35 years ago) is starting
to impose genetic structure on either side of the road. This can be mitigated with the installation of man-made crossing
structures such as glider poles. Overall, the Lake Macquarie LGA sugar glider population has high levels of gene flow with
potential for recovery in the area of concern (the Pacific Motorway).
Declarations
Funding: University of Wollongong Centre for Sustainable Ecosystem Solutions, Research Student Support Grant (2020).
Conflicts of interest/Competing interests: The authors declare no competing interest.
Availability of data and material: DArTseq data is available from the authors upon request.
Code availability:Not applicable.
Ethics approval:Sugar glider genetic samples were collected under University of Wollongong Animal Ethics permit AE15/11
and AE19/02.
Consent to participate:Not applicable.
Consent for publication:All authors consent to the submission of this article to Conservation Genetics.
Page 8/18Acknowledgments
We would like to thank the University of Wollongong’s Centre for Sustainable Ecosystem Solutions for funding this project
through their research student support grant. We would also like to extend thanks to Lake Macquarie City Council and
National Parks & Wildlife Service for their guidance and assistance in accessing sites. And finally, a big thank you to all our
volunteers for their passion and dedication in the field.
References
1. Ball TM, Goldingay RL (2008) Can wooden poles be used to reconnect habitat for a gliding mammal? Landscape
Urban Planning 87:140–146. doi:10.1016/j.landurbplan.2008.05.007
2. Bassarova M, Janis CM, Archer M (2009) The Calcaneum—On the Heels of Marsupial Locomotion. Journal of
Mammalian Evolution 16:1–23. doi:10.1007/s10914-008-9093-7
3. Bell S, Driscoll C, Survey EF (2016) Volume 1: Vegetation Mapping Report, Lake Macquarie Local Government Area
Stages 1–6
4. Bradshaw CJA (2012) Little left to lose: Deforestation and forest degradation in Australia since European colonization.
Journal of Plant Ecology 5:109–120. doi:10.1093/jpe/rtr038
5. Braithwaite LW, Binns DL, Nowla RD (1988) The distribution of arboreal marsupials in relation to eucalypt forest types
in the eden (n.s.w.) woodchip concession area. Wildlife Research 15:363–373. doi:10.1071/WR9880363
6. Brumfield RT, Beerli P, Nickerson DA, Edwards SV (2003) The utility of single nucleotide polymorphisms in inferences
of population history. Trends Ecol Evol 18:249–256. doi:10.1016/S0169-5347(03)00018-1
7. Caryl FM, Thomson K, Van der Ree R (2013) Permeability of the urban matrix to arboreal gliding mammals: Sugar
gliders in Melbourne, Australia. Austral Ecol 38:609–616. doi:10.1111/aec.12006
8. Coleman RA, Gauffre B, Pavlova A, Beheregaray LB, Kearns J, Lyon J, Sasaki M, Leblois R, Sgro C, Sunnucks P (2018)
Artificial barriers prevent genetic recovery of small isolated populations of a low-mobility freshwater fish. Heredity
120:515–532. doi:10.1038/s41437-017-0008-3
9. Cremona T, Baker AM, Cooper SJB, Montague-Drake R, Stobo-Wilson AM, Carthew SM (2020) Integrative taxonomic
investigation of Petaurus breviceps (Marsupialia: Petauridae) reveals three distinct species. Zoological Journal of the
Linnean Society 191:503–527. doi:10.1093/zoolinnean/zlaa060
10. Department of Agriculture Water and Environment (2021) About my region – Newcastle and Lake Macquarie New
South Wales - Department of Agriculture. Available at: https://www.agriculture.gov.au/abares/research-
topics/aboutmyregion/nsw-newcastle#forestry-sector [accessed 8 March 2021]
11. Earl DA, VonHoldt BM (2012) STRUCTURE HARVESTER: A website and program for visualizing STRUCTURE output
and implementing the Evanno method. Conservation Genetics Resources 4:359–361. doi:10.1007/s12686-011-9548-7
12. Eco Logical Australia Pty Ltd (2003) Lower Hunter & Central Coast Regional Biodiversity Conservation Strategy
Technical Report 2003 Digital Aerial Photo Interpretation & Updated Extant Vegetation Community Map
13. Elshire RJ, Glaubitz JC, Sun Q, Poland JA, Kawamoto K, Buckler ES, Mitchell SE (2011) A Robust, Simple Genotyping-
by-Sequencing (GBS) Approach for High Diversity Species Ed L. Orban. PLoS ONE 6:e19379.
doi:10.1371/journal.pone.0019379
14. Etherington TR, Perry GLW, Cowan PE, Clout MN (2014) Quantifying the Direct Transfer Costs of Common Brushtail
Possum Dispersal using Least-Cost Modelling: A Combined Cost-Surface and Accumulated-Cost Dispersal Kernel
Approach Ed D. A. Driscoll. PLoS ONE 9:e88293. doi:10.1371/journal.pone.0088293
15. Evanno G, Regnaut S, Goudet J (2005) Detecting the number of clusters of individuals using the software structure: a
simulation study. Mol Ecol 14:2611–2620. doi:10.1111/j.1365-294X.2005.02553.x
Page 9/1816. Frankham R, Ballou JD, Briscoe DA (2002) ‘Introduction to Conservation Genetics’. (Cambridge University Press:
Cambridge.) doi:10.1016/j.foreco.2003.12.001
17. Gibbons P, Lindenmayer D (2000) ‘Tree Hollows and Wildlife Conservation in Australia’. CSIRO publishing:
Collingwood.)
18. Goldingay RL, Harrisson KA, Taylor AC, Ball TM, Sharpe DJ, Taylor BD (2013) Fine-scale genetic response to landscape
change in a gliding mammal. PLoS ONE 8:1–10. doi:10.1371/journal.pone.0080383
19. Goldingay RL, Taylor BD, Parkyn JL (2019) Use of tall wooden poles by four species of gliding mammal provides
further proof of concept for habitat restoration. Australian Mammalogy 41:255. doi:10.1071/AM18008
20. Goudet J (2005) HIERFSTAT, a package for R to compute and test hierarchical F-statistics. Mol Ecol Notes 5:184–186.
doi:10.1111/j.1471-8286.2004.00828.x
21. Gower JC (1966) Some distance properties of latent root and vector methods used in multivariate analysis. Biometrika
53:325–338. doi:10.1093/biomet/53.3-4.325
22. Gruber B, Unmack PJ, Berry OF, Georges A (2018) dartr: An r package to facilitate analysis of SNP data generated from
reduced representation genome sequencing. Molecular Ecology Resources 18:691–699. doi:10.1111/1755-
0998.12745
23. Jackson SM (2000) Glide angle in the genus Petaurus and a review of gliding in mammals. Mammal Review 30:9–30.
doi:10.1046/j.1365-2907.2000.00056.x
24. Keller I, Largiadèr CR (2003) Recent habitat fragmentation caused by major roads leads to reduction of gene flow and
loss of genetic variability in ground beetles. Proceedings of the Royal Society B: Biological Sciences 270, 417–423.
doi:10.1098/rspb.2002.2247
25. Kilian A, Wenzl P, Huttner E, Carling J, Xia L, Blois H, Caig V, Heller-Uszynska K, Jaccoud D, Hopper C, Aschenbrenner-
Kilian M, Evers M, Peng K, Cayla C, Hok P, Uszynski G (2012) Diversity arrays technology: A generic genome profiling
technology on open platforms. Methods Mol Biol 888:67–89. doi:10.1007/978-1-61779-870-2_5
26. Kjeldsen SR, Raadsma HW, Leigh KA, Tobey JR, Phalen D, Krockenberger A, Ellis WA, Hynes E, Higgins DP, Zenger KR
(2019) Genomic comparisons reveal biogeographic and anthropogenic impacts in the koala (Phascolarctos cinereus):
a dietary-specialist species distributed across heterogeneous environments. Heredity 122:525–544.
doi:10.1038/s41437-018-0144-4
27. Kjeldsen SR, Zenger KR, Leigh K, Ellis W, Tobey J, Phalen D, Melzer A, FitzGibbon S, Raadsma HW (2016) Genome-wide
SNP loci reveal novel insights into koala (Phascolarctos cinereus) population variability across its range. Conserv
Genet 17:337–353. doi:10.1007/s10592-015-0784-3
28. Kumar S, Banks TW, Cloutier S (2012) SNP Discovery through Next-Generation Sequencing and Its Applications.
International journal of plant genomics 2012, 831460. doi:10.1155/2012/831460
29. Lindenmayer D (2002) ‘Gliders of Australia: a natural history’. (UNSW Press.) Available at: https://openresearch-
repository.anu.edu.au/handle/1885/92545 [accessed 16 August 2017]
30. Liu N, Chen L, Wang S, Oh C, Zhao H (2005) Comparison of single-nucleotide polymorphisms and microsatellites in
inference of population structure. BMC Genet 6. doi:10.1186/1471-2156-6-S1-S26
31. Mahoney CL, Springer D (2009) ‘Genetic diversity’. Nova Science Publishers, New York
32. Malekian M, Cooper SJB, Saint KM, Lancaster ML, Taylor AC, Carthew SM (2015) Effects of landscape matrix on
population connectivity of an arboreal mammal, Petaurus breviceps. Ecology Evolution 5:3939–3953.
doi:10.1002/ece3.1675
33. Martin A, Carver S, Proft K, Fraser TA, Polkinghorne A, Banks S, Burridge CP (2019) Isolation, marine transgression and
translocation of the bare-nosed wombat (Vombatus ursinus). Evol Appl 12:1114–1123. doi:10.1111/eva.12785
34. Mawbey R (1989) A New Trap Design for the Capture of Sugar Gliders, Petaurus-Breviceps. Wildlife Research 16:425–
428
Page 10/1835. Milanesi P, Holderegger R, Caniglia R, Fabbri E, Randi E (2016) Different habitat suitability models yield different least-
cost path distances for landscape genetic analysis. Basic Appl Ecol 17:61–71. doi:10.1016/j.baae.2015.08.008
36. NSW Government (2007) NSW Landuse 2007 - Data.NSW. Available at: https://data.nsw.gov.au/data/dataset/nsw-
landuseac11c/resource/e641e722-96c5-4519-874a-e148a496fac6?inner_span=True [accessed 6 May 2021]
37. Pavlova A, Walker FM, Van der Ree R, Cesarini S, Taylor AC (2010) Threatened populations of the Australian squirrel
glider (Petaurus norfolcensis) show evidence of evolutionary distinctiveness on a Late Pleistocene timescale. Conserv
Genet 11:2393–2407. doi:10.1007/s10592-010-0125-5
38. Pérez-Espona S, Pérez-Barbería FJ, Mcleod JE, Jiggins CD, Gordon IJ, Pemberton JM (2008) Landscape features affect
gene flow of Scottish Highland red deer (Cervus elaphus). Mol Ecol 17:981–996. doi:10.1111/j.1365-
294X.2007.03629.x
39. Pocock Z, Lawrence RE (2005). How far into a forest does the effect of a road extend? Defining road edge effect in
eucalypt forests of South-Eastern Australia. In ‘Proceedings of the 2005 International Conference on Ecology and
Transportation’. (Ed GP M. K. Irwin CL.) pp. 397–405. (Center for Transportation and the Environment, North Carolina
State University, Raleigh.) Available at: https://escholarship.org/uc/item/4q576877 [accessed 1 April 2021]
40. Pritchard JK, Stephens M, Donnelly P (2000) Inference of population structure using multilocus genotype data.
Genetics 155:945–959
41. Pritchard J, Wen X, Falush D (2003) Documentation for STRUCTURE software: version 2.3 | Request PDF. Available at:
https://www.researchgate.net/publication/252278965_Documentation_for_STRUCTURE_software_version_23
[accessed 12 March 2021]
42. Quin DG (1995) Population ecology of the squirrel glider (Petaurus norfolcensis) and the sugar glider (P. breviceps)
(Maruspialia: Petauridae) at Limeburners Creek, on the central north coast of New South Wales. Wildlife Research
22:471–505. doi:10.1071/WR9950471
43. R Core Team (2015) R: a language and environment for statistical computing. Available at:
https://www.gbif.org/tool/81287/r-a-language-and-environment-for-statistical-computing [accessed 1 April 2021]
44. R Core Team (2020) R: A language and environment for statistical computing. R Foundation for Statistical Computing,
Vienna, Austria
45. Roads and Maritime Services (2018) Traffic Volume Viewer. Available at:
https://www.rms.nsw.gov.au/about/corporate-publications/statistics/traffic-volumes/aadt-map/index.html#/?z=6
[accessed 1 April 2021]
46. Rupert JE, Schmidt EC, Moreira-Soto A, Herrera BR, Vandeberg JL, Butcher MT (2014) Myosin isoform expression in
the prehensile tails of didelphid marsupials: Functional differences between arboreal and terrestrial opossums. Anat
Rec 297:1364–1376. doi:10.1002/ar.22948
47. Schultz AJ, Cristescu RH, Littleford-Colquhoun BL, Jaccoud D, Frère CH (2018) Fresh is best: Accurate SNP genotyping
from koala scats. Ecology evolution 8:3139–3151. doi:10.1002/ece3.3765
48. Sharpe D, Goldingay RL (2007) Home range of the Australian squirrel glider, Petaurus norfolcensis (Diprotontia). J
Mammal 88:1515–1522. doi:10.1644/06-MAMM-A-404R1.1
49. Smith A (2002) Squirrel Glider (Petaurus norfolcensis) Conservation Management Plan. Wyong Shire Prepared by
Andrew Smith for Wyong Shire Council
50. Smith AP (1982) Diet and Feeding Strategies of the Marsupial Sugar Glider in Temperate Australia. The Journal of
Animal Ecology 51:149. doi:10.2307/4316
51. Smith AP, Murray M (2003) Habitat requirements of the squirrel glider (Petaurus norfolcensis) and associated
possums and gliders on the New South Wales central coast. Wildlife Research 30:291–301. doi:10.1071/WR01115
52. Soanes K, Taylor AC, Sunnucks P, Vesk PA, Cesarini S, van der Ree R (2018) Evaluating the success of wildlife crossing
structures using genetic approaches and an experimental design: Lessons from a gliding mammal. J Appl Ecol
Page 11/1855:129–138. doi:10.1111/1365-2664.12966
53. Soanes K, Vesk PA, Van der Ree R (2015) Monitoring the use of road-crossing structures by arboreal marsupials:
Insights gained from motion-triggered cameras and passive integrated transponder (PIT) tags. Wildlife Research
42:241–256. doi:10.1071/WR14067
54. Storfer A, Murphy MA, Evans JS, Goldberg CS, Robinson S, Spear SF, Dezzani R, Delmelle E, Vierling L, Waits LP (2007)
Putting the ‘landscape’ in landscape genetics. Heredity 98:128–142. doi:10.1038/sj.hdy.6800917
55. Stubbs C (2015) M1 Sydney to Newcastle motorway historic achievement in NSW roads infrastructure | Daily
Telegraph. The Daily Telegraph. Available at: https://www.dailytelegraph.com.au/newslocal/central-coast/m1-sydney-
to-newcastle-motorway-historic-achievement-in-nsw-roads-infrastructure/news-
story/9d60ce7db28666fd5915d362765a4841 [accessed 1 April 2021]
56. Taylor AC, Walker FM, Goldingay RL, Ball T, van der Ree R (2011) Degree of landscape fragmentation influences
genetic isolation among populations of a gliding mammal. PLoS ONE 6. doi:10.1371/journal.pone.0026651
57. Taylor BD, Goldingay RL (2012) Restoring Connectivity in Landscapes Fragmented by Major Roads: A Case Study
Using Wooden Poles as ‘Stepping Stones’ for Gliding Mammals. Restor Ecol 20:671–678. doi:10.1111/j.1526-
100X.2011.00847.x
58. Taylor BD, Rohweder D (2013) Radio-tracking three Sugar Gliders using forested highway median strips at Bongil
Bongil National Park, north-east New South Wales. Ecol Manag Restor 14:228–230. doi:10.1111/emr.12063
59. Wang IJ, Savage WK, Shaffer B, H (2009) Landscape genetics and least-cost path analysis reveal unexpected
dispersal routes in the California tiger salamander (Ambystoma californiense). Mol Ecol 18:1365–1374.
doi:10.1111/j.1365-294X.2009.04122.x
60. Warburton NM, Yakovleff M, Malric A (2012) Anatomical adaptations of the hind limb musculature of tree-kangaroos
for arboreal locomotion (Marsupialia:Macropodinae). Australian Journal of Zoology 60:246–258.
doi:10.1071/ZO12059
61. Wei F, Hu Y, Zhu L, Bruford MW, Zhan X, Zhang L (2012) Black and white and read all over: the past, present and future
of giant panda genetics. Mol Ecol 21:5660–5674. doi:10.1111/mec.12096
62. White LC, Moseby KE, Thomson VA, Donnellan SC, Austin JJ (2018) Long-term genetic consequences of mammal
reintroductions into an Australian conservation reserve. Biol Cons 219:1–11. doi:10.1016/j.biocon.2017.12.038
63. Whitlock MC, Mccauley DE (1999) Indirect measures of gene flow and migration: F(ST) ≠ 1/(4Nm + 1). Heredity
82:117–125. doi:10.1038/sj.hdy.6884960
64. Winning G, King J (2008) A new trap design for capturing squirrel gliders and sugar gliders. Australian Mammology
29:245–249
65. Wright B, Farquharson KA, McLennan EA, Belov K, Hogg CJ, Grueber CE (2019) From reference genomes to population
genomics: Comparing three reference-aligned reduced-representation sequencing pipelines in two wildlife species.
BMC Genom 20:453. doi:10.1186/s12864-019-5806-y
66. Zhian Kamvar MN (2021) Package ‘poppr’ Type Package Title Genetic Analysis of Populations with Mixed
Reproduction Encoding UTF-8 Depends R ( > = 2.15.1), adegenet ( > = 2.0.0). doi:10.7717/peerj.281
Tables
Table 1. Location code, latitude, longitude and the number of genotyped sugar glider samples (N) collected from 12
locations in the Lake Macquarie Local Government Area. Mean observed heterozygosity Hobs, mean expected
heterozygosity Hex and fixation index FIS are listed for each location plus/minus standard error. Total sample size of 90
individuals and 11, 292 SNPs.
Page 12/18Code Location Latitude Longitude N Hobs (± SE) Hex (± SE) FIS
AD Awabakal Drive -33.142 151.6082 9 0.116 (0.062) 0.124 (0.060) 0.065
BEC Becks Rd -33.0099 151.4776 4 0.126 (0.114) 0.123 (0.099) -0.024
BR Bushells Ridge Road -33.1994 151.4621 2 - - -
CP Coal Point -33.0362 151.6109 10 0.122 (0.061) 0.123 (0.057) 0.009
FDW Freemans Drive -33.0286 151.5006 11 0.123 (0.053) 0.134 (0.054) 0.082
HAD Hadleigh Road -33.0461 151.5725 2 - - -
OR Rathmines Park -33.0372 151.5895 9 0.126 (0.066) 0.128 (0.061) 0.017
SP Sunshine Park -33.1078 151.5616 1 - - -
WR Wilton Road (Est) -33.029 151.5548 11 0.128 (0.054) 0.136 (0.053) 0.063
WRW Wilton Road (Wst) -33.0233 151.5432 11 0.125 (0.053) 0.135 (0.053) 0.073
WYB Wyee Road (Nth) -33.133 151.4801 9 0.124 (0.064) 0.130 (0.061) 0.046
WYC Wyee Road (Sth) -33.1539 151.4821 11 0.120 (0.052) 0.136 (0.054) 0.119
Table 2. Percentages of Molecular Variance within sugar glider samples, between samples within populations and between
populations. Results of 11, 292 SNPs from 90 sugar glider samples and 9,999 permutations. Degrees of freedom (df), sum
of squares (SS), mean squares (MS).
Source of variance df SS MS % variation p value
Between populations 11 30781.54 2798.322 5.40 0.01
Between samples within populations 78 121855.83 1562.254 5.40 0.02
Within samples 90 125422.32 1393.581 89.20 0.01
Total 179 278059.70 1553.406 100.00
Table 3. Pairwise FST values between sugar glider sampling locations are shown below the diagonal.
Page 13/18Location AD BEC BR CP FDW HAD OR SP WR WRW WYB WYC
AD - NA NA NA NA NA NA NA NA NA NA NA
BEC 0.106 - NA NA NA NA NA NA NA NA NA NA
BR 0.091 0.128 - NA NA NA NA NA NA NA NA NA
CP 0.103 0.107 0.111 - NA NA NA NA NA NA NA NA
FDW 0.063 0.070 0.055 0.066 - NA NA NA NA NA NA NA
HAD 0.072 0.083 0.078 0.079 0.025 - NA NA NA NA NA NA
OR 0.088 0.098 0.101 0.078 0.055 0.054 - NA NA NA NA NA
SP 0.083 0.122 0.131 0.122 0.028 0.014* 0.094 - NA NA NA NA
WR 0.057 0.056 0.053 0.056 0.021 0.011 0.042 0.033 - NA NA NA
WRW 0.059 0.064 0.062 0.056 0.024 0.019 0.040 0.041 0.014 - NA NA
WYB 0.070 0.093 0.078 0.091 0.051 0.054 0.077 0.046 0.045 0.048 - NA
WYC 0.052 0.066 0.042 0.060 0.030 0.022 0.051 0.008* 0.023 0.025 0.028 -
*NOTE: FST values in italics are not significant according to the method proposed by Wright (1949) and updated by Weir
and Cockerham (1984) (p > 0.05)
Table 4. Comparison of sugar glider Mantel tests for isolation by distance (IBD), biogeographical barriers (B),
biogeographical barriers and four lane highways (BH), biogeographical barriers, four lane highways and habitat (BHH).
Table includes Mantel statistic ‘r’ and significance value ‘p’.
Mantel test r p
IBD 0.389* 0.011
B 0.334ns 0.098
BH 0.619* 0.001
BHH 0.647* 0.001
*: p < 0.05; ns: non-significant p > 0.05
Figures
Page 14/18Figure 1
Sugar glider trapping locations from 2017 – 2020 in the Lake Macquarie Local Government Area (LGA). See Table 1 for
number of individuals and location information. Note: The designations employed and the presentation of the material on
this map do not imply the expression of any opinion whatsoever on the part of Research Square concerning the legal
status of any country, territory, city or area or of its authorities, or concerning the delimitation of its frontiers or boundaries.
This map has been provided by the authors.
Page 15/18Figure 2
Principal Coordinates Analysis (PCoA) based on the genetic distances of sugar gliders from 12 putative populations
(“pop”) and 11, 292 SNPs. Dots represent individuals and colours represent locations/putative populations. From top to
bottom, left to right: graphical representation of the first two PCoA axes, the third and fourth PCoA axes, fifth and sixth
PCoA axes, and 7th and 8th PCoA axes. N= 90.
Page 16/18Figure 3
STRUCTURE tested 15 clusters (K = 1 – 15) with 8 replicates each, and the Structure Harvester Evanno method results were
graphed. The graphs display (a) L(K) mean +/- SD, (b) the mean rate of change of the likelihood distribution, (c) the mean
absolute value of the 2nd order rate of change of the likelihood distribution, and (d) DeltaK = mean|Ln''(K)|/sd(L(K)). K = 5
had the largest Delta K value and is displayed in red.
Figure 4
Page 17/18STRUCTURE admixture results for 90 sugar glider individuals and K = 5 clusters. Putative populations are divided by the
white dashed lines and labelled below the plot. Each cluster is coloured as shown.
Figure 5
Relationship between genetic distances (FST/(1 – FST)) and logarithm of geographic distances (km) for 12 locations of
sugar gliders in Lake Macquarie, using the results of the least cost path analysis (a) “Mantel test BH” and (b) “Mantel test
BHH”. Least cost path distances were calculated for each friction matrix as seen in top left corner of the plots. Note: The
designations employed and the presentation of the material on this map do not imply the expression of any opinion
whatsoever on the part of Research Square concerning the legal status of any country, territory, city or area or of its
authorities, or concerning the delimitation of its frontiers or boundaries. This map has been provided by the authors.
Page 18/18You can also read