NEVER STRONGER FUTURE OF AGI
←
→
Page content transcription
If your browser does not render page correctly, please read the page content below
STRONGER
               THAN
                      EVER
                      FUTURE OF AGI

INVESTOR DAY                          FEBRUARY 2023
                                                  1
AGENDA
•   Key Messages
•   Senior Leadership Introduction
•   AGI Overview
•   Corporate Strategic Priorities
•   Regional Highlights
•   Financial Overview & Outlook
•   Closing
•   Q&A
•   Disclaimers

                                     2
KEY MESSAGES

               3
KEY MESSAGES

   Proven and highly experienced senior leadership

   Strong combination of people, products, and market positions

   Top corporate strategic priorities: profitable growth, operational excellence, balance sheet discipline

   Organic growth through product transfers, extending into processing equipment, geographic expansion

                                                                                                             4
SENIOR LEADERSHIP
INTRODUCTION

                    5
SENIOR LEADERSHIP INTRODUCTION

      PAUL HOUSEHOLDER
      President & CEO

Experience highlights:
Deep operational experience: 28-year career with a global
industrial gas leader
Wide perspective: spectrum of functional, general management,
P&L leadership roles
International management: roles in five countries – U.S., Brazil,
United Kingdom, China, Canada

                                                                    Feb   6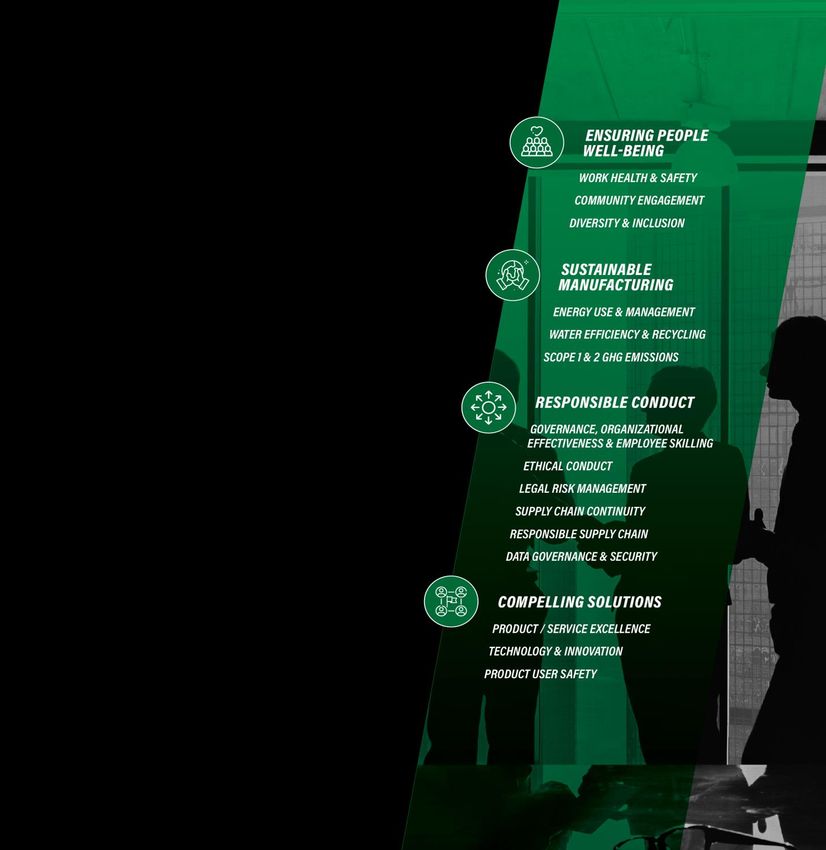
SENIOR LEADERSHIP INTRODUCTION

      JIM RUDYK
      CFO

Experience highlights:
Multi-sector perspective: senior leadership roles across many industries
Deep functional leadership experience: 20 years CFO & COO
experience, managing high growth Canadian-based businesses with a
strong global presence
Lead transformational projects: operations, financial, IT, integration

                                                                           7
EXECUTIVE OPERATING TEAM – BUSINESS LEADS

  Strong business and functional leadership to manage a global business

      Paul Brisebois    Francisco Prado   Cristiano Carpin    Scott McKernan     Rajan Aggarwal
     SVP, Canada Farm       VP, Brazil       SVP, EMEA         SVP, USA Farm          VP, India

       Brian Harder      Rustom Mistry       Mike Hand        Noam Silberstein   Jeison Santaniello
      VP, Global Food      VP, SEA        VP, North America   SVP, Global Feed    Director, LATAM
                                             Commercial

                                                                                                      8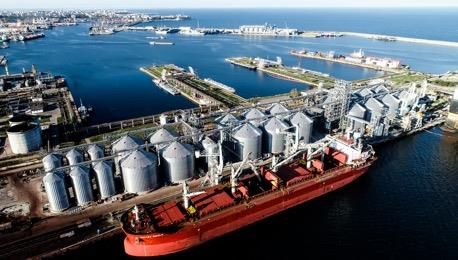
EXECUTIVE OPERATING TEAM – FUNCTIONAL LEADS

  Strong business and functional leadership to manage a global business

       Henry Palomino         Nicolle Parker        David Postill        Harsha Bhojraj            Ryan Kipp
   VP, Global Supply Chain    SVP, Finance       SVP, Marketing & CX    VP, Manufacturing          SVP, Legal

         Marie McKeegan              Shannon Hinrichs              Subroto Pyne                Justin Paterson
       SVP, Human Resources          VP, Sales Execution         VP, Global Product         VP, Global Engineering
                                                                   Management

                                                                                                                     9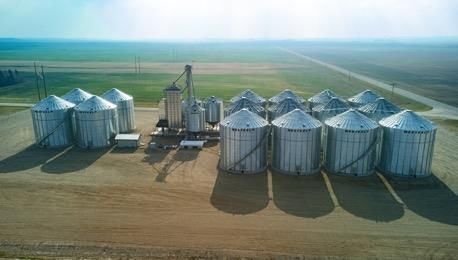
AGI OVERVIEW

               10
AGI GLOBAL OPERATIONS Global operations with regional hubs
NORTH EMEA
AMERICA
SOUTH APAC
AMERICA
Committed to global food efficiency
11AGI - SNAPSHOT
OVERVIEW
AGI is a provider of the equipment and solutions Sales by segment
required to support the efficient storage, transport,
FARM COMMERCIAL
and processing of food globally.
53% 47%
AGI has 31 manufacturing facilities across Canada,
the United States, Brazil, India, France, and Italy Sales by geography
and distributes its product worldwide.
U.S. CANADA APAC SouthAm EMEA
45% 21% 11% 13% 10%
$228M Capital markets perspective
$1.4B
Adjusted
Sales EBITDA
Enterprise Value Dividend Yield Ticker
$1.9B 1.2% TSX: AFN
Notes:
Sales, Sales by segment, Sales by geography and Adjusted EBITDA figures represent last twelve months (LTM) ending September 30, 2022. See "Presentation of Financial Information".
Adjusted EBITDA is a non-IFRS measure. Sales by Segment and Sales by Geography are supplementary financial measures. See "Non-IFRS and Other Financial Measures".
Farm segment includes Digital, Commercial segment includes Food.
Capital markets data as of January 30, 2023.
Source: Company reports, Capital IQ
12AGI PROVIDES FOOD INFRASTRUCTURE TO THE ENTIRE SUPPLY CHAIN
AGI equipment and solutions are uniquely positioned within the agriculture
sector, serving as the connection between the farm and the plate
FARM COMMERCIAL
Move, store, condition, and monitor grain Large-scale storage and movement of grain through
after harvest the food supply chain, inclusive of equipment for
food processing, rice milling, feed, and fertilizer
13AGI’S COMMITMENT TO SUSTAINABILITY
✓ As a supplier of the world’s food infrastructure,
our equipment solutions and technologies
reduce post-harvest losses and increase food
security
✓ Published inaugural Sustainability Roadmap
in December 2020 describing our sustainability
approach across four focus areas
✓ Released a comprehensive Sustainability
Progress Update in January 2023 highlighting
key ESG initiatives and performance
✓ Reports available on AGI’s corporate website
14SIGNIFICANT SALES GROWTH
CAD, millions
$1,411
• 2014 to 2020 growth was supported by an
aggressive acquisition strategy $1,000
Note: LTM period covers Q4 2021 to Q3 2022
Source: Company reports
• Significant expansion since 2020 almost entirely
attributable to organic growth
$410
• Resilient & diversified business model
2014 2020 LTM
Sales
Note: LTM Sales figures represent last twelve months (LTM) ending September 30, 2022. See "Presentation of
Financial Information".
Source: Company reports
15RESILIENT TO REGIONAL OR ECONOMIC CONDITIONS
CAD, millions
$228
• Integration & optimization phase started
with International regions in 2020 &
$149
extended to North America in 2021
• Consistent demand for AGI products
through challenging geopolitical & weather $78
events as well as economic cycles
• Uniquely positioned within the global
agriculture industry
2014 2020 LTM
Adjusted EBITDA
Notes:
LTM Adjusted EBITDA figures represent last twelve months (LTM) ending September 30, 2022. See "Presentation of
Financial Information".
Adjusted EBITDA is a non-IFRS measure. See "Non-IFRS and Other Financial Measures".
Source: Company reports
16STABLE & GROWING DEMAND PROFILE
Long-term demand for AGI products
is driven by consumption
• Global food and feed consumption • Urgency to reduce grain spoilage
• Growing population • Improving crop yields
• Growing crop volumes & production • Critical infrastructure gap in developing world
• Increasing grain exports & trade • Energy trends and alternative fuels
17LARGE & GROWING TOTAL ADDRESSABLE MARKET
• Global exposure to several multi-billion dollar growing industries
• Emphasized by growth opportunities in emerging economies
o U.S. & Canada grain storage ~60-70% of the annual crop yield
o Brazil and other developing regions are ~10-15%
• Expanded by product transfers across regions increasing AGI’s total addressable market
and sales opportunities within each region
Significant room for additional growth given
exposure to large total addressable markets
supported by secular growth trends
Sources: Trade publications, industry reports, AGI management
18THE ROLE OF AGI DIGITAL GOING FORWARD
Reorganization announced in late 2022
Refocused on core products, repositioned for profitability
Simplified channel strategy & manufacturing approach
Key differentiator for AGI and an enabler of equipment sales
Integrated more deeply within our Farm and Commercial segments
19CORPORATE STRATEGIC
PRIORITIES
20CORPORATE STRATEGIC PRIORITIES
BALANCE
PROFITABLE OPERATIONAL SHEET
GROWTH EXCELLENCE DISCIPLINE
KPI KPI KPI
Sales & EBITDA Growth Margin Expansion Total Leverage Ratio
21PROFITABLE GROWTH
1 2 3
Structured processes Product transfers to AGI as a customer
to enable growth across expand addressable partner & full solutions
attractive markets markets and capabilities provider
across all regions
22PROFITABLE GROWTH
STRUCTURED PROCESSES
1 TO ENABLE GROWTH
1 2
• Maturation from entrepreneurial culture to disciplined
operating model and rhythm
• Three-year strategic plans developed across all regions
• Regional businesses, leadership, P&Ls
• Monthly results reviews
4 3
• Action plans with defined timelines
Formal operating and strategic planning processes to maximize organic growth
23PROFITABLE GROWTH
PRODUCT TRANSFERS TO EXPAND ADDRESSABLE
2 MARKETS AND CAPABILITIES ACROSS ALL REGIONS
• Select examples
1. Enclosed conveyor belt products transferred to Brazil
2. Storage bin and portable grain handling products transferred to India
3. Fertilizer products transferred to Brazil, underway in EMEA
• Dozens of other potential product transfer options
• Key enabler to accelerate organic growth
Potential to unlock another $4B+ in total addressable market
Source: AGI management
24PROFITABLE GROWTH
3 AGI AS A CUSTOMER PARTNER & FULL SOLUTIONS PROVIDER
End-to-end solutions
• Key differentiator & a common customer request
• Storage, handling, processing
Spares, parts, and aftermarket service offering
• Established core competency in India across rice milling business
• Growth focus for North America fertilizer equipment, doubled spare parts sales in first year
• Best practices being shared and rolled-out across AGI
Best-in-class customer experience
• New groups formed with dedicated focus on customer success & customer experience
Evolving business model to further accelerate organic growth and win market share
25PROFITABLE GROWTH
3 SPOTLIGHT – EXPANDING PROCESSING CAPABILITIES GLOBALLY
• Storage and handling equipment are longstanding core AGI products; now moving further into processing
• Processing functions are key value driver of customer operations
• Success in processing solutions (i.e. rice milling, fertilizer, food, feed) to be taken globally
• Supplying solutions for all three functions is a competitive advantage for AGI
Three major
functions at Storage Handling Processing
customer facilities
Extending into processing equipment & solutions unlocks multi-billion market opportunity
Source: AGI management
26OPERATIONAL EXCELLENCE
1 2 3
ONE AGI Centralizing key functions Investing in technology
Culture to expand margins to support and streamline
and support growth a global operation
27OPERATIONAL EXCELLENCE
1 ONE AGI CULTURE
• Migrating from a division-centric • Uniting our teams under a • Organization-wide view
to a ONE AGI model centralized structure
A highly integrated global
company delivering
exceptional performance
through collaboration,
inclusion, and cooperation
28OPERATIONAL EXCELLENCE
1 ONE AGI CULTURE - SAFETY
Lost Time Injury Rate
1.7
• Primary focusNote:
for AGI
LTM period covers Q4 2021 to Q3 2022
Source: Company reports
• AGI Safety Management System 1.1
• Annual safety week, safety awards
0.7
• Collection & standardizing all safety data
• Machine guarding initiative across facilities
2020 2021 2022
Note: Lost time injury rate calculated in-line with OSHA standards using the formula: ([number of lost time
injuries in the reporting period] x 200,000) / (total hours worked in the reporting period); this metric
references the number of lost time injuries per 100 employees per year, assuming a 40-hour work week
and 50 weeks worked.
Source: AGI management
29OPERATIONAL EXCELLENCE
CENTRALIZING KEY FUNCTIONS TO EXPAND MARGINS
2 AND SUPPORT GROWTH
• Bringing together functions to support AGI’s project-based businesses
• Deepening integration – elevate and centralize key functions across facilities
• Eliminate cost redundancies
• Enhance customer experience
• Centralized project execution
• Establish new functional groups to drive efficiencies and support growth
Applications Customer Success Global Product
Sales Execution
Engineering & Customer Service Management
Strategic Accounts
Global Manufacturing Global Supply Chain Revenue Management
Team
Represents a critical element of “A Stronger AGI”
30OPERATIONAL EXCELLENCE
2 SPOTLIGHT – GLOBAL PRODUCT MANAGEMENT
• Centralized product management function BCX3
▪ Strategic product road mapping, development, Engineered to
accommodate all
rationalization commodities
• Avoid redundancies across multiple facilities
▪ Simplified product catalogue
▪ Enhanced manufacturing flexibility and
supply chain leverage
EZEE-DRY
• Significant increase in product development ability
First ever roof-top
grain drying system
• Lead product transfers to other regions
31OPERATIONAL EXCELLENCE
2 SPOTLIGHT – CHICAGO OFFICE
• New corporate office in Chicago • North American center of excellence for centralized
• Opened in August 2022 functions
▪ ~200 employee capacity • Enhanced ability to collaborate and coordinate
across functions and facilities
▪ ~65 today
• Building a ONE AGI Culture
▪ 45,000 sq. ft.
Key step in uniting as ONE AGI to drive organic growth and operational excellence
32OPERATIONAL EXCELLENCE
INVESTING IN TECHNOLOGY TO SUPPORT
3 AND STREAMLINE A GLOBAL OPERATION
• Ongoing multi-year IT transformation to enable a firm-wide perspective
▪ Organizational-level view of supply chain, finance, customers, capacity, scheduling, logistics, etc
▪ Material cost savings in COGS to drive payback over the next 3 - 4 years
Company-wide Ease of doing
Enhanced
agility, business for
customer
scalability, customers &
experience
and resilience employees
Key IT
Transformation
Objectives Rationalized and Common and Design driven
consistent integrated enterprise by data and
enterprise master tools and end-to-end analytical
data processes decision making
33BALANCE SHEET DISCIPLINE
Committed to Total net debt / Debt repayment is a
deleveraging; target LTM Adjusted EBITDA at high priority with
total net debt / LTM three-year low and will significant repayment
adjusted EBITDA ratio continue trending lower targeted for 2023
of 2.5x
Note: Total Net Debt and Adjusted EBITDA are non-IFRS measures. Total Net Debt / LTM Adjusted EBITDA ratio is a non-IFRS ratio. See "Non-IFRS and Other Financial Measures".
34REGIONAL HIGHLIGHTS
35A GLOBAL BUSINESS, MANAGED REGIONALLY, AND SELLING INTO >100 COUNTRIES WORLDWIDE
LEGEND
% total 3-year
EMEA AGI sales CAGR
• 5 facilities
-3% 21% • 250 employees
Canada
• Entered 2015
• 11 facilities
• 1,500 employees 10% 6% APAC
• Founded 1996
45% 14% • 4 facilities
• 1,100 employees
U.S. • Entered 2019
• 10 facilities
• 1,200 employees 11% 27%
• Entered 2006
Highly attractive
market positions,
including high growth 13% 49%
regions with chronic South America
food infrastructure • 1 facility
deficits • 1,000 employees
• Entered 2016
Notes:
Three-year Sales CAGR figures from fiscal 2019 to last twelve months (LTM) ending September 30, 2022.
Sales by geography figures represent last twelve months (LTM) ending September 30, 2022. See "Presentation of Financial Information".
Source: Company reports
36REGIONAL OVERVIEW – UNITED STATES
Sales Overview CAD, millions
$636
Operations
$532
$426 $443 Total Manufacturing Facilities: 10, ~1.3M sq.ft.
Regional Headquarters: Naperville, Illinois
Employees: ~1,200
% Total AGI Sales: 45%
2019 2020 2021 LTM
Strategic Priorities
LTM • Farm system dealer conversions
Commercial
Sales, 37% • Focused Commercial efforts with strategic accounts
• Leverage consolidated design & delivery capabilities
LTM Farm • Transfer and enhance products to broaden market
Sales, 63%
Note: Sales by Geography and Sales by Segment are supplemental financial measures. All LTM Sales figures and percentages
are for the last twelve months (LTM) ending September 30, 2022. See "Non-IFRS and Other Financial Measures".
Source: Company reports
37REGIONAL OVERVIEW – CANADA
Sales Overview CAD, millions
$325 Operations
$282 $292
$268
Total Manufacturing Facilities: 11, ~900k sq. ft.
Regional Headquarters: Winnipeg, MB & Toronto, ON
Employees: ~1,500
% Total AGI Sales: 21%
2019 2020 2021 LTM
LTM
Strategic Priorities
Commercial
Sales, 27% • Drive portable handling equipment market share
• Transfer and enhance light-duty Farm product line
• Leverage consolidated design & delivery capabilities
• Expand core client base in Food
LTM Farm
Sales, 73%
Note: Sales by Geography and Sales by Segment are supplemental financial measures. All LTM Sales figures and percentages
are for the last twelve months (LTM) ending September 30, 2022. See "Non-IFRS and Other Financial Measures".
Source: Company reports
38REGIONAL OVERVIEW – SOUTH AMERICA
Sales Overview CAD, millions Operations
Total Manufacturing Facilities: 1, ~240k sq. ft.
$193
Regional Headquarters: Assis, Brazil
$142
Employees: ~1,000
% Total AGI Sales: 13%
$59 $69
Strategic Priorities
2019 2020 2021 LTM Brazil
• Target farm regions with storage deficits
• Strategic focus on major port and river projects
LTM Farm • Accelerate product transfers: feed, fertilizer, food, rice
Sales, 43%
LTM LATAM
Commercial
Sales, 57% • Grow in-land grain market share
• Transfer key products, prioritizing rice milling
Note: Sales by Geography and Sales by Segment are supplemental financial measures. All LTM Sales figures and percentages
are for the last twelve months (LTM) ending September 30, 2022. See "Non-IFRS and Other Financial Measures".
Source: Company reports
39REGIONAL OVERVIEW – APAC
Sales Overview CAD, millions Operations
$150
$129 Total Manufacturing Facilities: 4, ~245k sq. ft.
$101
Regional Headquarters: Bangalore, India
Employees: ~1,100
$74
% Total AGI Sales: 11%
Strategic Priorities
2019 2020 2021 LTM India
LTM Farm • Accelerate product transfers: feed, fertilizer, food
Sales, 21%
• Expand Global Capabilities Centre team and scope
• Storage & portable handling capability to drive share
SEA & ANZ
• Expand agent and dealer network
LTM • Support rice milling exports from India
Commercial
Sales, 79% • Large key account management
Note: Sales by Geography and Sales by Segment are supplemental financial measures. All LTM Sales figures and percentages
are for the last twelve months (LTM) ending September 30, 2022. See "Non-IFRS and Other Financial Measures".
Source: Company reports
40REGIONAL OVERVIEW – EMEA
Sales Overview CAD, millions
$139 Operations
$128
$116
$105 Total Manufacturing Facilities: 5, ~400k sq. ft.
Regional Headquarters: Fiesso, Italy
Employees: ~250
% Total AGI Sales: 10%
2019 2020 2021 LTM
Strategic Priorities
• Continue expansion in Africa and Middle East
LTM
Commercial • Continue aggressive roll-out of fertilizer and rice milling
Sales, 91%
offerings
LTM Farm • Develop end-to-end supplier capabilities including EPC
Sales, 9%
Note: Sales by Geography and Sales by Segment are supplemental financial measures. All LTM Sales figures and percentages
are for the last twelve months (LTM) ending September 30, 2022. See "Non-IFRS and Other Financial Measures".
Source: Company reports
41FINANCIAL OVERVIEW
& OUTLOOK
42FINANCIAL OVERVIEW & OUTLOOK
SUSTAINABLE BALANCE WORKING MODEST STRONG
GROWTH & SHEET CAPITAL CAPITAL GUIDANCE
RESILIENT DISCIPLINE MANAGEMENT EXPENDITURE & OUTLOOK
MARGINS FOCUS NEEDS
43FINANCIAL OVERVIEW & OUTLOOK
Sales CAD, millions
$1,411
$1,199
$1,000 $1,000 32.1% 30.4% 31.8%
31.1%
Adjusted Gross Margin %
2019 2020 2021 LTM
16.2%
14.4% 14.9% 14.7%
Adjusted EBITDA $228
$176
$144 $149 Adjusted EBITDA Margin %
2019 2020 2021 LTM
2019 2020 2021 LTM
Notes:
All LTM figures and percentages are for the last twelve months (LTM) ending September 30, 2022. See "Presentation of
Financial Information".
Adjusted EBITDA is a non-IFRS measure. Adjusted Gross Margin % and Adjusted EBITDA Margin % are non-IFRS
ratios. See "Non-IFRS and Other Financial Measures".
Source: Company reports
44FINANCIAL OVERVIEW & OUTLOOK
RESILIENT MARGINS
Strong cost Increased
Leveraging strong Pricing discipline; control and ability high-margin spares
revenue growth inelastic demand to mitigate cost and aftermarket
inflation service sales
Multiple avenues to support 100-200 bps Adjusted EBITDA margin expansion in coming years
45FINANCIAL OVERVIEW & OUTLOOK
BALANCE SHEET DISCIPLINE
• Committed to deleveraging
Total Net Debt / LTM EBITDA Ratio
• Total net debt / LTM EBITDA
7.0x
at three-year low and
6.0x expected to trend lower
5.0x
• Debt repayment is a high
4.0x
4.1x priority with significant
3.0x repayment targeted for 2023
2.0x
• Target ratio of 2.5x
1.0x
–
Q1/19
Q2/19
Q3/19
Q4/19
Q1/20
Q2/20
Q3/20
Q4/20
Q1/21
Q2/21
Q3/21
Q4/21
Q1/22
Q2/22
Q3/22
Total Net Debt / LTM EBITDA
Notes:
Total Net Debt and Adjusted EBITDA are non-IFRS measures. Total Net Debt / LTM Adjusted EBITDA ratio is a non-IFRS ratio. See "Non-IFRS and
Other Financial Measures".
Total Net Debt / LTM Adjusted EBITDA ratio as of September 30, 2022.
Source: Company reports
46FINANCIAL OVERVIEW & OUTLOOK
WORKING CAPITAL MANAGEMENT FOCUS • Clear downtrend over
recent years
Working capital intensity
30% • Temporary ramp-up in
inventory in H1/22
25%
reflecting strategic
20% investment to combat
16%
supply chain congestion
15%
and ensure high rates of
10% on-time delivery
5% • Heightened internal focus
on managing DSO, DIO,
0%
DPO at the facility-level
Q3/21
Q1/19
Q2/19
Q3/19
Q4/19
Q1/20
Q2/20
Q3/20
Q4/20
Q1/21
Q2/21
Q4/21
Q1/22
Q2/22
Q3/22
Net Working Capital % Sales
Notes:
Net Working Capital is a non-IFRS measure. Working capital intensity or Net Working Capital % Sales is a non-IFRS ratio. See "Non-IFRS and Other Financial Measures".
DSO = Days Sales Outstanding, DIO = Days Inventory Outstanding, DPO = Days Payable Outstanding
Source: Company reports
47FINANCIAL OVERVIEW & OUTLOOK
MODEST CAPITAL EXPENDITURE NEEDS
1 2 3
Maintenance capital Growth capital Intangibles
• 1.0% - 1.5% of sales • Very limited M&A; focus on organic • Investment in proprietary
technologies & products
• Essential upkeep for • Plant debottlenecking, automation,
production equipment efficiency • AGI IT systems / security
• Possible expansions when capacity is • Product R&D
severely constrained and investment
meets high ROIC standards • Digital products
Total capex of $40M - $50M expected in 2022; incremental high growth opportunities
being reviewed and considered for 2023 and beyond
Note: Total Capital Expenditures is a non-IFRS measure. See "Non-IFRS and Other Financial Measures".
48STRONG GUIDANCE & OUTLOOK
STRONG GUIDANCE & OUTLOOK
Guidance Capital Allocation Priorities
Tier 1 • Debt repayment
• Full-year 2022 adjusted EBITDA expected to be Highest
• Maintenance capex
at least $228 million priority
• Highly compelling organic growth
• Highly confident in 2023 adjusted EBITDA growth opportunities
Tier 2
Opportunistic • Disciplined working capital
management
• M&A
Tier 3
• Dividend increases
Not a priority
Note: Adjusted EBITDA is a non-IFRS measure. Backlog is a supplemental financial measure. See "Non-IFRS • Share repurchases
and Other Financial Measures".
49CLOSING
50KEY MESSAGES
Proven and highly experienced senior leadership
Strong combination of people, products, and market positions
Top corporate strategic priorities: profitable growth, operational excellence, balance sheet discipline
Organic growth through product transfers, extending into processing equipment, geographic expansion
51FUTURE OF AGI
STRONGER THAN EVER
AGI WAS < $1B
SALES A FEW YEARS AGO,
Strong setup
for sustainable
organic growth
NOW CLOSING ON
$2B • The right products
• The right people
$3B
• The right market positions
HAS BECOME THE GOAL
52Q&A
FORWARD-LOOKING INFORMATION (1/2)
This presentation contains forward-looking statements and information (collectively, "forward-looking information") within the meaning of applicable securities laws that reflect our expectations regarding the future
growth, results of operations, performance, business prospects, and opportunities of AGI. All information and statements contained herein that are not clearly historical in nature constitute forward-looking information,
and the words "anticipate", "believe", "continue", "could", "expects", "intend", "trend", "plans", "postulates", "predict", "will", "may" or similar expressions suggesting future conditions or events or the negative of these
terms are generally intended to identify forward-looking information. Forward-looking information involves known or unknown risks, uncertainties and other factors that may cause actual results or events to differ
materially from those anticipated in such forward-looking information. In addition, this presentation may contain forward-looking information attributed to third party industry sources. Undue reliance should not be placed
on forward-looking information, as there can be no assurance that the plans, intentions or expectations upon which it is based will occur. In particular, the forward-looking information in this presentation includes
information relating to: our top corporate strategic priorities of profitable growth, operational excellence and balance sheet discipline; that we are positioned for organic growth through product transfers, increasing
market share and geographic expansion; our mission; that we have a stable and growing demand profile; the long-term demand drivers for our products; that we have notable growth opportunities in emerging
economies; that we have significant room for additional growth given our exposure to large total addressable markets supported by secular growth trends; the role of AGI's Digital business segment going forward,
including that it has been repositioned for profitability; our commitment to sustainability; our strategies for achieving profitable growth, including to implement formal operating and strategic planning processes to
maximize organic growth, to complete product transfers to pursue the potential to unlock another $3 billion in total addressable market, and to evolve our business model to further accelerate organic growth and win
market share; our strategies for achieving operational excellence, including to centralize key functions to expand margins, support growth and drive organic growth and operational excellence, to migrate from a division-
centric to a ONE AGI model and unite our teams under a centralized structure, and to invest in technology to support and streamline a global operation (from which we expect material cost savings in cost of goods sold
to drive payback over the next 3 to 4 years); our strategies for achieving balance sheet discipline, including our commitment to deleveraging with a target ratio of 2.5x, our belief that our total net debt to LTM EBITDA
ratio will continue to trend lower, and that debt repayment is a high priority with significant repayment targeted for 2023; our strategic priorities in each of our operating regions; our outlook, including for sustainable
growth and resilient margins, balance sheet discipline, working capital management focus, modest capital expenditure needs and strong guidance; how we will maintain resilient margins, including our belief that we
have multiple avenues to support 100 – 200 bps EBITDA margin expansion in coming years; our financial outlook, including our commitment to deleveraging, that our total net debt / LTM Adjusted EBITDA is expected
to trend lower, that debt repayment is a high priority with significant repayment targeted for 2023, and that our target ratio for total net debt / LTM Adjusted EBITDA is 2.5x; our focus on working capital management;
that we have modest capital expenditure needs, including our expectations for maintenance capital, growth capital and investment in intangibles and the details thereof; that our total capital expenditures in 2022 are
expected to be $40 to $50 million; our guidance and outlook, including our forecast for full-year 2022 Adjusted EBITDA of at least $228 million, our high confidence in 2023 Adjusted EBITDA growth and our Tier 1, 2
and 3 capital allocation priorities; that we are now closing in on $2 billion of annual Sales and that $3 billion of annual Sales has become our new goal; and that we have a strong setup for sustainable organic growth.

Such forward-looking information reflects our current beliefs and is based on information currently available to us, including certain key expectations and assumptions concerning: our ability to successfully implement
our business plan and achieve our top corporate strategic priorities; the anticipated impacts of the ongoing COVID-19 pandemic on our business, operations and financial results; future debt levels; anticipated grain
production in our market areas; financial performance; the scope, nature, timing and cost of work that will be required in connection with remediation and equipment rework (the "Remediation Work") as disclosed in our
management's discussion and analysis (the "MD&A") for the three and nine month periods ended September 30, 2022 (the "Q3 2022 MD&A") under "Remediation costs and equipment rework", including costs of
remediation and equipment rework and the availability of insurance coverage to offset such costs; the financial and operating attributes of recently acquired businesses and the anticipated future performance thereof
and contributions therefrom; business prospects; strategies; product and input pricing; regulatory developments; tax laws; the sufficiency of budgeted capital expenditures in carrying out planned activities; political
events; currency exchange, interest rates and inflation rates; the cost of materials, labour and services; the value of businesses and assets and liabilities assumed pursuant to recent acquisitions; the impact of
competition; the general stability of the economic and regulatory environment in which we operate; the timely receipt of any required regulatory and third party approvals; the ability of AGI to obtain and retain qualified
staff and services in a timely and cost efficient manner; the timing and payment of dividends; the ability of the Company to obtain financing on acceptable terms; the regulatory framework in the jurisdictions in which the
Company operates; and the ability of the Company to successfully market its products and services.

                                                                                                                                                                                                                               54
FORWARD-LOOKING INFORMATION (2/2)
Forward-looking information involves significant risks and uncertainties. A number of factors could cause actual results to differ materially from results discussed in the forward-looking information, including: the effects
of global outbreaks of pandemics or contagious diseases or the fear of such outbreaks, such as the recent COVID-19 pandemic, including the effects on the Company's operations, personnel, and supply chain, the
demand for its products and services, its ability to expand and produce in new geographic markets or the timing of such expansion efforts, and on overall economic conditions and customer confidence and spending
levels; changes in international, national and local macroeconomic and business conditions, as well as sociopolitical conditions in certain local or regional markets, including as a result of the conflict between Russia
and Ukraine and the response thereto from other countries and institutions (including trade sanctions and financial controls), which could adversely impact economic and trade activity across Europe and perhaps
worldwide; weather patterns, crop planting, crop yields, crop conditions, the timing of harvest and conditions during harvest; the inability of management to successfully execute AGI's business plan and achieve our top
corporate strategic priorities; seasonality; industry cyclicality; volatility of production costs; agricultural commodity prices; the cost and availability of capital; currency exchange, interest rates and inflation rates; the
availability of credit for customers; competition; AGI's failure to achieve the expected benefits of recent acquisitions including to realize anticipated synergies and margin improvements; changes in trade relations
between the countries in which AGI does business including between Canada and the United States; cyber security risks; the risk that the assumptions and estimates underlying the provisions for warranty accrual and
remediation related to the Remediation Work disclosed in our Q3 2022 MD&A under "Remediation costs and equipment rework" and insurance coverage for such matters will prove to be incorrect as further information
becomes available to the Company; and the risk of litigation or unsuccessful defense of litigation in respect of equipment or work previously supplied or completed (including the Remediation Work) or in respect of
other matters and the risk that AGI incurs material liabilities in connection with such litigation that are not covered by insurance in whole or in part.
These and other risks and uncertainties are described under "Risks and Uncertainties" in our most recently filed interim and annual MD&A and in our most recently filed Annual Information Form, all of which are
available under the Company's profile on SEDAR (www.sedar.com). These factors should be considered carefully, and readers should not place undue reliance on the Company's forward-looking information. We
cannot assure readers that actual results will be consistent with this forward-looking information. Further, AGI cannot guarantee that the anticipated revenue from its backlogs will be realized or, if realized, will result in
profits or Adjusted EBITDA. Delays, cancellations and scope adjustments occur from time to time with respect to contracts reflected in AGI's backlogs, which can adversely affect the revenue and profit that AGI actually
receives from its backlogs. Readers are further cautioned that the preparation of financial statements in accordance with IFRS requires management to make certain judgments and estimates that affect the reported
amounts of assets, liabilities, revenues and expenses and the disclosure of contingent liabilities. These estimates may change, having either a negative or positive effect on profit, as further information becomes
available and as the economic environment changes. Without limitation of the foregoing, the provision for warranty accrual and remediation related to the Remediation Work disclosed in our Q3 2022 MD&A under
"Remediation costs and equipment rework" required significant estimates and judgments about the scope, nature, timing and cost of work that will be required. It is based on management’s assumptions and estimates
at the date thereof and is subject to revision in the future as further information becomes available to AGI. The forward-looking information contained herein is expressly qualified in its entirety by this cautionary
statement. The forward-looking information included in this presentation is made as of the date of this presentation and AGI undertakes no obligation to publicly update such forward-looking information to reflect new
information, subsequent events or otherwise unless so required by applicable securities laws.
Financial Outlook
Included in this press release are estimates of AGI's 2022 Adjusted EBITDA [and total capital expenditures]; which are based on, among other things, the various assumptions disclosed in this presentation including
under "Forward-Looking Information" and including our assumptions regarding (i) the Adjusted EBITDA contribution that AGI will receive in 2022 from Eastern Fabricators, which was acquired by AGI on January 4,
2022, and (ii) the Adjusted EBITDA contribution that AGI will receive from revenue growth in 2022 in part from the year over year increase in AGI's backlogs. To the extent such estimates constitute a financial outlook,
it was approved by management on November 8, 2022 and is included to provide readers with an understanding of AGI's 2022 Adjusted EBITDA and total capital expenditures based on the assumptions described
herein and readers are cautioned that the information may not be appropriate for other purposes.
55PRESENTATION OF FINANCIAL INFORMATION
All financial information of AGI included in this presentation is reported in Canadian dollars and (except for forward-looking financial information) has been derived from audited and unaudited historical financial
statements of AGI that were prepared in accordance with International Financial Reporting Standards ("IFRS"). References to "LTM" (last twelve months) in this presentation mean the last 12-month period ended
September 30, 2022, and have been computed by adding the three-months ended December 31, 2021 to the nine-months ended September 30, 2022.
NON-IFRS AND OTHER FINANCIAL MEASURES
This presentation makes reference to certain specified financial measures, including non-IFRS financial measures (historical and forward-looking), non-IFRS ratios and supplementary financial measures. Management
uses these financial measures for purposes of comparison to prior periods and development of future projections and earnings growth prospects. This information is also used by management to measure the
profitability of ongoing operations and in analyzing our business performance and trends. These specified financial measures are not recognized measures under IFRS, do not have a standardized meaning prescribed
by IFRS and are therefore unlikely to be comparable to similar measures presented by other companies. Rather, these measures are provided as additional information to complement our financial information reported
under IFRS by providing further understanding of our results of operations from management's perspective. Accordingly, they should not be considered in isolation nor as a substitute for analysis of our financial
information reported under IFRS. We use specified financial measures to provide supplemental measures of our operating performance and thus highlight trends in our core business that may not otherwise be
apparent when relying solely on IFRS financial measures. Management also uses specified financial measures in order to prepare annual operating budgets and to determine components of management
compensation. We strongly encourage investors to review our consolidated financial statements and publicly filed reports in their entirety and not to rely on any single financial measure or ratio. The following is a list of
specified financial measures that are referenced throughout this presentation.
56PRESENTATION OF FINANCIAL INFORMATION
Adjusted EBITDA (adjusted earnings before interest, taxes, depreciation, and amortization) is a non-IFRS financial measure and its most directly comparable financial measure that is disclosed in our consolidated
financial statements is profit (loss) before income taxes. For an explanation of the composition of Adjusted EBITDA (historical and forward-looking), an explanation of how Adjusted EBITDA provides useful information
to an investor, an explanation of the additional purposes for which management uses Adjusted EBITDA, and a quantitative reconciliation of Adjusted EBITDA to profit (loss) before income taxes, see the information
under the heading: (i) "Non-IFRS Measures" in our MD&A for the years ended December 31, 2014, 2017, 2018, 2019 and 2020; and (ii) "Non-IFRS and Other Financial Measures" in our MD&A for the year ended
December 31, 2021; which information (and related reconciliations referenced therein) are incorporated by reference herein. The aforementioned MD&As are available on SEDAR at www.sedar.com. The following
table reconciles profit (loss) before income taxes to Adjusted EBITDA for the 12-month period ended September 30, 2022:
LTM Adjusted EBITDA Footnotes:
[1] See “Share of associate's net loss (gain)” in our management discussion and analysis and consolidated financial statements for the
(thousands of dollars) LTM Sept 30, 2022 quarter ended September 30, 2022 ("2022 Statements") and year ended December 31, 2021 (“2021 Statements”).
[2] See “Note 13 [e] - Other expenses (income)” in our 2022 Statements and "Note 25 [e] - Other expenses (income)” in our 2021
Profit / (loss) before income taxes 9,512 Statements.
Finance costs 55,818 [3] The Company’s share-based compensation expense pertains to our equity incentive award plan and directors’ deferred
compensation plan. See “Note 12 – Share-based compensation plans” in our 2022 Statements and "Note 24 – Share-based
Depreciation and amortization 74,295 compensation plans” in our 2021 Statements.
Share of associate's net loss [1] — [4] See “Equity swap” in our 2022 Statements and 2021 Statements.
Gain on remeasurement of equity investment [1] — [5] Transaction costs associated with completed and ongoing mergers and acquisitions activities.
Loss on foreign exchange [2] 11,363 [6] The result of a change in management estimate on variable considerations for a one-time sales concessions related to previous
Share-based compensation [3] 13,263 sales contracts.
[7] Includes restructuring and other acquisition related transition costs, as well as the accretion and other movement in contingent
(Gain) / loss on financial instruments [4] (3,347)
consideration and amounts due to vendors.
M&A expense [5] 843 [8] See “Remediation costs and equipment rework” in our 2022 Statements and 2021 Statements.
Change in estimate on variable considerations [6] 11,400 [9] Impairment is a result of a write-down in fixed assets and intangible assets.
Other transaction and transitional costs [7] 33,669
Net loss on disposal of property, plant and equipment 292
Gain on settlement of right-of-use assets (28)
Gain on disposal of foreign operation —
Equipment rework and remediation [8] 18,600
Fair value of inventory from acquisition 609
Impairment charge [9] 2,048
Adjusted EBITDA 228,337
Adjusted EBITDA margin % is a non-IFRS ratio and is defined as Adjusted EBITDA divided by sales. Adjusted EBITDA margin % is a non-IFRS ratio because one of its components, Adjusted EBITDA, is a non-IFRS
financial measure. Management believes Adjusted EBITDA margin % is a useful measure to assess the performance and cash flow of AGI.
57PRESENTATION OF FINANCIAL INFORMATION
Adjusted Gross Margin is a non-IFRS financial measure and its most directly comparable financial measure that is disclosed in our consolidated financial statements is gross profit. Adjusted Gross Margin is defined
as gross profit before equipment rework and remediation, fair value of inventory from acquisition and depreciation and amortization. Management believes that Adjusted Gross Margin is a useful measure to assess the
performance of AGI as it excludes the effects of depreciation and amortization. The following table reconciles gross profit to Adjusted Gross Margin for the years ended 2019, 2020 and 2021 and the twelve-month
period ended September 30, 2022:
Adjusted Gross Margin Footnotes:
[1] For the year ended December 31, 2021, and the LTM period ending September 30, 2022 the
(thousands of dollars) 31-Dec-19 31-Dec-20 31-Dec-21 LTM Sept 30, 2022 effect of foreign currency translations arising from the settlement of accounts receivables and
[1]
payables recorded in a currency other than the Company’s functional currency have been
Trade Sales 999,935 1,000,130 N/A N/A presented within finance income (expenses). Historically, the foreign exchange impact was
Loss in foreign exchange [1] (4,148) (6,400) N/A N/A presented in sales and a reconciliation was made to trade sales as presented in prior
Sales 995,787 993,730 1,198,523 1,411,143 management's discussion and analysis. This change in presentation effectively eliminates the
Cost of goods sold 728,047 787,340 894,508 1,025,640 need for trade sales and therefore sales is presented in this press release with the
reclassification of comparative information.
Gross Profit 267,740 206,390 304,015 385,503
Gross Profit as a % of sales 26.9% 20.8% 25.4% 27.3%
Loss in foreign exchange [1] 4,148 6,400 — —
IFRS 15 Adjustment — — — —
Equipment rework and remediation 10,000 80,000 26,100 18,600
Fair value of inventory from acquisition 1,962 — — 609
Depreciation and amortization 27,321 28,527 34,006 44,529
Adjusted Gross Margin 311,171 321,317 364,121 449,241
Adjusted Gross Margin as a % of sales 31.1% 32.1% 30.4% 31.8%
Adjusted Gross Margin % (or Adjusted Gross Margin as a % of sales) is a non-IFRS ratio and is defined as Adjusted Gross Margin divided by sales. Adjusted Gross Margin % is a non-IFRS ratio because one of its
components, Adjusted Gross Margin, is a non-IFRS financial measure. Management believes Adjusted Gross Margin % is a useful measure to assess the performance of AGI.
58PRESENTATION OF FINANCIAL INFORMATION
Net Working Capital is a non-IFRS financial measure and its most directly comparable financial measure that is disclosed in our consolidated financial statements is Total Current Assets. Net Working Capital is
defined as the sum of cash and cash equivalents, accounts receivable, inventory, pre-paid expenses and other assets less accounts payable and accrued liabilities, customer deposits and provisions. Management
believes that Net Working Capital is a useful measure to evaluate the capital required to support AGI’s sales and operations. The following table reconciles Total Current Assets to Net Working Capital as at March 31,
2019, 2020, 2021 and 2022, June 30, 2019, 2020, 2021 and 2022, September 30, 2019, 2020, 2021 and 2022 and December 31, 2019, 2020 and 2021.
Net Working Capital
Q1/19 Q2/19 Q3/19 Q4/19 Q1/20 Q2/20 Q3/20 Q4/20 Q1/21 Q2/21 Q3/21 Q4/21 Q1/22 Q2/22 Q3/22
(thousands of dollars) 31-Mar-19 30-Jun-19 30-Sep-19 31-Dec-19 31-Mar-20 30-Jun-20 30-Sep-20 31-Dec-20 31-Mar-21 30-Jun-21 30-Sep-21 31-Dec-21 31-Mar-22 30-Jun-22 30-Sep-22
Total current assets 505,885 454,270 441,385 438,456 429,770 472,014 534,030 476,156 499,577 564,208 586,768 572,819 652,636 702,138 693,607
Less:
Cash and cash equivalents 90,079 14,085 20,948 48,421 3,603 22,897 74,825 62,456 48,748 55,175 48,610 61,307 60,234 55,201 42,384
Restricted cash 1,752 1,454 1,436 5,416 5,601 6,293 9,525 9,616 6,540 6,080 2,441 2,424 3,730 2,322 2,390
Current portion of notes receivable 99 76 89 97 112 105 109 5,457 5,386 5,306 5,454 5,428 5,351 5,515 5,860
Due from vendor 1,645 1,610 1,414 0 0 0 0 0 0 0 0 0 0 0 0
Current portion of derivative
55 0 0 5,865 0 0 0 0 0 0 0 0 0 0 0
instruments
Income taxes recoverable 3,576 3,918 3,346 7,425 8,148 8,533 8,685 6,950 6,620 7,003 9,001 9,351 10,012 11,425 14,024
Less:
Accounts payable 129,427 131,787 127,675 105,378 126,076 148,403 161,981 139,098 156,904 173,434 212,897 195,646 191,238 204,647 206,613
Customer deposits 49,046 36,219 38,214 39,583 46,689 40,120 39,854 46,013 56,286 62,856 84,964 86,457 91,052 84,120 89,546
Provisions 8,370 8,982 15,625 17,539 18,786 19,842 54,279 83,361 75,877 65,110 48,326 65,618 65,415 64,573 68,544
Net working capital 221,836 256,139 232,638 208,732 220,755 225,821 184,772 123,205 143,216 189,244 175,075 146,588 225,604 274,335 264,246
Net Working Capital as a % of Sales or Working Capital Intensity is a non-IFRS ratio and is defined as Net Working Capital divided by quarterly Sales and divided by four to annualize the ratio. Net Working Capital
as a % of Sales is a non-IFRS ratio because one of its components, Net Working Capital, is a non-IFRS financial measure. Management believes Net Working Capital as a % of Sales is a useful measure to assess the
short-term cash requirements to support sales and operations.
59PRESENTATION OF FINANCIAL INFORMATION
Backlogs is a supplementary financial measure and is defined as the total value of committed sales orders that have not yet been fulfilled that: (a) have a high certainty of being performed as a result of the existence
of a purchase order, an executed contract or work order specifying job scope, value and timing; or (b) has been awarded to AGI or its divisions, as evidenced by an executed binding letter of intent or agreement,
describing the general job scope, value and timing of such work, and where the finalization of a formal contract in respect of such work is reasonably assured.
Sales by Segment and Sales by Geography. The sales information in this presentation that is presented on a segment or geographic basis are supplementary financial measures and are used to present AGI's sales
by segment, product group and geography.
Total Capital Expenditures (or Total Capex) is a non-IFRS financial measure and its most directly comparable financial measure that is disclosed in our consolidated financial statements is Acquisition of Property,
Plant, and Equipment. Total Capital Expenditures is defined as the sum of Acquisition of property, plant and equipment and Development and purchase of intangible assets and Acquisitions, net of cash acquired.
Management believes that Total Capital Expenditures is a useful measure to evaluate AGI’s investment activity. The following table reconciles Acquisition of Property, Plant, and Equipment to Total Capital
Expenditures for the year ended December 31, 2021:
Total Capital Expenditures
(thousands of dollars) 31-Dec-21
Acquisition of property, plant and equipment 28,676
Development and purchase of intangible assets 16,890
Acquisitions, net of cash acquired 12,865
Total Capital Expenditures 58,431
60PRESENTATION OF FINANCIAL INFORMATION
Total Net Debt is a non-IFRS financial measure and its most directly comparable financial measure that is disclosed in our consolidated financial statements is Long-Term Debt. Total Net Debt is defined as the sum of
long-term debt, convertible unsecured subordinated debentures, senior unsecured subordinated debentures, and lease liabilities less cash and cash equivalents. Management believes that Total Net Debt is a useful
measure to evaluate AGI's capital structure and to provide a measurement of AGI's total indebtedness. The following table reconciles Long Term Debt to Total Net Debt as at March 31, 2019, 2020, 2021 and 2022,
June 30, 2019, 2020, 2021 and 2022, September 30, 2019, 2020, 2021 and 2022 and December 31, 2019, 2020 and 2021:
Total Net Debt
Q1/19 Q2/19 Q3/19 Q4/19 Q1/20 Q2/20 Q3/20 Q4/20 Q1/21 Q2/21 Q3/21 Q4/21 Q1/22 Q2/22 Q3/22
(thousands of dollars) 31-Mar-19 30-Jun-19 30-Sep-19 31-Dec-19 31-Mar-20 30-Jun-20 30-Sep-20 31-Dec-20 31-Mar-21 30-Jun-21 30-Sep-21 31-Dec-21 31-Mar-22 30-Jun-22 30-Sep-22
Long Term Debt 397,502 402,350 435,126 393,128 403,935 427,486 454,851 409,373 409,894 466,083 449,341 434,541 520,465 534,846 504,466
Convertible Unsecured Subordinated
286,518 236,091 237,094 238,833 165,216 165,907 166,608 167,319 168,040 168,770 169,511 179,533 181,293 180,406 181,929
Debentures
Senior Unsecured Subordinated
82,124 82,494 82,660 165,474 247,789 248,229 248,656 249,079 249,542 249,978 250,421 250,872 251,330 251,795 252,269
Debentures
Leases 8,513 7,877 9,752 9,349 11,922 16,929 17,911 16,842 16,840 18,670 19,641 22,279 33,734 35,046 37,338
Less: Cash & Cash Equivalents 90,079 14,085 20,948 48,421 3,603 22,897 74,825 62,456 48,748 55,175 48,610 61,307 60,234 55,201 42,384
Total Net Debt 684,578 714,727 743,684 758,363 825,259 835,654 813,201 780,157 795,568 848,326 840,304 825,918 926,588 946,892 933,618
Total Net Debt / LTM (last 12 month) Adjusted EBITDA Ratio is a non-IFRS ratio and is defined as Total Net Debt divided by Adjusted EBITDA for the last twelve months period. Total Net Debt / LTM Adjusted
EBITDA is a non-IFRS ratio because its components, Total Net Debt and Adjusted EBITDA, are non-IFRS financial measures. Management believes Total Net Debt / LTM Adjusted EBITDA is a useful measure to
assess AGI's leverage position.
61You can also read