Neural responses to naturalistic clips of behaving animals in two different task contexts - bioRxiv
←
→
Page content transcription
If your browser does not render page correctly, please read the page content below
bioRxiv preprint first posted online Feb. 20, 2018; doi: http://dx.doi.org/10.1101/268144. The copyright holder for this preprint
 (which was not peer-reviewed) is the author/funder, who has granted bioRxiv a license to display the preprint in perpetuity.
                                  It is made available under a CC-BY 4.0 International license.

   Neural responses to naturalistic clips of behaving animals in two different task contexts

   Samuel A. Nastase1,2*, Yaroslav O. Halchenko1, Andrew C. Connolly3, M. Ida Gobbini1,4, James
   V. Haxby1
   1
    Department of Psychological and Brain Sciences, Dartmouth College, Hanover, NH, USA
   2
    Princeton Neuroscience Institute, Princeton University, Princeton, NJ, USA
   3
    Department of Neurology, Geisel School of Medicine at Dartmouth, Hanover, NH, USA
   4
    Dipartimento di Medicina Specialistica, Diagnostica e Sperimentale (DIMES), Medical School,
   University of Bologna, Bologna, Italy

   *Correspondence:
   Samuel A. Nastase
   sam.nastase@gmail.com

   Running title: Neural responses to animal clips

   The human brain rapidly deploys semantic information during perception to facilitate our
   interaction with the world. These semantic representations are encoded in the activity of
   distributed populations of neurons (Haxby et al., 2001; Kriegeskorte et al., 2008b; McClelland
   and Rogers, 2003) and command widespread cortical real estate (Binder et al., 2009; Huth et
   al., 2012). The neural representation of a stimulus can be described as a location (i.e., response
   vector) in a high-dimensional neural representational space (Haxby et al., 2014; Kriegeskorte
   and Kievit, 2013). This resonates with behavioral and theoretical work describing mental
   representations of objects and actions as being organized in a multidimensional psychological
   space (Attneave, 1950; Edelman, 1998; Gärdenfors and Warglien, 2012; Shepard, 1958, 1987).
   Current applications of this framework to neural representation (e.g., Kriegeskorte et al., 2008b)
   often implicitly assume that these neural representational spaces are relatively fixed and
   context-invariant. In contrast, earlier work emphasized the importance of attention and task
   demands in actively reshaping representational space (Kruschke, 1992; Nosofsky, 1986;
   Shepard, 1964; Tversky, 1977).

   Here we present functional MRI data measured while participants freely viewed brief
   naturalistic video clips of animals behaving in their natural environments (Nastase et al., 2017).
   Participants performed a 1-back category repetition detection task requiring them to attend to
   either animal behavior or taxonomy. There are several benefits to using dynamic, naturalistic
   stimuli. They convey rich perceptual and semantic information (Bartels and Zeki, 2004; Huth et
   al., 2012) and more fully sample neural representational space than conventional stimuli (Haxby
   et al., 2014). Furthermore, natural vision paradigms have greater ecological validity (Felsen and
   Dan, 2005), and dynamic stimuli have been shown to drive reliable neural responses across
   individuals (Hasson et al., 2010; Haxby et al., 2011). These data are intended to provide a test
   bed for investigating how task demands alter the neural representation of complex stimuli and
   their semantic qualities.

                                                                                                                                    1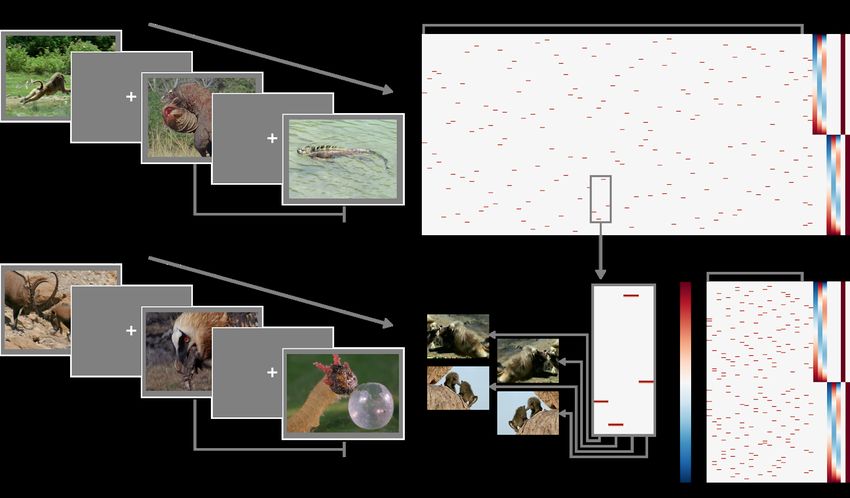
bioRxiv preprint first posted online Feb. 20, 2018; doi: http://dx.doi.org/10.1101/268144. The copyright holder for this preprint
 (which was not peer-reviewed) is the author/funder, who has granted bioRxiv a license to display the preprint in perpetuity.
                                  It is made available under a CC-BY 4.0 International license.

   Twelve right-handed adults (seven female; mean age = 25.4 years, SD = 2.6, range = 21–31)
   with normal or corrected-to-normal vision were sampled from the Dartmouth College
   community to participate in the experiment. Participants reported no history of psychiatric or
   neurological disorders. All participants provided written, informed consent prior to participating
   in the study in compliance with the Committee for the Protection of Human Subjects at
   Dartmouth College, including a provision for data to be shared with other researchers around
   the world or on a publicly available data archive. The study was approved by the Institutional
   Review Board of Dartmouth College, and participants received monetary compensation for
   their participation. All data were collected between June 1 and September 6, 2013.

   We implemented a full factorial repeated measures design (Fisher, 1935) comprising five
   taxonomic categories, four behavioral categories, and two tasks. The five taxonomic categories
   were primates, ungulates, birds, reptiles, and insects. The four behavioral categories were
   eating, fighting, running, and swimming. Crossing the taxonomy and behavior factors yielded
   20 total taxonomy–behavior conditions. The animal taxonomy (i.e., object/form category) and
   behavior (i.e., action/motion category) factors were chosen as these are thought to rely on
   somewhat distinct, relatively well-studied neural pathways (Connolly et al., 2012; Giese and
   Poggio, 2003; Oosterhof et al., 2013; Sha et al., 2015; Wurm et al., 2017). The taxonomic and
   behavioral categories roughly correspond to intermediate levels of noun and verb hierarchies
   (Fellbaum, 1990; Rosch, 1975). We designed the experiment under the assumption that the
   stimulus dimensions conveying taxonomic and behavioral information are not integral (i.e.,
   producing facilitation or interference across factors; Garner and Felfoldy, 1970). However, this
   may not hold in practice; for example, some taxonomic features may be necessary for behavior
   categorization, and certain taxa (e.g., birds) may interfere with the recognition of certain
   behaviors (e.g., running). While the taxonomy and behavior factors are fully crossed at the
   category level, it is not feasible to orthogonalize lower-level correlates (e.g., motion energy, the
   specific animal performing each action) in natural vision paradigms.

   Each of the 20 taxonomy–behavior conditions comprised two unique 2 s video clips, as well as
   horizontally flipped versions of each clip for 80 visually unique stimuli in total. Video clip stimuli
   were sampled from nature documentaries (Life, Life of Mammals, Microcosmos, Planet Earth)
   and high-resolution YouTube videos. Video clips were edited using the free FFmpeg software
   package for handling multimedia files (https://www.ffmpeg.org). Stimuli were back-projected
   onto a screen located at the back of the scanner bore using a Panasonic PT-D4000U projector
   and viewed via a mirror mounted on the head coil. Video clips subtended a visual angle of
   ~16.5 degrees horizontally and ~11 degrees vertically. Stimuli were presented using PsychoPy
   (v1.76.00; http://www.psychopy.org; Peirce, 2007).

                                                                                                                                    2
bioRxiv preprint first posted online Feb. 20, 2018; doi: http://dx.doi.org/10.1101/268144. The copyright holder for this preprint
(which was not peer-reviewed) is the author/funder, who has granted bioRxiv a license to display the preprint in perpetuity.
It is made available under a CC-BY 4.0 International license.
Figure 1 | Experimental design. (A) Schematic of the rapid event-related design for both
taxonomy attention and behavior attention task conditions. In the taxonomy attention task,
participants were instructed to press a button if they observed a taxonomic category repetition
(e.g., two consecutive clips depicting reptiles; upper). In the behavior attention task,
participants were instructed to press a button if they observed a behavioral category repetition
(e.g., two consecutive clips depicting animals eating; lower). (B) Two example design matrices
for predicting hemodynamic responses to the clips over the course of two runs with the
taxonomy attention task. In the condition-rich design, each of 80 visually unique stimuli
receives a separate predictor (following Kriegeskorte et al., 2008a; upper), while in the category
design, the four exemplar clips per taxonomy–behavior condition are collapsed to form 20
category predictors (following Nastase et al., 2017; lower). Hypothesized neural responses are
convolved with a simple hemodynamic response function (Cohen, 1997). In this simple
example, nuisance regressors for taxonomy and behavior repetition events, first- through
third-order Legendre polynomials, and run constants are appended to each design matrix.
Figures were created using Matplotlib (https://matplotlib.org; Hunter, 2007) and seaborn
(https://seaborn.pydata.org; Waskom et al., 2016).
In designing the experiment we adopted a condition-rich ungrouped-events design
(Kriegeskorte et al., 2008a). Each trial consisted of a 2 s video clip presented without sound
followed by a 2 s fixation period for a trial onset asynchrony of 4 s. Each of the 80 stimuli was
presented once each run. This type of design has been argued to be particularly efficient for
characterizing the pairwise distances between neural response patterns (Aguirre, 2007;
Kriegeskorte et al., 2008a). When convolved with a hemodynamic response function, this
design matrix will yield highly overlapping response predictors. The response magnitude for
3bioRxiv preprint first posted online Feb. 20, 2018; doi: http://dx.doi.org/10.1101/268144. The copyright holder for this preprint
(which was not peer-reviewed) is the author/funder, who has granted bioRxiv a license to display the preprint in perpetuity.
It is made available under a CC-BY 4.0 International license.
each condition can be recovered using a conventional regression model (e.g., Nastase et al.,
2017), or regularized regression can be used to predict responses based on an explicit model
of stimulus features (e.g., Nishimoto et al., 2011). Each of the 80 unique stimuli can be treated
as a separate condition (Kriegeskorte et al., 2008a), or 20 conditions can be defined at the
category level by collapsing across the four exemplar clips per taxonomy–behavior condition
(Nastase et al., 2017).
In addition to the 80 stimuli, each run included four taxonomy repetition events, four behavior
repetition events, and four null fixation events. This resulted in 92 events per run, plus an
additional 12 s fixation appended to the beginning and end of each run, for a total run duration
of 392 s (~6.5 min). Ten unique runs were created and run order was counterbalanced across
participants using a Latin square (Fisher, 1935). Each run was constructed in the following way.
First, a pseudorandom trial order containing all 80 stimuli and no taxonomic or behavioral
category repetitions was assembled. Second, eight additional stimuli were inserted at particular
locations in the trial order to induce four taxonomic category repetition events and four
behavioral category repetitions events. Note that in one run an error occurred where a behavior
repetition event was inserted that interrupted a previously inserted taxonomic repetition event;
this error went unnoticed during data collection but is explicitly noted in text files
accompanying the data. These sparse repetition events were inserted such that a repetition
event of both types occurred within each quarter of the run. We ensured that the same clip
exemplar (or the horizontally mirrored version) never occurred twice consecutively, and that for
each taxonomic or behavioral category repetition, the repetition stimulus varied along the other
dimension. Finally, four 2 s null events comprising only a fixation cross were inserted at
pseudorandom locations in the trial order to effect temporal jittering. One of the four null
fixation events occurred each quarter of the run and did not interrupt repetition events. This
resulted in an overall scan duration of ~65 min.
Prior to scanning, participants were verbally familiarized with the task and the categories. At
the beginning of each run, participants received written instructions indicating that they should
pay attention to either taxonomy or behavior and press the button only when they observed a
category repetition of that type. Participants were informed that they should ignore repetitions
of the unattended type during that run. Button presses were only required for the sparse
repetition events (not for non-repetitions) and the same button was used for repetitions of both
types. Although responses were collected for repetition events to ensure task compliance, this
task was not intended to robustly measure response latencies. We use the term attention
loosely here, as performing the 1-back category repetition detection task also requires
categorization, working memory, and motor processes. Participants were instructed to maintain
fixation only during the fixation periods, and freely viewed the video clip stimuli (cf. Çukur et al.,
2013). Behavioral responses for repetition events were collected using a single two-button
Lumina LS-PAIR response pad (Cedrus, San Pedro, CA) held in the right hand.
All functional and structural images were acquired using a 3 T Philips Intera Achieva MRI
scanner (Philips Healthcare, Bothell, WA) with a 32-channel phased-array head coil. Functional,
blood-oxygenation-level-dependent (BOLD) images were acquired in an interleaved fashion
4bioRxiv preprint first posted online Feb. 20, 2018; doi: http://dx.doi.org/10.1101/268144. The copyright holder for this preprint
(which was not peer-reviewed) is the author/funder, who has granted bioRxiv a license to display the preprint in perpetuity.
It is made available under a CC-BY 4.0 International license.
using gradient-echo echo-planar imaging with a SENSE parallel imaging factor of 2
(Pruessmann et al., 1999): TR/TE = 2000/35 ms, flip angle = 90°, resolution = 3 mm3 isotropic,
matrix size = 80 × 80, FoV = 240 × 240 mm, 42 transverse slices with full brain coverage and
no gap. At the beginning of each run, two dummy scans were acquired to allow for signal
stabilization. Ten runs were collected for each participant, each consisting of 196 functional
volumes totaling 392 s (~6.5 min) in duration. At the end of each session, a T1-weighted
structural scan was acquired using a high-resolution single-shot MPRAGE sequence: TR/TE =
8.2/3.7 ms, flip angle = 8°, resolution = 0.9375 × 0.9375 × 1.0 mm3 voxels, matrix size = 256 ×
256, FoV = 240 × 240 × 220 mm3. The BOLD signal reflects metabolic demands and serves as
a rough proxy for neural activity (primarily local field potentials; Logothetis et al., 2001).
All data have been curated and organized according to the Brain Imaging Data Structure (BIDS)
standards (Gorgolewski et al., 2016), and are freely available via the OpenNeuro repository
(https://openneuro.org; Poldrack and Gorgolewski, 2017). Data are version-controlled and
conveniently accessible using the DataLad data distribution (http://datalad.org; Halchenko et
al., 2017) from their original location at http://datasets.datalad.org/?dir=/labs/haxby/attention,
as well as from OpenNeuro at https://openneuro.org/datasets/ds001087/versions/00002 and
OpenfMRI at https://openfmri.org/dataset/ds000233. According to the BIDS conventions, data
are stored in separate directories for each participant alongside the scripts used to compile the
data, a descriptive text file, and a tab-separated text file describing participant demographics.
Within each participant’s directory, anatomical and functional images are stored in separate
directories. Both anatomical and functional images are stored in compressed Neuroinformatics
Informatics Technology Initiative (NIfTI-1) format (Cox et al., 2003). Structural images were
de-faced for anonymization purposes using an automated masking procedure (Hanke et al.,
2014). Each functional run is accompanied by a file describing the acquisition parameters as
well as a tab-separated text file describing following for each event: the filename of the clip
stimulus, the onset time, duration (2 s), taxonomy–behavior condition, taxonomic category, and
behavioral category of the stimulus, as well as whether the stimulus was horizontally mirrored,
and whether the event was a repetition or not (and of what type). Participant-specific button
presses and their associated response times are also included in the table. Derived data,
resulting from preprocessing or other analyses are stored separately in the top-level directory
and recapitulate a similar directory structure.
Behaviorally, participants reported category repetitions with high accuracy (99% for both tasks,
as reported in Nastase et al., 2017). Although this suggests that participants allocated attention
sufficiently to perform the task, it precludes investigators from relating the magnitude of
attentional demands to neural responses. We did not design the experiment with a “baseline”
or “no task” condition, as it is unclear what this would entail in the context of natural vision
paradigms, and any claims about task demands must rely on relative differences between the
two tasks.
Organizing data in the standardized BIDS format facilitates the use of portable analysis tools
called BIDS Apps (Gorgolewski et al., 2017). To assess the general quality of the data, we used
the MRIQC tool (v0.9.6; https://github.com/poldracklab/mriqc; Esteban et al., 2017). Across all
5bioRxiv preprint first posted online Feb. 20, 2018; doi: http://dx.doi.org/10.1101/268144. The copyright holder for this preprint
(which was not peer-reviewed) is the author/funder, who has granted bioRxiv a license to display the preprint in perpetuity.
It is made available under a CC-BY 4.0 International license.
participants and runs, median temporal signal-to-noise ratio (tSNR) was 64.73 (range:
31.06–89.14), which approximates the expected tSNR given 3 mm isotropic voxels and 3 T
magnetic field strength (Triantafyllou et al., 2005), and is comparable to existing data sets (e.g.,
Sengupta et al., 2016). Mean framewise displacement (Power et al., 2012) was on average 0.15
mm (range: 0.10–0.44 mm) across participants and runs, indicating fairly low head motion.
To verify that events were annotated correctly, we performed a simple multivariate analysis.
Data were first preprocessed using the fmriprep BIDS App (v1.0.0-rc5;
https://github.com/poldracklab/fmriprep; Esteban et al., 2017), a Nipype-based tool
(Gorgolewski et al., 2011). Cortical surfaces were reconstructed from anatomical scans using
FreeSurfer (v6.0.0; https://surfer.nmr.mgh.harvard.edu; Dale et al., 1999) and spatially
normalized to the fsaverage6 template based on sulcal curvature (Fischl et al., 1999).
Functional images were corrected for slice-timing (Cox, 1996), head motion (Jenkinson et al.,
2002), and aligned to the anatomical image (Greve and Fischl, 2009). Functional data were not
explicitly spatially smoothed. We then used a general linear model implemented in AFNI
(v17.1.02; https://afni.nimh.nih.gov; Cox, 1996) to estimate response patterns for the 20
taxonomy–behavior conditions in each run per task. Nuisance regressors comprised framewise
displacement (Power et al., 2012), the first six principal components from an automatic
anatomical segmentation of cerebrospinal fluid (aCompCor; Behzadi et al., 2007; Zhang et al.,
2001), and de-meaned head motion parameters and their derivatives, regressors for repetition
events and button presses, as well as first- through third-order Legendre polynomials.
We then used linear support vector machines (SVMs; Boser et al., 1992; Chang and Lin, 2011)
in surface-based searchlights (10 mm radius; Kriegeskorte et al., 2006; Oosterhof et al., 2011)
to classify taxonomic and behavioral categories. We used a leave-one-category-out
cross-classification approach in both cases: to classify the five taxonomic categories, we
trained SVMs on three of the four behavior categories and tested on the left-out behavior
category (Figure 2A); to classify the four behavioral categories, we trained SVMs on four of the
five taxonomic categories and tested on the left-out taxonomic category (Figure 2B). This
approach requires that information about, e.g., behavioral categories, encoded in local
response patterns generalizes across both stimuli and taxonomic categories (Kaplan et al.,
2015; Nastase et al., 2016; Westfall et al., 2016). All multivariate analyses were performed using
PyMVPA (v2.6.3.dev1; http://www.pymvpa.org; Hanke et al., 2009) in the NeuroDebian
computational environment (Debian “jessie” 8.5 GNU/Linux with NeuroDebian repositories;
http://neuro.debian.net; Hanke and Halchenko, 2011), making heavy use of SciPy
(https://www.scipy.org; Jones et al., 2001), NumPy (http://www.numpy.org; Walt et al., 2011),
and the IPython interactive shell (https://ipython.org; Perez and Granger, 2007). All scripts used
to perform these analyses are provided alongside the data. The resulting searchlight maps
corroborate prior work on action and taxonomic category representation (e.g., Connolly et al.,
2012; Nastase et al., 2017; Wurm et al., 2017), and demonstrate the potential utility of the data
set.
6bioRxiv preprint first posted online Feb. 20, 2018; doi: http://dx.doi.org/10.1101/268144. The copyright holder for this preprint
(which was not peer-reviewed) is the author/funder, who has granted bioRxiv a license to display the preprint in perpetuity.
It is made available under a CC-BY 4.0 International license.
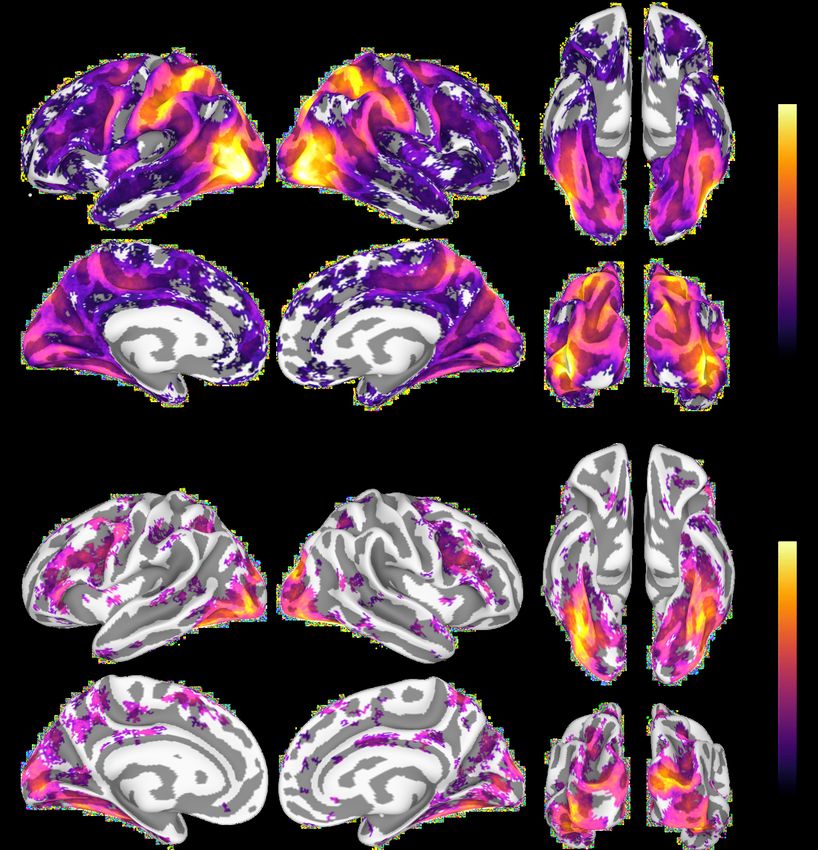
Figure 2 | Behavioral and taxonomic category cross-classification using surface-based
searchlights. To statistically evaluate the searchlight results, we first computed a one-sample
t-test against theoretical chance accuracy per searchlight (one-tailed test). We corrected for
multiple tests by controlling the false discovery rate (FDR) at q = .05 (Benjamini and Hochberg,
1995; Genovese et al., 2002). The mean classification accuracy across participants is plotted
and searchlight maps are thresholded at FDR q = .05. (A) Searchlight classification of
behavioral categories cross-validated across taxonomic categories while participants attended
to animal behavior. Theoretical chance accuracy for four-way behavioral category classification
is .25. The maximum mean searchlight accuracy for behavioral category classification was .56
7bioRxiv preprint first posted online Feb. 20, 2018; doi: http://dx.doi.org/10.1101/268144. The copyright holder for this preprint
(which was not peer-reviewed) is the author/funder, who has granted bioRxiv a license to display the preprint in perpetuity.
It is made available under a CC-BY 4.0 International license.
in left lateral occipitotemporal cortex (inferior occipital gyrus). (B) Searchlight classification of
taxonomic categories cross-validated across behavioral categories while participants attended
to animal taxonomy. Theoretical chance accuracy for five-way taxonomic category
classification is .20. The maximum mean searchlight accuracy for taxonomic category
classification was .36 in right ventral temporal cortex (lateral fusiform gyrus). Although we used
a t-test here for simplicity, note that the t-test may yield significant t-values even for
near-chance accuracies, and a permutation- or prevalence-based approach may be preferable
in some cases (cf. Allefeld et al., 2016; Etzel, 2017; Stelzer et al., 2013). Surface vertices on the
medial wall were excluded from the analysis and clusters of fewer than ten contiguous
significant vertices after thresholding were excluded for visualization purposes. Surface data
were visualized using SUMA (Saad et al., 2004) and figures were created using GIMP
(https://www.gimp.org) and Inkscape (https://inkscape.org).
Conflict of Interest Statement
The authors declare that the research was conducted in the absence of any commercial or
financial relationships that could be construed as a potential conflict of interest.
Author Contributions
SAN, JVH, ACC, and MIG designed the experiment; SAN collected and analyzed the data;
SAN, YOH, and JVH wrote the manuscript; SAN and YOH curated the data for public sharing.
Funding
This work was supported by the National Institute of Mental Health at the National Institutes of
Health (grant numbers F32MH085433-01A1 to ACC; and 5R01MH075706 to JVH), and the
National Science Foundation (grant numbers NSF1129764 and NSF1607845 to JVH).
Acknowledgments
We thank Jason Gors, Kelsey G. Wheeler, Matteo Visconti di Oleggio Castello, J. Swaroop
Guntupalli, Courtney Rogers, and Terry Sackett for assistance in collecting stimuli and data.
References
Aguirre, G. K. (2007). Continuous carry-over designs for fMRI. NeuroImage 35, 1480–1494. doi:
10.1016/j.neuroimage.2007.02.005
Allefeld, C., Görgen, K., & Haynes, J. D. (2016). Valid population inference for
information-based imaging: From the second-level t-test to prevalence inference.
NeuroImage 141, 378–392. doi: 10.1016/j.neuroimage.2016.07.040
Attneave, F. (1950). Dimensions of similarity. Am. J. Psychol. 63, 516–556. doi:
10.2307/1418869
Bartels, A., and Zeki, S. (2004). Functional brain mapping during free viewing of natural scenes.
Hum. Brain Mapp. 21, 75–85. doi: 10.1002/hbm.10153
Behzadi, Y., Restom, K., Liau, J., and Liu, T. T. (2007). A component based noise correction
method (CompCor) for BOLD and perfusion based fMRI. NeuroImage 37, 90–101. doi:
8bioRxiv preprint first posted online Feb. 20, 2018; doi: http://dx.doi.org/10.1101/268144. The copyright holder for this preprint
(which was not peer-reviewed) is the author/funder, who has granted bioRxiv a license to display the preprint in perpetuity.
It is made available under a CC-BY 4.0 International license.
10.1016/j.neuroimage.2007.04.042
Benjamini, Y., and Hochberg, Y. (1995). Controlling the false discovery rate: a practical and
powerful approach to multiple testing. J. R. Stat. Soc. Series B Stat. Methodol. 57,
289–300.
Binder, J. R., Desai, R. H., Graves, W. W., and Conant, L. L. (2009). Where is the semantic
system? A critical review and meta-analysis of 120 functional neuroimaging studies.
Cereb. Cortex 19, 2767–2796. doi: 10.1093/cercor/bhp055
Boser, B. E., Guyon, I. M., and Vapnik, V. N. (1992). “A training algorithm for optimal margin
classifiers” In Proceedings of the Fifth Annual Workshop on Computational Learning
Theory, ed. D. Haussler, Pittsburgh, PA, 144–152. doi: 10.1145/130385.130401
Chang, C.-C., and Lin, C.-J. (2011). LIBSVM: a library for support vector machines. ACM Trans.
Intell. Syst. Technol. 2:27. doi: 10.1145/1961189.1961199
Cohen, M. S. (1997). Parametric analysis of fMRI data using linear systems methods.
NeuroImage 6, 93–103. doi: 10.1006/nimg.1997.0278
Connolly, A. C., Guntupalli, J. S., Gors, J., Hanke, M., Halchenko, Y. O., Wu, Y.-C., Abdi, H.,
and Haxby, J. V. (2012). The representation of biological classes in the human brain. J.
Neurosci. 32, 2608–2618. doi: 10.1523/jneurosci.5547-11.2012
Cox, R. W. (1996). AFNI: software for analysis and visualization of functional magnetic
resonance neuroimages. Comput. Biomed. Res. 29, 162–173. doi:
10.1006/cbmr.1996.0014
Cox, R. W., Ashburner, J., Breman, H., Fissell, K., Haselgrove, C., Holmes, C. J., Lancaster, J.
L. et al. (2003). “A (sort of) new image data format standard: NIfTI-1,” in 10th Annual
Meeting of the Organization for Human Brain Mapping, Budapest, Hungary.
http://nifti.nimh.nih.gov/nifti-1/documentation/hbm_nifti_2004.pdf
Çukur, T., Nishimoto, S., Huth, A. G., and Gallant, J. L. (2013). Attention during natural vision
warps semantic representation across the human brain. Nat. Neurosci. 16, 763–770. doi:
10.1038/nn.3381
Dale, A. M., Fischl, B., and Sereno, M. I. (1999). Cortical surface-based analysis: I.
Segmentation and surface reconstruction. NeuroImage 9, 179–194. doi:
10.1006/nimg.1998.0395
Edelman, S. (1998). Representation is representation of similarities. Behav. Brain Sci. 21,
449–467.
Esteban, O., Birman, D., Schaer, M., Koyejo, O. O., Poldrack, R. A., and Gorgolewski, K. J.
(2017). MRIQC: Advancing the automatic prediction of image quality in MRI from unseen
sites. PLOS ONE 12:e0184661. doi: 10.1371/journal.pone.0184661
Etzel, J. A. (2017). “MVPA significance testing when just above chance, and related properties
of permutation tests”, in 2017 International Workshop on Pattern Recognition in
9bioRxiv preprint first posted online Feb. 20, 2018; doi: http://dx.doi.org/10.1101/268144. The copyright holder for this preprint
(which was not peer-reviewed) is the author/funder, who has granted bioRxiv a license to display the preprint in perpetuity.
It is made available under a CC-BY 4.0 International license.
Neuroimaging (PRNI), Toronto, Canada. doi: 10.1109/prni.2017.7981498
Fellbaum, C. (1990). English verbs as a semantic net. Int. J. Lexicogr. 3, 278–301. doi:
10.1093/ijl/3.4.278
Felsen, G., and Dan, Y. (2005). A natural approach to studying vision. Nat. Neurosci. 8,
1643–1646. doi: 10.1038/nn1608
Fischl, B., Sereno, M. I., Tootell, R. B., and Dale, A. M. (1999). High-resolution intersubject
averaging and a coordinate system for the cortical surface. Hum. Brain Mapp. 8, 272–284.
doi: 10.1002/(SICI)1097-0193(1999)8:43.0.CO;2-4
Fisher, R. A. (1935). The Design of Experiments. Edinburgh: Oliver and Boyd.
Gärdenfors, P., and Warglien, M. (2012). Using conceptual spaces to model actions and events.
J. Semant. 29, 487–519. doi: 10.1093/jos/ffs007
Garner, W. R., and Felfoldy, G. L. (1970). Integrality of stimulus dimensions in various types of
information processing. Cogn. Psychol. 1, 225–241. doi: 10.1016/0010-0285(70)90016-2
Genovese, C. R., Lazar, N. A., & Nichols, T. (2002). Thresholding of statistical maps in functional
neuroimaging using the false discovery rate. NeuroImage 15, 870–878. doi:
10.1006/nimg.2001.1037
Giese, M. A., and Poggio, T. (2003). Neural mechanisms for the recognition of biological
movements. Nat. Rev. Neurosci. 4, 179–192. doi: 10.1038/nrn1057
Gorgolewski, K., Burns, C. D., Madison, C., Clark, D., Halchenko, Y. O., Waskom, M. L., and
Ghosh, S. S. (2011). Nipype: a flexible, lightweight and extensible neuroimaging data
processing framework in python. Front. Neuroinform. 5:13. doi: 10.3389/fninf.2011.00013
Gorgolewski, K. J., Alfaro-Almagro, F., Auer, T., Bellec, P., Capotă, M., Chakravarty, M. M.,
Churchill, N. W. et al. (2017). BIDS apps: Improving ease of use, accessibility, and
reproducibility of neuroimaging data analysis methods. PLOS Comput. Biol. 13:e1005209.
Doi: doi.org/10.1371/journal.pcbi.1005209
Gorgolewski, K. J., Auer, T., Calhoun, V. D., Craddock, R. C., Das, S., Duff, E. P., Flandin, G. et
al. (2016). The brain imaging data structure, a format for organizing and describing outputs
of neuroimaging experiments. Sci. Data 3:160044. doi: 10.1038/sdata.2016.44
Greve, D. N., and Fischl, B. (2009). Accurate and robust brain image alignment using
boundary-based registration. NeuroImage 48, 63–72. doi:
10.1016/j.neuroimage.2009.06.060
Halchenko, Y. O., Hanke, M., Poldrack, B., Solanky, D. S., Alteva, G., Gors, J., Häusler, C. O.,
Waite, A., and Christian, H. (2017). datalad/datalad 0.9.1. doi: 10.5281/zenodo.1000098
Hanke, M., Baumgartner, F. J., Ibe, P., Kaule, F. R., Pollmann, S., Speck, O., Zinke, W., and
Stadler, J. (2014). A high-resolution 7-Tesla fMRI dataset from complex natural stimulation
with an audio movie. Sci. Data 1:140003. doi: 10.1038/sdata.2014.3
Hanke, M., and Halchenko, Y. O. (2011). Neuroscience runs on GNU/Linux. Front. Neuroinform.
10bioRxiv preprint first posted online Feb. 20, 2018; doi: http://dx.doi.org/10.1101/268144. The copyright holder for this preprint
(which was not peer-reviewed) is the author/funder, who has granted bioRxiv a license to display the preprint in perpetuity.
It is made available under a CC-BY 4.0 International license.
5:8. doi: 10.3389/fninf.2011.00008
Hanke, M., Halchenko, Y. O., Sederberg, P. B., Hanson, S. J., Haxby, J. V., and Pollmann, S.
(2009). PyMVPA: A python toolbox for multivariate pattern analysis of fMRI data.
Neuroinformatics 7, 37–53. doi: 10.1007/s12021-008-9041-y
Hasson, U., Malach, R., and Heeger, D. J. (2010). Reliability of cortical activity during natural
stimulation. Trends Cogn. Sci. 14, 40–48. doi: 10.1016/j.tics.2009.10.011
Haxby, J. V., Connolly, A. C., and Guntupalli, J. S. (2014). Decoding neural representational
spaces using multivariate pattern analysis. Annu. Rev. Neurosci. 37, 435–456. doi:
10.1146/annurev-neuro-062012-170325
Haxby, J. V., Gobbini, M. I., Furey, M. L., Ishai, A., Schouten, J. L., and Pietrini, P. (2001).
Distributed and overlapping representations of faces and objects in ventral temporal
cortex. Science 293, 2425–2430. doi: 10.1126/science.1063736
Haxby, J. V., Guntupalli, J. S., Connolly, A. C., Halchenko, Y. O., Conroy, B. R., Gobbini, M. I.,
Hanke, M., and Ramadge, P. J. (2011). A common, high-dimensional model of the
representational space in human ventral temporal cortex. Neuron 72, 404–416. doi:
10.1016/j.neuron.2011.08.026
Hunter, J. D. (2007). Matplotlib: A 2D graphics environment. Comput. Sci. Eng. 9, 90–95. doi:
10.1109/mcse.2007.55
Huth, A. G., Nishimoto, S., Vu, A. T., and Gallant, J. L. (2012). A continuous semantic space
describes the representation of thousands of object and action categories across the
human brain. Neuron 76, 1210–1224. doi: 10.1016/j.neuron.2012.10.014
Jenkinson, M., Bannister, P., Brady, M., and Smith, S. (2002). Improved optimization for the
robust and accurate linear registration and motion correction of brain images. NeuroImage
17, 825–841. doi: 10.1006/nimg.2002.1132
Jones, E., Oliphant, T., and Peterson, P. (2001). SciPy: open source scientific tools for Python.
http://www.scipy.org.
Kaplan, J. T., Man, K., and Greening, S. G. (2015). Multivariate cross-classification: applying
machine learning techniques to characterize abstraction in neural representations. Front.
Hum. Neurosci. 9:151. doi: 10.3389/fnhum.2015.00151
Kriegeskorte, N., Goebel, R., and Bandettini, P. (2006). Information-based functional brain
mapping. Proc. Natl. Acad. Sci. U. S. A. 103, 3863–3868. doi: 10.1073/pnas.0600244103
Kriegeskorte, N., and Kievit, R. A. (2013). Representational geometry: integrating cognition,
computation, and the brain. Trends Cogn. Sci. 17, 401–412. doi:
10.1016/j.tics.2013.06.007
Kriegeskorte, N., Mur, M., and Bandettini, P. A. (2008a). Representational similarity
analysis—connecting the branches of systems neuroscience. Front. Syst. Neurosci. 2:4.
doi: 10.3389/neuro.06.004.2008
11bioRxiv preprint first posted online Feb. 20, 2018; doi: http://dx.doi.org/10.1101/268144. The copyright holder for this preprint
(which was not peer-reviewed) is the author/funder, who has granted bioRxiv a license to display the preprint in perpetuity.
It is made available under a CC-BY 4.0 International license.
Kriegeskorte, N., Mur, M., Ruff, D. A., Kiani, R., Bodurka, J., Esteky, H., Tanaka, K., and
Bandettini, P. A. (2008b). Matching categorical object representations in inferior temporal
cortex of man and monkey. Neuron 60, 1126–1141. doi: 10.1016/j.neuron.2008.10.043
Kruschke, J. K. (1992). ALCOVE: an exemplar-based connectionist model of category learning.
Psychol. Rev. 99, 22–44. doi: 10.1037/0033-295X.99.1.22
Logothetis, N. K., Pauls, J., Augath, M., Trinath, T., and Oeltermann, A. (2001).
Neurophysiological investigation of the basis of the fMRI signal. Nature 412, 150–157. doi:
10.1038/35084005
McClelland, J. L., and Rogers, T. T. (2003). The parallel distributed processing approach to
semantic cognition. Nat. Rev. Neurosci. 4, 310–322. doi: 10.1038/nrn1076
Nastase, S. A., Connolly, A. C., Oosterhof, N. N., Halchenko, Y. O., Guntupalli, J. S., Visconti di
Oleggio Castello, M., Gors, J., Gobbini, M. I., Haxby, J. V. (2017). Attention selectively
reshapes the geometry of distributed semantic representation. Cereb. Cortex 27,
4277–4291. doi: 10.1093/cercor/bhx138
Nastase, S. A., Halchenko, Y. O., Davis, B., and Hasson, U. (2016). “Cross-modal searchlight
classification: methodological challenges and recommended solutions,” in 2016
International Workshop on Pattern Recognition in Neuroimaging (PRNI), Trento, Italy. doi:
10.1109/prni.2016.7552355
Nishimoto, S., Vu, A. T., Naselaris, T., Benjamini, Y., Yu, B., and Gallant, J. L. (2011).
Reconstructing visual experiences from brain activity evoked by natural movies. Curr. Biol.
21, 1641–1646. doi: 10.1016/j.cub.2011.08.031
Nosofsky, R. M. (1986). Attention, similarity, and the identification–categorization relationship.
J. Exp. Psychol. Gen. 115, 39–57. doi: 10.1037/0096-3445.115.1.39
Oosterhof, N. N., Tipper, S. P., and Downing, P. E. (2013). Crossmodal and action-specific:
neuroimaging the human mirror neuron system. Trends Cogn. Sci. 17, 311–318. doi:
10.1016/j.tics.2013.04.012
Oosterhof, N. N., Wiestler, T., Downing, P. E., and Diedrichsen, J. (2011). A comparison of
volume-based and surface-based multi-voxel pattern analysis. NeuroImage 56, 593–600.
doi: 10.1016/j.neuroimage.2010.04.270
Peirce, J. W. (2007). PsychoPy—Psychophysics software in Python. J. Neurosci. Methods 162,
8–13. doi: 10.1016/j.jneumeth.2006.11.017
Perez, F., and Granger, B. E. (2007). IPython: a system for interactive scientific computing.
Computing in Science Engineering 9, 21–29. doi: 10.1109/mcse.2007.53
Poldrack, R. A., and Gorgolewski, K. J. (2017). OpenfMRI: open sharing of task fMRI data.
NeuroImage 8, 259–261. doi: 10.1016/j.neuroimage.2015.05.073
Power, J. D., Barnes, K. A., Snyder, A. Z., Schlaggar, B. L., and Petersen, S. E. (2012). Spurious
but systematic correlations in functional connectivity MRI networks arise from subject
12bioRxiv preprint first posted online Feb. 20, 2018; doi: http://dx.doi.org/10.1101/268144. The copyright holder for this preprint
(which was not peer-reviewed) is the author/funder, who has granted bioRxiv a license to display the preprint in perpetuity.
It is made available under a CC-BY 4.0 International license.
motion. NeuroImage 59, 2142–2154. doi: 10.1016/j.neuroimage.2011.10.018
Pruessmann, K. P., Weiger, M., Scheidegger, M. B., Boesiger, P., and Others (1999). SENSE:
sensitivity encoding for fast MRI. Magn. Reson. Med. 42, 952–962. doi:
10.1002/(SICI)1522-2594(199911)42:53.0.CO;2-S
Rosch, E. (1975). Cognitive representations of semantic categories. J. Exp. Psychol. Gen. 104,
192–233. doi: 10.1037/0096-3445.104.3.192
Saad, Z. S., Reynolds, R. C., Argall, B., Japee, S., and Cox, R. W. (2004). “SUMA: An interface
for surface-based intra- and inter-subject analysis with AFNI,” in 2004 2nd IEEE
International Symposium on Biomedical Imaging: Macro to Nano, Arlington, Virginia, USA.
doi: 10.1109/isbi.2004.1398837.
Sengupta, A., Kaule, F. R., Guntupalli, J. S., Hoffmann, M. B., Häusler, C., Stadler, J., and
Hanke, M. (2016). A studyforrest extension, retinotopic mapping and localization of higher
visual areas. Sci. Data 3:160093. doi: 10.1038/sdata.2016.93
Sha, L., Haxby, J. V., Abdi, H., Guntupalli, J. S., Oosterhof, N. N., Halchenko, Y. O., and
Connolly, A. C. (2015). The animacy continuum in the human ventral vision pathway. J.
Cogn. Neurosci. 27, 665–678. doi: 10.1162/jocn_a_00733
Shepard, R. N. (1958). Stimulus and response generalization: tests of a model relating
generalization to distance in psychological space. J. Exp. Psychol. 55, 509–523. doi:
10.1037/h0042354
Shepard, R. N. (1964). Attention and the metric structure of the stimulus space. J. Math.
Psychol. 1, 54–87. doi: 10.1016/0022-2496(64)90017-3
Shepard, R. N. (1987). Toward a universal law of generalization for psychological science.
Science 237, 1317–1323. doi: 10.1126/science.3629243
Stelzer, J., Chen, Y., and Turner, R. (2013). Statistical inference and multiple testing correction in
classification-based multi-voxel pattern analysis (MVPA): random permutations and cluster
size control. NeuroImage 65, 69–82. doi: 10.1016/j.neuroimage.2012.09.063
Triantafyllou, C., Hoge, R. D., Krueger, G., Wiggins, C. J., Potthast, A., Wiggins, G. C., and
Wald, L. L. (2005). Comparison of physiological noise at 1.5 T, 3 T and 7 T and optimization
of fMRI acquisition parameters. NeuroImage 26, 243–250. doi:
10.1016/j.neuroimage.2005.01.007
Tversky, A. (1977). Features of similarity. Psychol. Rev. 84, 327. doi:
10.1037/0033-295X.84.4.327
Walt, S. van der, Colbert, S. C., and Varoquaux, G. (2011). The NumPy array: a structure for
efficient numerical computation. Comput. Sci. Eng. 13, 22–30. doi: 10.1109/mcse.2011.37
Waskom, M. L., Botvinnik, O., O’Kane, D., Hobson, P., Halchenko, Y. O., Lukauskas, S. Cole J.
B. et al. (2016). seaborn: v0.7.1. doi: 10.5281/zenodo.54844
Westfall, J., Nichols, T. E., and Yarkoni, T. (2016). Fixing the stimulus-as-fixed-effect fallacy in
13bioRxiv preprint first posted online Feb. 20, 2018; doi: http://dx.doi.org/10.1101/268144. The copyright holder for this preprint
(which was not peer-reviewed) is the author/funder, who has granted bioRxiv a license to display the preprint in perpetuity.
It is made available under a CC-BY 4.0 International license.
task fMRI. Wellcome Open Res. 1:23. doi: 10.12688/wellcomeopenres.10298.2
Wurm, M. F., Caramazza, A., and Lingnau, A. (2017). Action categories in lateral
occipitotemporal cortex are organized along sociality and transitivity. J. Neurosci. 37,
562–575. doi: 10.1523/jneurosci.1717-16.2016
Zhang, Y., Brady, M., and Smith, S. (2001). Segmentation of brain MR images through a hidden
Markov random field model and the expectation-maximization algorithm. IEEE Trans. Med.
Imag. 20, 45–57. doi: 10.1109/42.906424
14You can also read