NATURAL GAS LIQUIDS ( NGLS) IN NORTH AMERICA: AN UPDATE PART I - UPSTREAM - Study No. 139 May 2014
←
→
Page content transcription
If your browser does not render page correctly, please read the page content below
Study No. 139
                                                                        May 2014

CANADIAN       NATURAL GAS LIQUIDS (NGLS) IN
ENERGY
RESEARCH       NORTH AMERICA: AN UPDATE
INSTITUTE
               PART I - UPSTREAM

       Canadian Energy Research Institute | Relevant • Independent • Objective
NATURAL GAS LIQUIDS (NGLs) IN NORTH AMERICA: AN UPDATE
                  PART I – UPSTREAM
Natural Gas Liquids (NGLs) in North America: An Update
Part I - Upstream

Copyright © Canadian Energy Research Institute, 2014
Sections of this study may be reproduced in magazines and newspapers with acknowledgement
to the Canadian Energy Research Institute

ISBN 1-927037-19-5

Author:     Carlos A. Murillo

Acknowledgements:
The author wishes to acknowledge the support and contributions of Peter Howard and Megan
Murphy in the production, reviewing, and editing of this report.

Julie Dalzell and Anthony Mersich provided most of the research and material on the United
States’ sections. Staff from RBAC Inc. (Sherman Oaks, California) and RBN Energy LLC (Houston,
Texas) provided feedback and data for cross-referencing and due diligence purposes on the
United States.

Additionally, industry peer-reviewers from across the integrated oil and gas, midstream, and
consulting segments provided valuable feedback and suggestions that helped make these
reports more relevant, independent, and objective in accordance with CERI’s mandate.

CANADIAN ENERGY RESEARCH INSTITUTE
150, 3512 – 33 Street NW
Calgary, Alberta T2L 2A6
Canada
www.ceri.ca

May 2014
Printed in Canada

Front cover photo’s courtesy of
http://www.huskyenergy.com/news/photolibrary/westerncanadaconventional.asp; Pembina Pipeline Corporation,
Corporate Update January 2014; and http://www.lyondellbasell.com/News/PhotosforMediaUse/
Natural Gas Liquids (NGLs) in North America: An Update                                                                             iii
Part I - Upstream

Table of Contents
LIST OF FIGURES .............................................................................................................       v
INTRODUCTION .............................................................................................................          1
EXECUTIVE SUMMARY ....................................................................................................              3
CANADIAN NATURAL GAS LIQUIDS (NGLs) PRODUCTION (2002-2012) .............................                                            5
    Gas Plant NGL Production .................................................................................................      6
    Refinery LPG Production ....................................................................................................    8
    Oil Sands Upgraders SGL Production .................................................................................           12
UNITED STATES NGL PRODUCTION (2002-2012) ..............................................................                            19
    Gas Plant NGL Production ..................................................................................................    22
    Refinery LPG Production ....................................................................................................   23
ANALYSIS: CANADIAN GAS PRODUCERS ADAPTING TO CHANGING NATURAL GAS
    MARKET DYNAMICS IN NORTH AMERICA ..................................................................                            27
    Physical Changes: Emerging Supply Sources, Inter-basin and Intra-basin
        Gas-on-Gas Competition ..............................................................................................      27
    Economics: Gas Prices, Exchange Rates, Transportation Tolls, Supply
        Costs Efficiencies and NGL Uplift .................................................................................        42
APPENDIX I – WESTERN CANADA SHALE BASINS ............................................................                              51
APPENDIX II – US PETROLEUM ADMINISTRATION DEFENSE DISTRICTS
    AND SHALE BASINS ...................................................................................................           52
APPENDIX III – NORTH AMERICAN NATURAL GAS MARKET INFRASTRUCTURE .................                                                  53

                                                                                                                            May 2014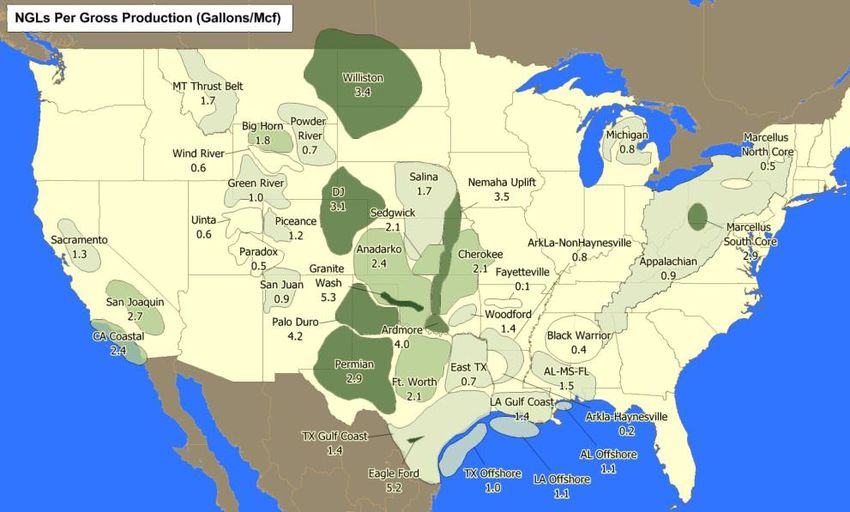
iv         Canadian Energy Research Institute

May 2014

Natural Gas Liquids (NGLs) in North America: An Update v
Part I - Upstream
List of Figures
1.1 Sources of Natural Gas Liquids (NGLs) in Canada ........................................................ 5
1.2 Canadian NGL Production by Source and 2012 % Share of Total ................................ 6
1.3 Gas Plants NGL Production by Liquid and 2012 % Share of Total ............................... 7
1.4 Gas Plants NGL Production by Province and 2012 % Share of Total ........................... 8
1.5 Refined Petroleum Products from Canadian Refineries and 2012 % Share of Total .. 8
1.6 Refinery LPG Production by Liquid and 2012 % Share of Total ................................... 9
1.7 Refinery LPG Production by Region and 2012 % Share of Total .................................. 10
1.8 Refining Capacity and Crude Runs in Ontario and Quebec ......................................... 11
1.9 Crude Runs by Type in Western and Atlantic Canada ................................................. 12
1.10 Synthetic Crude Oil Production in Western Canada by Project and Area ................... 13
1.11 Upgrader Off-gas Production by Project and Area ...................................................... 14
1.12 Off-gas Supply and Disposition and 2012 % Share of Total ......................................... 15
1.13 SGLs Potential by Area and Type ................................................................................. 16
1.14 Upgrader Off-gas SGL Extraction Estimates and 2012 % Share of Total ..................... 17
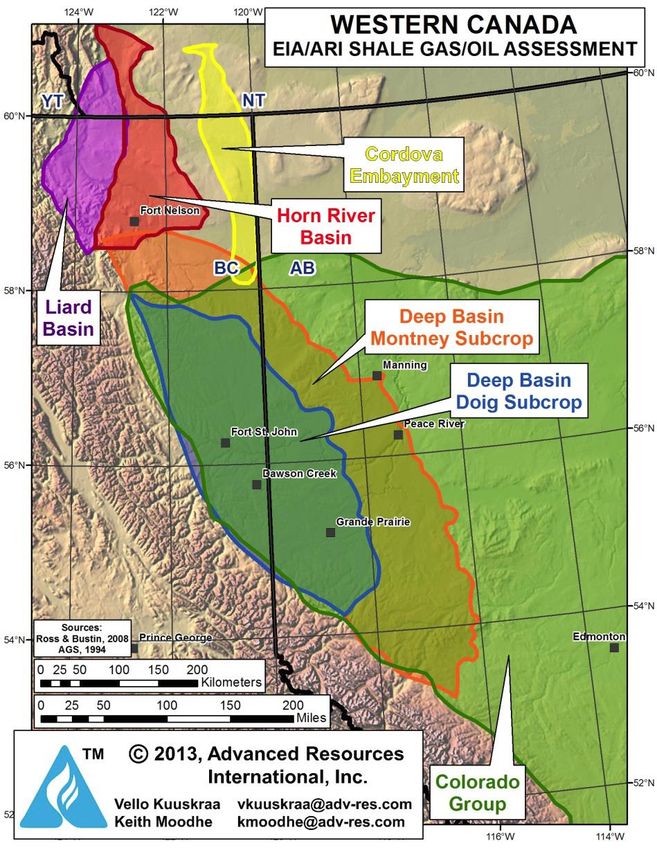
2.1 Shale Plays in the Lower 48 States............................................................................... 19
2.2 Average GPM of Shale Plays in the Lower 48 States ................................................... 20
2.3 US NGL Production by Source and 2012 % Share of Total .......................................... 21
2.4 Gas Plant NGL Production by Liquid and 2012 % Share of Total ................................. 22
2.5 Gas Plant NGL Production by PADD and 2012 % Share of Total ................................. 22
2.6 PADD I Production, Demand and Net Inflow from Other Regions .............................. 23
2.7 Refined Petroleum Products and 2012 % Share of Total ............................................ 24
2.8 Refinery LPG Production by Liquid and 2012 % Share of Total ................................... 24
2.9 Refinery LPG Production by PADD and 2012 % Share of Total .................................... 25
3.1 Canadian Marketable Natural Gas Supply and Disposition and
2012 % Share of Total .................................................................................................. 28
3.2 Natural Gas Demand in Canada by Sector and by Province and
2012 % Share of Total .................................................................................................. 29
3.3 US Natural Gas Production by Source and by Shale Play ............................................ 30
3.4 US Natural Gas Demand by Sector, Imports and Trade with Canada ......................... 32
3.5 US Natural Gas Demand by PADD Region, and 2012 % Share of Total / US Shale
Gas Basins, Production Areas, and Traditional Natural Gas Flows .............................. 34
3.6 Canadian/US Border Natural Gas Flows ...................................................................... 36
3.7 British Columbia Marketable Natural Gas Supply and Disposition and
2012 % Share of Total .................................................................................................. 37
3.8 WCSB Marketable Production and Outflows, by Pipeline, and Alliance
Pipeline Receipts by Area............................................................................................. 39
3.9 Alberta Marketable Natural Gas Supply and Disposition and
2012 % Share of Total .................................................................................................. 40
3.10 HH & AECO Natural Gas Prices, Basis Differentials, and CAN/US Exchange
Rate / TCPL Mainline Sample Tolls and Estimated Flows ............................................ 43
May 2014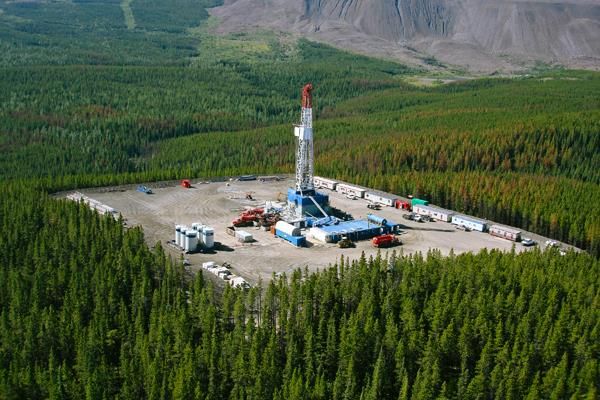
vi                                                                                   Canadian Energy Research Institute

3.11   Multi-well Pad Drilling Illustrations and Supply Cost Efficiencies, Multi-frac
       States Illustration and Supply Cost Efficiencies, and WCSB and North
       American Half-cycle Gas Economics ............................................................................   45
3.12   Energy Prices, Evolving Gas Drilling Patterns in the WCSB, and Liquids
       Yields and Gas Production in AB by Area .....................................................................    47
3.13   WCSB Raw Gas and NGL Production Indices, and Gas Processing Metrics .................                            49

May 2014
Natural Gas Liquids (NGLs) in North America: An Update                                                                  1
Part I - Upstream

Introduction
This report is part of an update to CERI Study No. 130: Natural Gas Liquids (NGLs) in North
America: Overview and Outlook to 2035, published in the summer of 20121 (the NGLs study).

Given the high level of interest from various audiences, CERI has undertaken the task to update
its NGLs overview and outlook by incorporating and considering various issues and trends that
have developed since Study No. 130 was first published. Furthermore, given the importance of
natural gas supply and demand dynamics in the outlook for NGLs, CERI is incorporating four
natural gas scenarios developed over the last year and outlined in a recently published CERI
report: Study No. 138: North American Natural Gas Pathways.2

This is the first of five parts (or reports) that make up the NGL update. Parts I-III will focus on a
discussion of historical data (2002 to 2012) as well as currently evolving trends that are shaping
NGL markets in both Canada and the United States (US).3 This report (Part I) will provide context
in regards to production of NGLs from different sources (upstream), Part II discusses existing and
evolving NGL infrastructure and NGL end-users (midstream and downstream), while Part III
discusses supply and demand (S/D) balances for each NGL, as well as pricing and economics.

These reports will be complemented with a discussion of what CERI believes to be some of the
most relevant issues currently transforming NGL markets. The first section of each report will
focus on Canada while the second chapter will focus on the US, with a Canadian-focused
analysis presented in the final section of each report.

Given the increased importance of global energy markets and continued demand increases in
the Asia-Pacific region, Part IV will discuss NGLs in the global context as well as opportunities
and challenges for Canadian NGLs/petrochemicals in global markets and the importance of the
Asia-Pacific region as a target market.

Part V will use the insights from this overview and emerging trends analysis (Parts I-IV) in order
to develop an outlook for NGLs in North America based on the four natural gas scenarios. A
discussion of the outlook methodology will be presented in that report, and each NGL will be
discussed in the context of a supply and demand balance outlook based on the different
scenarios. Lastly, Part V will include a discussion on what the different outlook scenarios mean
for different industries that rely on NGLs in terms of opportunities, challenges, and possible
future prospects.

The scenario-based approach has been chosen as it allows CERI to consider a range of
possibilities in the context of NGLs availability and demand in a long-term timeframe.

1
  Available at: http://ceri.ca/images/stories/2012-08-21_CERI_Study_130_NGLs_In_North_America.pdf
2
  Available at: http://ceri.ca/images/stories/2013-09-05_CERI_Study_No__138_-_North_American_Natural_Gas_Pathways.pdf
3
  With a more in-depth focus on Canada

                                                                                                            May 2014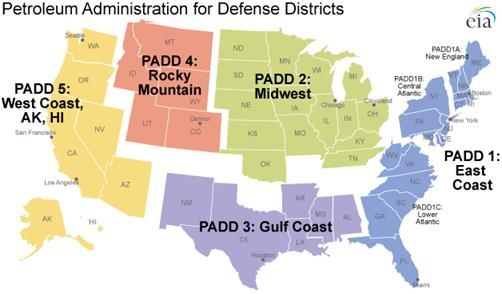
2                                                                Canadian Energy Research Institute

This is in contrast to a base case scenario (Study No. 130) whereby results were given around a
general set of assumptions and where there were possibilities of significant downside or upside
revisions on the results given the sensitivity of certain key variables. The scenario-based
approach thus allows for a broader examination of possible outcomes.

While Study No. 130 was an introduction to NGLs in North America and served the purpose of
generating awareness on the importance of NGLs within the context of the energy industry in
North America, this report assumes a certain level of understanding of NGL markets and will
focus on more specific issues.

May 2014
Natural Gas Liquids (NGLs) in North America: An Update                                                                 3
Part I - Upstream

Executive Summary
Canada is one of the world’s largest producers of natural gas liquids (NGLs),4 with output
originating primarily at gas processing plants, but also crude oil refineries, oil sands upgrader
off-gas processing plants, and at the field level as field or wellhead condensate.

Between 2002 and 2012, total NGL production levels in Canada fluctuated with peak levels
reached at close to 760 thousand barrels per day (kb/d) in 2007, ensued by a declining trend
and a trough of 657 kb/d in 2010, a point from which production levels have turned around to
reach close to 680 kb/d by 2012.

While production of NGLs from natural gas plants5 accounted for 91 percent of total Canadian
NGL production in 2012, declining volumes of liquefied petroleum gases (LPG) 6 from refineries,
due to a combination of refinery closures and changes in the crude slate, have contributed to
overall NGLs declining volumes. Meanwhile, production of synthetic gas liquids (SGLs)7 from off-
gas processing plants has increased rapidly, driven by strong oil sands activity and synthetic
crude oil production (SCO), not only supporting overall NGL production levels, but also providing
an alternative source of NGLs and large potential for further future growth in NGLs extraction
volumes. Refineries accounted for 7 percent of Canada’s NGL production in 2012 while off-gas
plants accounted for 2 percent.

Gas plants’ NGL production comes primarily from Western Canadian provinces with almost all
extraction occurring in Alberta (AB) (90 percent of gas plants’ NGLs) and British Columbia (BC) (9
percent), where ethane and propane (combined) accounted for about 2/3 of the gas plant NGL
barrel in 2012. Given the significance of gas plants’ NGL production, an understanding of issues
affecting natural gas production volumes in these provinces is the foundation of understanding
factors that will affect NGLs production in years to come.

In the United States (US), overall NGL production levels (from gas plants and refineries
combined) were on a flat to declining trend until around 2008 (2,414 kb/d) from which point
extraction of NGLs from gas plants accelerated rapidly and led to total NGL production levels of
over 3,000 kb/d by 2012. Increased production of gas plants’ NGLs in the US has in turn been
the result of rapid increases in natural gas production volumes from unconventional sources
(including shale, tight, and coalbed methane formations) led by process innovation around
production (such as horizontal drilling and hydraulic fracturing), but also due to underlying
commodity pricing conditions that have favoured extraction of NGL-rich or wet gas. Production
of NGLs from gas plants accounted for 80 percent of total US NGL production in 2012.

4
  Includes ethane (C2H6), propane (C3H8), butanes (n-C4H10 and i-C4H10), and pentanes plus/condensate (C5+)
5
  Includes field plants, straddle plants, fractionators, and field condensate
6
  Propane and butanes
7
  Mix of paraffinic (NGLs) and olefinic (ethylene, propylene, butylene, and olefinic condensate) hydrocarbons

                                                                                                                May 2014
4 Canadian Energy Research Institute Given the US’ role as Canada’s main trading partner in goods and services, but more importantly, energy commodities; increasing natural gas production volumes unmatched by equivalent demand increases in the US has meant that import requirements continue to decrease. While US demand for gas has increased, primarily in the power generation sector, supply increases have far outpaced demand increases, displacing costly overseas liquefied natural gas (LNG) imports first, followed by Canadian gas in various traditional markets including the US Upper Midwest and US Northeast markets. Furthermore, Eastern Canadian markets which were traditionally served by Western Canada’s gas, are increasingly meeting their own needs by acquiring closer US-sourced gas. In Canada, gas demand has increased, driven by increases in the power generation and industrial sectors (including oil sands), but demand increases have not been large enough to compensate for increasing US imports and lost US export volumes, leading WCSB producers to scale back on production activities and to look for alternative markets both domestically and abroad (as LNG). These changes in market fundamentals point to a rapidly evolving natural gas market in North America and a re-organization of flow patterns from producing areas to market centers. While various economic factors have also affected WCSB producers including volatile prices, currency exchange rate fluctuations, and increasing transportation tolls (amongst others), supply cost efficiencies and monetization of NGLs have become important components of WCSB producers profitability and competitiveness strategies in the North American market. This has led to a unique situation in the upstream context of Canadian NGLs whereby overall gas production levels have continued to decline while NGL production volumes are recovering, increasing rapidly, and expected to continue to do so over the long-term. Going forward, understanding the demand for Canadian gas across North America and possibly in the global market (as LNG), as well as natural gas prices, the composition of the gas, and the focus of producers’ on given areas of the WCSB, will help in shaping the expected volumes of NGLs available for extraction in the WCSB. NGL availability will be the foundation for different NGL outlook scenarios that will be presented in Part V of the NGLs study update. But understanding changes in natural gas markets and NGL availability needs to be complemented by an understanding of NGL infrastructure; NGL markets supply, demand, pricing, and economics (market fundamentals), but also an understanding of global NGL markets. These subjects are discussed in Parts II – IV of the NGLs update. May 2014
Natural Gas Liquids (NGLs) in North America: An Update                                                                  5
Part I - Upstream

Canadian Natural Gas Liquids (NGLs)
Production (2002-2012)
It is important to clarify from the onset that within the Canadian context, the definition of
natural gas liquids (NGLs) includes hydrocarbon liquids recovered from the raw natural gas
stream at gas processing plants,8 liquefied petroleum gases (LPGs) from crude oil refining,9
synthetic gas liquids (SGLs) recovered from oil sands upgrader off-gases, and liquids recovered
at the wellhead level such as field condensate (as seen on Figure 1.1). These, in turn, include
ethane (C2H6, or C2), propane (C3H8, or C3), butanes (normal (n-C4H10) and iso-butane (i-C4H10),
(or C4s), as well as pentanes plus10 (pentanes plus and condensate) (C5+).

                      Figure 1.1: Sources of Natural Gas Liquids (NGLs) in Canada

                             Natural Gas, Crude Oil, and Crude Bitumen

                                 Refinery Liquefied                                              Upgrader Synthetic
    Gas Processing
                                 Petroleum Gases                   Wellhead or Field             Gas Liquids (SGLs)
     Plant Liquids
                                       (LPGs)                      Condensate (C5+)
    (C2, C3, C4s, C5+)                                                                            (NGLs/Olefins Mix)
                                  (Primarily C3, C4s)

Source: CERI

Canada is one of the world’s largest producers of NGLs,11 yet between 2002 and 2012
production has fallen from a level of 765 thousand barrels per day (kb/d) to 677 kb/d, or by
about 10 percent (-88 kb/d net). From the start of the 2002 to 2012 timeframe, production
peaked at 765 kb/d followed by a decline trend and a second peak of 757 kb/d by 2007, after
which a declining trend ensued. By 2010, a low of about 660 kb/d was observed. Over the last
couple of years, that trend has reversed and production is once again increasing.

As can be observed in Figure 1.2, the majority of natural gas liquids (around 91 percent in 2012)
were produced at natural gas processing plants,12 while the remaining (nine percent or so) were
produced at both refineries and upgraders (in that order).13

8
  Including field plants, straddle plants, and fractionators but also field condensate
9
  Mainly propane and butanes
10
   Generally includes pentanes, hexanes, and heptanes
11
   See: International Energy Agency (IEA), Natural Gas Liquids, Supply Outlook 2008 – 2015, April 2010:
http://www.iea.org/Textbase/npsum/NGL2010SUM.pdf
Oil & Gas Journal (OGJ), Rapid North American shale gas development pushes up global capacities:
http://www.ogj.com/articles/print/volume-111/issue-6/special-report--worldwide-gas-processing/rapid-north-american-shale-
gas-development.html
12
   Includes field condensates, as well as NGLs produced at field plants, straddle plants, and fractionators

                                                                                                               May 2014
6 Canadian Energy Research Institute
Figure 1.2: Canadian NGL Production by Source (kb/d) (2002-2012) and 2012 % Share of Total
900
765 757
800 729 744 735 737
699 677
664 657 666
700
600
91%
7%
500
kb/d
2%
400
300
Upgraders SGLs Mix
200 Refineries LPGs
Gas Plants/ Gas Production NGLs
100 Gas Plants/ Gas Production NGLs
Total NGLs
- Refineries LPGs
2002 2003 2004 2005 2006 2007 2008 2009 2010 2011 2012 Upgraders SGLs Mix
14 15 16 17
Source: Data from AER, AESRD, BCMNGD, Statistics Canada, and CERI Estimates. Figures by CERI
To understand these trends, it is important to discuss each source of NGL production as well as
the respective driving forces behind these trends.
Gas Plant NGL Production
Production of NGLs from natural gas processing plants depends on a series of factors that are
intrinsically tied to trends in natural gas production.
These include (but are not limited to) the type of gas reserves being developed and their
respective composition, which in turn dictates the amount of liquids available in the gas being
produced; the amount (volumes) of gas being produced and processed; the efficiency of gas
processing plants to recover the liquids in the raw gas; and the demand and markets for each
liquid. These will be further elaborated upon in the analysis section.
Figure 1.3 illustrates the production of NGLs from natural gas processing plants.
13
On a percentage basis by NGL, in 2012 ethane accounted for 32% of the total 681 kb/d of NGLs production, followed by
propane (31%), pentanes plus (21%), and butanes (16%)
14
Alberta Energy Regulator (AER): Data & Publications, Statistical Reports (ST): ST3: Alberta Energy Resources Industries
Monthly Statistics; ST39: Alberta Mineable Oil Sands Plant Statistics Monthly Supplement; ST98: Alberta’s Energy Reserves &
Supply/Demand Outlook.
Available at: http://www.aer.ca/data-and-publications/statistical-reports
15
Alberta Environment and Sustainable Resource Development (AESRD): Oil Sands Information Portal (OSIP):
http://environment.alberta.ca/apps/osip/
16
British Columbia Ministry of Natural Gas Development: Oil and Gas Division, Monthly Statistics:
http://www.empr.gov.bc.ca/OG/oilandgas/statistics/Pages/MonthlyStatistics.aspx
17
Table 131-0002: Supply of natural gas liquids and sulphur products from processing plants; Table 132-0001: Supply and
demand for natural gas liquids and liquefied petroleum gases. Available at: http://www5.statcan.gc.ca/subject-sujet/result-
resultat.action?pid=1741&id=2026&lang=eng&type=ARRAY&pageNum=1&more=0
May 2014Natural Gas Liquids (NGLs) in North America: An Update 7
Part I - Upstream
Figure 1.3: Gas Plants NGL Production by Liquid (kb/d) (2002-2012) and 2012 % Share of Total
800
695 686
658 671 671 669
700 631
598 599 614
587
600 35%
30%
500
kb/d
400
300
200
Pentanes+/ Condensate Butanes 12%
100 Propane Ethane 23%
Gas Plants NGLs
-
2002 2003 2004 2005 2006 2007 2008 2009 2010 2011 2012 Ethane Propane Pentanes+/ Condensate Butanes
Source: Data from AER, BCMNGD, Statistics Canada, and CERI Estimates. Figures by CERI
As can be observed, NGL production from natural gas processing plants follows the same trend
that total NGL production exhibits. Given the large share of gas plant production of NGLs (>90
percent), it could be suggested that production from gas plant NGLs is the main driver behind
the overall NGL production trend.
However, the rate of decline in NGL production from gas plants over the 2002 to 2012
timeframe has been lower than the overall decline (-81 kb/d) suggesting it has not been the
only cause for the overall NGL production decreasing trend.
It can also be observed that light NGLs (C2 & C3) accounted for 65 percent of the total NGLs
produced at gas plants in 2012 compared to 35 percent for the heavier ends (C4s & C5+). These
percentages were consistent through the decade, and are also similar to percentages for overall
Canadian NGL production.
Figure 1.4 illustrates production of gas plants’ NGLs by province in the same timeframe,18
together with their respective shares for 2012. As can be observed, Alberta (AB) and British
Columbia (BC) together accounted for 99 percent of NGL production from natural gas
processing plants.
While not readily apparent, one underlying trend in Figure 1.4 is that the main declines in NGL
production from gas plants have occurred in AB and Nova Scotia (NS), while BC NGL production
volumes remained relatively flat until 2010 at which point they started to increase rapidly. This
is consistent with natural gas production trends in these respective areas.
18
Unless otherwise noted, the analysis presented in Parts I-IV are discussed in the 2002 to 2012 timeframe
May 20148 Canadian Energy Research Institute
Figure 1.4: Gas Plants NGL Production by Province (kb/d) (2002-2012) and
2012 % Share of Total
800
695 686
658 671 671 669
700 631
598 599 614
587
600
500 9%
kb/d
400
90% 1%
Saskatchewan
300
Nova Scotia 0%
200 British Columbia
Alberta
100
Gas Plants NGLs
-
2002 2003 2004 2005 2006 2007 2008 2009 2010 2011 2012 Alberta British Columbia Nova Scotia Saskatchewan
Source: Data from AER, BCMNGD, Statistics Canada, and CERI Estimates. Figures by CERI
The main takeaway in regards to NGL production from gas processing plants is that the overall
level of NGL production is largely (but not solely) affected by production of NGLs from gas
plants, where ethane and propane are the largest components of the NGL barrel (about 2/3),
and whereby regionally, BC and AB account for almost all the production of gas plant NGLs.
Refinery LPG Production
LPGs are a minor portion of the output from crude oil refineries as seen in Figure 1.5.
Figure 1.5: Refined Petroleum Products from Canadian Refineries (kb/d)19 (2002-2012) and
2012 % Share of Total
2,500 Aviation gasoline (7)
Naphtha specialties (6)
2,250 2,127 2,159
2,096 2,118 Stove oil, kerosene (11)
2,051 2,064 2,031 2,016
1,971 Butane & butane mixes (4)
2,000 1,911 1,934
Petroleum coke (16) 2%1%
4%
1,750 Lubricating oils and greases (17) 4%
Propane & propane mixes (3) 4%
1,500 Other petroleum products (20) 36%
4%
Still gas (18)
kb/d
1,250 4%
Asphalt (15)
Aviation turbo fuel
1,000 7%
Petro-chemical feedstocks (5)
750 Light fuel oil (13)
7%
Heavy fuel oil (14)
500 Diesel fuel oil (12)
Motor gasoline (8) 26%
250
Crude Runs
Total RPPs
-
2002 2003 2004 2005 2006 2007 2008 2009 2010 2011 2012
20
Source: Data from Statistics Canada. Figures by CERI.
19
The difference between crude runs and RPPs production is due to volumetric gains as RPPs tend to be lighter than the crude
oil from which they are produced
May 2014Natural Gas Liquids (NGLs) in North America: An Update 9
Part I - Upstream
In 2012, propane and butanes, together, accounted for only three percent of total refined
petroleum products (RPPs) from Canadian refineries. Meanwhile, motor gasoline, diesel fuel, as
well as heavy and light fuel oils, combined, accounted for 75 percent of total output.
Figure 1.5 also illustrates that production of RPPs has decreased from 2,051 kb/d in 2002 to
1,934 kb/d by 2012, or by six percent. While exports of RPPs have increased slightly over the
same timeframe, so have imports (at a faster pace than exports), resulting in net exports of
RPPs remaining flat to decreasing. Given a flat net export trend and lower overall production,
this suggests that implied demand for RPPs in Canada (production + imports – exports) has
decreased over the last decade.21 Lower demand for RPPs in turn results in a lower need for
crude runs at Canadian refineries.
As seen in Figure 1.6, production of LPGs from refineries has declined by 22 percent between
2002 and 2012 (-14 kb/d net), suggesting that declines in refinery LPG volumes are partly
responsible for overall NGL production volume declines.
Figure 1.6: Refinery LPG Production by Liquid (kb/d) (2002-2012) and 2012 % Share of Total
70 64 64 63
60 59
57 58
60 56 56 56
50
50 61%
40
kb/d
30
20 39%
10
Butanes Propane Refinery production
-
2002 2003 2004 2005 2006 2007 2008 2009 2010 2011 2012 Propane Butanes
Source: Data from Statistics Canada. Figures by CERI
Regionally, refinery LPG production is consistent with the distribution of refining capacity in
Canada as seen in Figure 1.7.22
20
Table 134-0001: Refinery supply of crude oil and equivalent. Available at: http://www5.statcan.gc.ca/subject-sujet/result-
resultat.action?pid=1741&id=2026&lang=eng&type=ARRAY&pageNum=1&more=0
Table 134-0004: Supply and disposition of refined petroleum products. Available at: http://www5.statcan.gc.ca/subject-
sujet/result-resultat.action?pid=1741&id=3527&lang=eng&type=ARRAY&pageNum=1&more=0
21
Production has in fact decreased for all RPPs except for diesel fuel oil, heavy fuel oil, and products under the other petroleum
products category
22
Refinery capacity will be further discussed in the infrastructure section
May 201410 Canadian Energy Research Institute
Figure 1.7: Refinery LPG Production by Region (kb/d) (2002-2012) and 2012 % Share of Total
70 64 64 63
60 58 59
57 56 56 56
60
50 36%
50 23%
40
kb/d
30
6%
20 18%
17%
10 SK & BC Quebec Alberta
Ontario Atlantic Canada Total Refinery LPGs
- Atlantic Canada Ontario Alberta
2002 2003 2004 2005 2006 2007 2008 2009 2010 2011 2012 Quebec SK & BC
Source: Data from Statistics Canada and CERI estimates. Figures by CERI
Furthermore, Figure 1.7 shows that on a regional basis, refinery LPGs production has declined in
regions like Ontario (ON), Alberta and Quebec (QC); remained steady in British Columbia and
Saskatchewan (SK), and increased in Atlantic Canada (NFLD, NS, and NB).
CERI has identified at least two factors that are believed to be responsible for this trend.
In regards to Ontario and Quebec (Central Canada), refinery closures over the past decade at
Oakville and Montreal, respectively, have resulted in less crude being processed in this region.
Lower crude runs (see Figure 1.8) have in turn resulted in lower production of RPPs overall, and
therefore, lower production of refinery LPGs in these areas of the country.
With the future prospect of the Dartmouth, NS23 and Come by Chance, NFLD24 refineries
possibly closing down over the next few years, this trend could continue to be observed in other
areas of the country as well (mainly Atlantic Canada).
On the other hand, the construction of a new upgrading refining/complex in AB 25 (and possibly
BC26), as well as a gas-to-liquids (GTL) plant (Sasol), could offset some of those lost LPG volumes
on the refining side of NGL production in Canada.
23
Imperial Oil, Media: Imperial Oil to Convert Dartmouth Refinery to Terminal: http://www.imperialoil.ca/Canada-
English/about_media_releases_20130619.aspx
24
September 17, 2013: Calgary Herald: Update: Harvest refinery on block says report. Refining glut makes sale of Come by
Chance facility unlikely: analyst. Accessed at: http://www.calgaryherald.com/business/energy-
resources/Harvest+refinery+block+says+report/8923564/story.html?__lsa=19d7-b103, on September 17, 2013
Given the fate of various refineries in the Atlantic basin over the last few years, it would not be unreasonable to assume that if
the refinery fails to find a buyer, it will be shut down and turned into a terminal operation
25
See: North West Upgrading, Investor Presentation, November 2012:
http://www.northwestupgrading.com/images/pdf/presentations/nwu%20investor%20pres%20nov%202012.pdf
26
See: Kitimat Clean Ltd.: http://kitimatclean.ca/
May 2014Natural Gas Liquids (NGLs) in North America: An Update 11
Part I - Upstream
Figure 1.8: Refining Capacity and Crude Runs in Ontario (L) & Quebec (R) (kb/d) (2002-2012)
600 Petro-Canada Products 600
Shell Canada Products (Montreal) Closure
488 (Oakville) Closure
500 462 464 500
416 430 423 430 430
400 397 412 412
379 388
400 368 369 363 370 400
338 353 349
335
kb/d
kb/d
300 300
200 Crude Capacity 200 Crude Capacity
Crude Runs Crude Runs
100 100
546 550 507 463 463 455 455 470 473 471 475 450 450 450 475 475 471 516 516 397 402 402
0 0
2002 2003 2004 2005 2006 2007 2008 2009 2010 2011 2012 2002 2003 2004 2005 2006 2007 2008 2009 2010 2011 2012
27
Source: Data from Statistics Canada, and CAPP. Figures by CERI
Contrary to developments in Central Canada, a series of refinery expansions and modifications
over the last decade have resulted in overall refining capacity increases in the Western (BC, AB,
and SK) and Atlantic Canada regions.
After accounting for closures in Central Canada and expansions as well as modifications/
expansions in Western and Atlantic Canada, overall Canadian refining capacity has actually
increased by six percent from about 2,003 kb/d of capacity in 2002 to 2,130 kb/d by 2012.
Meanwhile, the number of refineries has gone from 21 to 18 during the same timeframe.28
In both Western and Atlantic Canada, this has resulted in an overall increase in crude runs over
the decade. However, this has not resulted in increases in refinery LPGs production in both
regions. This suggests that in respect to refinery LPGs production, not only how much crude
goes to the refinery matters, but also the type of crude.
As seen in Figure 1.9, the crude slate (or diet) of refineries in these areas is rather different.
In Western Canada, refineries process a variety of different crudes, yet as can be observed, the
share of synthetic and heavy crudes processed has increased over time.
27
Table 07-03B: Refinery Crude Oil Capacity – Canada; Table 07-05A: Refinery Closures – Canada. Available at:
http://www.capp.ca/library/statistics/handbook/pages/statisticalTables.aspx?sectionNo=7
28
Refineries closed over the last decade in Canada include those in Oakville, ON (2005); Montreal, QC (2010); and Bowden, AB
(2012)(Total Capacity = 215 kb/d)
May 201412 Canadian Energy Research Institute
Figure 1.9: Crude Runs by Type in Western (L) and Atlantic (R) Canada (kb/d) (2002-2012)
700 500
611 Pentanes Plus & 447
427 428 431 430 435 435
590 585 590 588 583 Condensates 450 425 416
600 576 411 407
552 556
538 528 400
Crude Bitumen
500 350
Conventional Heavy 300
400
kb/d
kb/d
250
300 Conventional Light
200
200 Synthetic
150 Conventional Heavy
100 Conventional Light
100 Total crude and equivalent charged
Total crude and 50
equivalent charged
- -
2002 2003 2004 2005 2006 2007 2008 2009 2010 2011 2012 2002 2003 2004 2005 2006 2007 2008 2009 2010 2011 2012
Source: Data from Statistics Canada. Figures by CERI
In 2012, these types of crudes (combined) accounted for about 75 percent of the total crudes
processed in the region compared to about 55 percent in 2002. This matters because both
synthetic and heavy crudes have a lower volume percentage of light ends such as propane and
butanes29 (LPGs). Thus, while overall crude runs have increased, refinery LPGs production in the
(Western) region have decreased as a function of a change in the crude slate or diet.
In Atlantic Canada, crude runs have increased, but the crude slate has also changed from about
90 percent light and 10 percent heavy in 2002, to almost 100 percent light by 2012. Therefore, a
combination of increased crude runs and a switch to a lighter crude feedstock helps to explain
the overall increase in refinery LPGs production in the Atlantic region. This increase, however,
has not been large enough to offset decreases across other regions in Canada (both Western
and Central Canada).
Going forward, considering how RPPs demand could change in Canada, and how crude runs
could change across the country based on refining capacity changes (closures, expansions/
modifications, or additions) as well as understanding the possible changes in crude slates, will
determine the outlook for refinery LPGs production.
Oil Sands Upgraders SGL Production
Synthetic gas liquids (SGLs) are a mix of paraffinic30 and olefinic31 hydrocarbon liquids that are
recovered from off-gases produced during the crude bitumen and heavy conventional crude
upgrading and refining processes.
29
See: http://crudemonitor.ca/home.php; and, CERI’s Study No. 130: Natural Gas Liquids (NGLs) on North America: Overview
and Outlook to 2035
30
Ethane, propane, butanes, and pentanes plus
31
Ethylene, propylene, butylene, and olefinic condensate
May 2014Natural Gas Liquids (NGLs) in North America: An Update 13
Part I - Upstream
The upgrading process aims to produce a light synthetic (sweet or sour) crude oil (SCO) similar
to conventional light crude. Once extracted, SGLs are further separated into their individual
components just like NGL mixes, in order for the products to be transported and marketed.
As can be observed in Figure 1.10, production of SCO in Western Canada has more than
doubled between 2002 and 2012 (a 126 percent increase). In 2012, the largest share (68
percent) of SCO was produced at the integrated mining and upgrading projects in the Athabasca
oil sands area (Suncor, Syncrude, and CNRL). Another 22 percent was produced in the AB
Industrial Heartland (Fort Saskatchewan area, AOSP Scotford upgrader), even though the
bitumen feedstock for this project comes primarily from mining projects in the Athabasca area.
The remaining less than ten percent was produced from in-situ projects.32
Figure 1.10: Synthetic Crude Oil (SCO) Production in Western Canada by Project (L) and
Area (R) (kb/d) (2002-2012)
1,200 OPTI/ Nexen - Long Lake 1,200
CNRL - Horizon
Athabasca Area (In-situ)
Husky - Lloydminster Lloydminster - Cold Lake Area (In-situ)
965 AB Industrial Heartland 965
1,000 Shell - Scotford 917 1,000
Athabasca Area (Mining) 917
Suncor - Base Mine 846 846
826 Total SCO Production 826
Syncrude - Mildred Lake
800 Total SCO Production 739
720 712 800 720 739 712
656 656
604 604
kb/d
kb/d
600 600
495 495
428 428
400 400
200 200
- -
2002 2003 2004 2005 2006 2007 2008 2009 2010 2011 2012 2002 2003 2004 2005 2006 2007 2008 2009 2010 2011 2012
33
Source: Data from AER, AESRD, and Husky Energy. Figures by CERI
Figure 1.11 displays production of off-gases34 by project and by area. A distinction is made in
these charts between the total off-gases produced from all projects and the total excluding the
OPTI/Nexen Long Lake project. The reason for this distinction is that this particular project was
purposely designed to fully utilize its off-gases for both fuel and steam production for its in-situ
steam assisted gravity drainage (SAGD) operations in order to reduce natural gas usage.
32
This is a simple generalization as Suncor’s upgrader processes in-situ volumes while the Scotford upgrader could potentially
source feedstock from in-situ projects. Furthermore, the majority of the Lloydminster upgrader’s feedstock is conventional
heavy crude from SK and AB as opposed to crude bitumen
33
Husky Energy, Investor Relations, Annual Reports & Fillings: Information retrieved from Annual Information Forms (AIF) from
2002 to 2012. Available at: http://www.huskyenergy.com/investorrelations/annualreports.asp
34
The term off-gases and process gas will be used interchangeably in this section
May 201414 Canadian Energy Research Institute
Figure 1.11: Upgrader Off-gas Production by Project (L) and Area (R) (MMcf/d) (2002-2012)
OPTI/ Nexen - Long Lake 700 Athabasca Area (In-situ)
CNRL - Horizon Lloydminster - Cold Lake Area (In-situ) 629
641
700 Husky - Lloydminster AB Industrial Heartland 604
Shell - Scotford 629 641 600 Athabasca Area (Mining)
Suncor - Base Mine 604 Total Upgrader Off-Gas Production 537
600 Syncrude - Mildred Lake Total Excluding OPTI/ Nexen - Long Lake
Total Upgrader Off-Gas Production 537
500 AER ST98 (MMcf/d) 470
444 454
Total Excluding OPTI/ Nexen - Long Lake 470 424
440
425
500 AER ST98 (MMcf/d) 444 454
440 425 391 381
424 400 375
MMcf/d
391 381
400 375
MMcf/d
289
289 300
300 229
229
200
200
100 100
- -
2002 2003 2004 2005 2006 2007 2008 2009 2010 2011 2012 2002 2003 2004 2005 2006 2007 2008 2009 2010 2011 2012
35
Source: Data from AER, ERCB, and CERI Estimates. Figures by CERI
This project is therefore using its off-gases in a closed loop system and the off-gases are not
likely available for SGLs extraction. It is important to point out that the Long Lake project only
accounted for about three percent of total SCO production in 2012, yet it produced about 30
percent of the total upgrader off-gases.
Therefore, it is important to consider that the amount of off-gases produced by an upgrading
operation will largely depend on the technology being used.36
As an example, CERI estimates that a coking upgrader such as those used in the Suncor,
Syncrude, and CNRL operations produce between 0.4-0.6 thousand cubic feet (mcf) of off-gases
per barrel of SCO produced, while the ratios for hydro-cracking (Shell) and OrCrude (OPTI/
Nexen) upgraders are 0.8 and 6.1, respectively.
Furthermore, SGLs recovered from off-gas produced by coking upgraders (Suncor and CNRL)
have a significant olefinic content and require segregation from the paraffinic NGLs produced by
gas plants, and refineries; SGLs recovered from hydro-cracking upgraders (Shell)37 tend to
contain a low to minimum olefinic content and be primarily composed of NGLs.
35
CERI estimates for the years 2002 – 2007 are based on analysis of SCO, off-gas, and SGLs production data from AER ST-39 and
analysis conducted by CERI and presented in Study No. 130. Off-gas production as presented in AER ST-98 is provided in these
charts as a means of reference and to provide validation for CERI’s estimates
36
Generally, the upgrading process involves removing carbon (via coking) or adding hydrogen (via hydrocracking). The OPTI
Orcrude upgrader uses proprietary technology that combines gasification and hydrocracking processes.
37
Syncrude’s upgrading operations include delayed coking (carbon removal) and hydro cracking (hydrogen addition). The
proposed Northwest Redwater refinery/upgrader will be a hydro cracking upgrader
May 2014Natural Gas Liquids (NGLs) in North America: An Update 15
Part I - Upstream
Figure 1.12 presents the supply of disposition of off-gases (process gas) over the 2008 to 2012
period38 for the integrated mining projects.39 Supply (or availability) (grey bars) is the sum of
upgrader off-gas production plus deliveries to the upgraders (either from on-site refineries/
other plants (Shell), as well as from SGLs extraction plants (Suncor and Shell)). Use (or
disposition) (red bars) is the sum of off-gas flaring, use for upgrading, use for plant fuel, and
deliveries to SGLs extraction plants.
Figure 1.12: Off-gas Supply and Disposition (MMcf/d) (2008-2012) and 2012 % Share of Total
600 556
523 516 505
500 1%
22% 16%
409
400
300 20%
MMcf/d
63%
200 78%
Process Gas Flared/ Wasted Process Gas Further Process (Upgrading)
Process Gas Deliveries (Leaves the Plant) Process Gas Fuel/ Plant Use
100 Statistical Difference Process Gas Receipts (Enters the Plant)
Process Gas Production Process Gas Flared/ Wasted
Process Gas Production Total Process Gas Supply
Total Process Gas Disposition Process Gas Receipts (Enters the Plant) Process Gas Further Process (Upgrading)
-
S D S D S D S D S D Process Gas Deliveries (Leaves the Plant)
(100) 2008 2009 2010 2011 2012
Process Gas Fuel/ Plant Use
Source: Data from AER. Figures by CERI
Given the strong level of activity in the oil sands over the last decade, which has in turn resulted
in increasing levels of SCO production and off-gases, there has been an increased availability of
SGLs in Western Canada.
In 2012, close to 80 percent of the process gas or off-gas available from the upgraders in
question was used for upgrading and plant fuel purposes, while less than 20 percent was sent to
off-gas SGLs extraction plants. This suggests that a large potential for SGLs extraction from
upgraders is currently not being realized.
As can be seen in Figure 1.13, CERI estimates SGLs availability has nearly doubled over the past
decade from about 57 kb/d in 2002 to over 100 kb/d by 2012. These SGLs present the
opportunity for a possible alternative source of petrochemical feedstock but could also be
directed to other NGL markets.
38
This timeframe has been chosen given data availability limitations. The OPTI-Nexen project is excluded from this analysis as
per comments above. The Lloydminster upgrader is not included as data is not available on the production or use of off-gases. It
is assumed that the majority of the process gas in this upgrader is used for upgrading purposes and plant fuel use as it is the
case with the upgraders for which data is available
39
Includes the Suncor, Syncrude, CNRL, and Shell upgraders
May 201416 Canadian Energy Research Institute
Figure 1.13: SGLs Potential by Area (L) and Type (R) (kb/d) (2002 – 2012)
140 140
120 120
112 113 116 112 113 116
120 120
108 108 108 108
100 97 100 97
96 96
100 100
80 73 80 73
kb/d
kb/d
57 57
60 60
40 40
Lloydminster - Cold Lake Area (In-situ)
AB Industrial Heartland Propane+ Mix
20 Athabasca Area (Mining) 20 Ethane/ Ethylene Mix
Estimated SGLs Potential (kb/d) Estimated SGLs Potential (kb/d)
- -
2002 2003 2004 2005 2006 2007 2008 2009 2010 2011 2012 2002 2003 2004 2005 2006 2007 2008 2009 2010 2011 2012
40
Source: CERI estimates based on various data sources. Figures by CERI
Currently, two projects in AB recover this type of liquid hydrocarbon mix from oil sands
upgraders’ off-gases. These are the Williams Fort McMurray extraction plant located in the
Athabasca (oil sands) area,41 which started operation in 2002; and the Aux-Sable Heartland off-
gas plant located in the Fort Saskatchewan area,42 which started operating in late 2011.
Williams also owns and operates a fractionator at Redwater to process olefinic SGLs.
On a contractual basis, these plants extract SGLs from the off-gas stream and replace the
heating value extracted with the equivalent volume of natural gas, making the economics of
such projects very attractive in a low natural gas and high NGLs/olefins price environment.43
Figure 1.14 displays CERI’s estimates for SGLs extraction from these operations over the last
decade. To put these figures into context, the estimated 13 kb/d of SGLs extracted in 2012
represented about 13 percent of the estimated 108 kb/d of SGLs in the off-gas stream, but only
two percent of the total NGLs produced in Canada in that year.
Going forward, the potential for SGLs extraction from these operations will be dictated by the
level of SCO production (and thus overall oil sands activity and upgrading operations) as well as
by any modifications/expansions or new builds of SGLs extraction plants.
40
See Study No. 130
41
Processes off-gases from Suncor’s Base upgrader
42
Processes off-gases from Shell’s Scotford upgrader
43
Generally reflective of high crude oil to natural price spread
May 2014Natural Gas Liquids (NGLs) in North America: An Update 17
Part I - Upstream
Figure 1.14: Upgrader Off-gas SGL Extraction Estimates (kb/d) (2002-2012) and
2012 % Share of Total
14 13
12 12
12 5% 3%
11 11 11
10
10
10
27%
8 7
kb/d
6 6
6
65%
4 Olefinic Condensate
Butane/ Butylene
Propane/ Propylene
2 Ethane/ Ethylene
Total Upgrader Off-Gas SGLs
0 Ethane/ Ethylene Propane/ Propylene
2002 2003 2004 2005 2006 2007 2008 2009 2010 2011 2012 Butane/ Butylene Olefinic Condensate
44
Source: CERI estimates. Figures by CERI
Williams has recently completed modifications at their Fort McMurray extraction plant and their
Redwater fractionation facility to allow for ethane/ethylene extraction, while they are also
currently building a new cryogenic extraction plant that will extract SGLs from CNRL Horizon’s
upgrader.45 Williams also recently announced the possibility of building an additional off-gas
extraction facility at the Syncrude site beyond 2017.46
These developments will increase SGLs extraction in the coming years, increasing the share of
SGLs in total NGL production and thus diversifying NGL supplies from the more traditional
sources.
44
Total production numbers for 2008 – 2012 are actuals retrieved from AER ST-39. 2002 – 2007 estimates by CERI.
Estimates based on data and analysis presented in Figure 9 -12 plus information retrieved from Williams. Williams in Canada.
Available at: http://williamscom.files.wordpress.com/2012/02/canada_1-22-2013.pdf
45
Williams Energy, Investors, Presentations, 2013 TD Securities Calgary Energy Conference Presentation. Available at:
http://co.williams.com/
46
http://b2icontent.irpass.cc/630%2F153343.pdf?AWSAccessKeyId=1Y51NDPSZK99KT3F8VG2&Expires=1397776963&Signature=I
59pgGlvoY3xfa1u0zTjhcPTN2g%3D, Slide 11
May 201418 Canadian Energy Research Institute May 2014
Natural Gas Liquids (NGLs) in North America: An Update 19
Part I - Upstream
United States NGL Production
(2002-2012)
The shale gas revolution in the United States (US) has driven natural gas production beyond
historic levels and has fundamentally shifted the dynamics of other energy markets that
compete with or are related to natural gas, such as NGLs.
US NGL production has been steadily increasing since 2008 surpassing 3,000 kb/d in 2012.
Hydraulic fracking technologies that were first developed in the Barnett Shale in Texas have
been transferred to other shale reservoirs, resulting in a significant increase in shale gas
drilling. It is the rich NGL compositions in some of these reservoirs that make their development
economically viable, even in depressed gas price environments.
This trend of increased production of NGLs is likely to continue given the significant size and
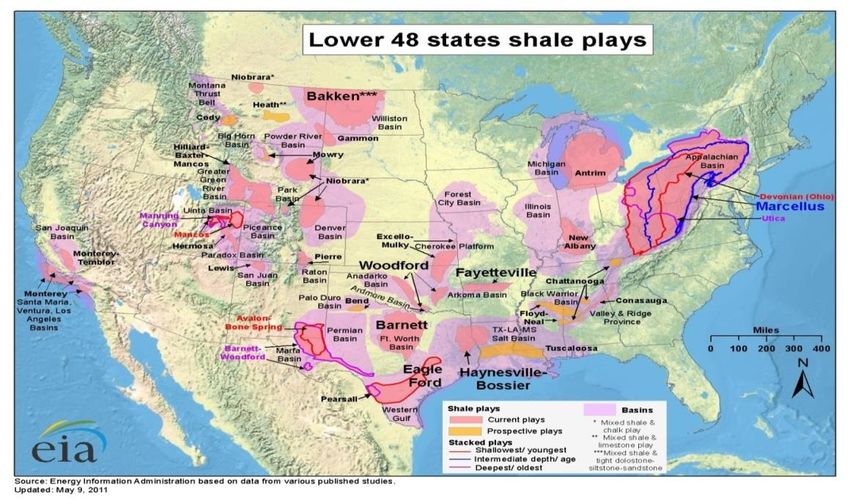
number of shale basins in the US. Figure 2.1 illustrates some of the major shale basins in the
lower 48 states.
Figure 2.1: Shale Plays in the Lower 48 States
47
Source: EIA
47
Energy Information Administration, Lower 48 states shale plays, http://www.eia.gov/oil_gas/rpd/shale_gas.pdf
May 201420 Canadian Energy Research Institute
Since NGL prices are typically linked to oil prices, the oil-gas price spread has resulted in
exploration and production shifting to liquid-rich plays such as the Permian, Anadarko, Williston,
Eagle Ford and Niobrara. Figure 2.2 shows the average gallons of NGLs produced per thousand
cubic feet of gas processed (“gallons per mcf” or GPM).48
Figure 2.2: Average GPM of Shale Plays in the Lower 48 States
49
Source: NPC
The GPM can vary widely basin to basin. Lean or dry gas typically has a GPM of between 1-2,
rich gas between 3-4, and very rich gas greater than 4.50
The National Petroleum Council (NPC) estimates that the average GPM for the US in 2010 was
1.25, however some plays can have GPMs of over 5, for example the Granite Wash play in the
Texas panhandle region has the highest average GPM at 5.3, followed by the Eagle Ford in
southern Texas at 5.2.51 Of course certain areas within a play will have a higher GPM, for
example, some areas of the Marcellus and Utica shales have recorded GPMs of up to 9.52
48
1 GPM = 1 gallon/Mcf x (1,000 mcf/1 MMcf) x (1b/42 gallons) = 1 x 1,000 / 42 = 23 bbl/MMcf
49
National Petroleum Council, Paper #1-13 Natural Gas Liquids (NGLs) Working Document of the NPC North American Resource
Development Study, Made Available September 15, 2011
50
In Canada, liquids yields are generally measured in barrels of NGLs per million cubic feet of gas (bbls/MMcf). Lean gas
generally has a liquids yield of less than 50 bbls/MMcf, while rich gas is generally up to 100 bbls/MMcf, anything over 100
bbls/MMcf is considered very rich.
51
National Petroleum Council, Paper #1-13 Natural Gas Liquids (NGLs) Working Document of the NPC North American Resource
Development Study, Made Available September 15, 2011
52
John C. Powell, Analysis of the NGL Supply and Utilization Strategies, http://www.marcellus.psu.edu/s_files/pdf/5-Powell.pdf
May 2014Natural Gas Liquids (NGLs) in North America: An Update 21
Part I - Upstream
Total NGL production in the US has increased 32 percent since 2005; the majority of this
increase can be attributed to NGLs from natural gas processing plants, which increased 39
percent over the same period. Natural gas processing plants produced 79 percent of NGLs in the
US with refineries producing only 21 percent.
Figure 2.3: US NGL Production by Source (kb/d) (2002-12) and 2012 % Share of Total
3500
3020
3000 2816
2715
2551 2518
2377 2454
2366 2438 2414 21%
2500 2290
2000
kb/d
1500
1000 Refineries 79%
Gas Plant
500 Total NGLs
0
2002 2003 2004 2005 2006 2007 2008 2009 2010 2011 2012 Gas Plant Refineries
53
Source: EIA data. Figures by CERI
In 2012, there were more than 500 natural gas processing plants that in total processed about
48 bcf/d of gas to produce about 2.4 million barrels of NGLs per day. 54 The majority of the gas
processing plants are located along the Gulf Coast, in the West Texas/Oklahoma area as well as
in the Rockies.
The rising supply of NGLs has led to challenges in finding markets and building the infrastructure
necessary to move product to markets, both domestic and export. For example, much of the
increased ethane supply in the Marcellus region is stranded because of the distance from
petrochemical markets in the Gulf Coast area as well as the lack of proper extraction capacity.
53
Energy Information Administration data, http://www.eia.gov/naturalgas/data.cfm#production
54
Energy Information Administration data, http://www.eia.gov/dnav/ng/ng_prod_pp_a_EPL0_ygt_Mbbl_a.htm
May 201422 Canadian Energy Research Institute
Gas Plant NGL Production
Ethane makes up the largest proportion of NGLs from natural gas processing plants, accounting
for 41 percent in 2012, closely followed by propane at 30 percent. Ethane and propane also
account for the majority of growth in NGLs over the decade. Butanes and Pentanes Plus make
up smaller contributions, at 17 and 13 percent, respectively, and have also increased, albeit off a
smaller base.
Figure 2.4: Gas Plant NGL Production by Liquid (kb/d) (2002-2012) and 2012 % Share of Total
2500 2390
2197
2056
1880 1895 13%
2000 1809 1783 1784
1719 1717 1739
17% 41%
1500
kb/d
1000 Pentanes+/Condensate
30%
Butanes
Propane
500
Ethane
Gas Plant NGL Total Ethane Propane
0
Butanes Pentanes+/Condensate
2002 2003 2004 2005 2006 2007 2008 2009 2010 2011 2012
Source: EIA data. Figures by CERI
Together, PADDs II, III and IV make up 96 percent of gas plant NGL production. The Gulf Coast
region of PADD III dominates the US market, accounting for 62 percent of NGLs from gas plants
in 2012. This is not surprising since it is home to some of the largest and mature plays, such as
the Anadarko, Permian, and Eagle Ford.
Figure 2.5: Gas Plant NGL Production by PADD (kb/d) (2002-2012) and 2012 % Share of Total
2500 2390
3% 2%
2197
2056
2000 1880 1895
1809 1783 1784 16%
1719 1717 1739 18%
1500
kb/d
1000
PADD 1 PADD 5 62%
500
PADD 4 PADD 2
PADD 3 Gas Plant NGL Total
0 PADD 1 PADD 2 PADD 3 PADD 4 PADD 5
2002 2003 2004 2005 2006 2007 2008 2009 2010 2011 2012
Source: EIA data. Figures by CERI
May 2014Natural Gas Liquids (NGLs) in North America: An Update 23
Part I - Upstream
PADDs II and IV have both experienced increases in NGL production, which is consistent with
natural gas production increasing in those regions. PADD IV’s (Rockies) share of NGL production
has increased from 11 percent in 2002 to 16 percent in 2012. PADD II’s (Midwest) share has
increased from 16 percent in 2002 to 18 percent in 2012.
Historically, PADD I has produced very few NGLs, but this trend is about to change. Development
in the wet (liquids-rich) portion of the Marcellus and Utica shale in Pennsylvania, Ohio, and
West Virginia, is drastically increasing the amount of natural gas and NGLs that can be produced
in the region. Figure 2.6 shows the increase in natural gas production in the northeast US over
the past five years and its effect on inflows from other areas.
Figure 2.6: PADD I Production, Demand and Net Inflow from Other Regions
55
Source: EIA
Along with this surge in natural gas production, comes an increased volume of NGLs. Companies
such as MarkWest are investing in gas plant, pipeline, and fractionator infrastructure in order to
produce purity NGL products in the region.56 As investment into NGL infrastructure increases in
the region, more and more purity products will be produced and less ethane being produced in
the northeastern US will be rejected (not extracted) back into the natural gas stream.
Refinery LPG Production
In 2012, LPGs produced in refineries accounted for 21 percent of total NGLs produced in the US.
Propane and butane together accounted for 17 percent of total refined petroleum products in
2012 from US refineries. Motor gasoline and diesel fuel make up the largest proportion of total
output at 63 percent.
55
Energy Information Administration, Today in Energy, Increased Northeast natural gas production reduces net inflow of supply
from other areas, http://www.eia.gov/todayinenergy/detail.cfm?id=13851
56
MarkWest Operations website, http://www.markwest.com/operations/utica/
May 2014You can also read