MUNICIPAL POWER IMPACT FEE FACILITIES PLAN (IFFP) & IMPACT FEE ANALYSIS (IFA) - CITY OF ST. GEORGE, UTAH FINAL ADOPTED JULY 10, 2014
←
→
Page content transcription
If your browser does not render page correctly, please read the page content below
+

                  MUNICIPAL POWER
    IMPACT FEE FACILITIES PLAN (IFFP)
        & IMPACT FEE ANALYSIS (IFA)

                 CITY OF ST. GEORGE, UTAH

                         FINAL ADOPTED
                             JULY 10, 2014
LYRB      IFFP AND IFA: MUNICIPAL POWER
          ST. GEORGE UTAH                                                                                         JULY 10, 2014

           Certification for Impact Fee Facilities Plan and Impact Fee Analysis

           IFFP Certification
           LYRB certifies that the attached impact fee facilities plan:
                1.   includes only the costs of public facilities that are:
                          a. allowed under the Impact Fees Act; and
                          b. actually incurred; or
                          c. projected to be incurred or encumbered within six years after the day on which each impact
                              fee is paid;
                2.   does not include:
                          a. costs of operation and maintenance of public facilities;
                          b. costs for qualifying public facilities that will raise the level of service for the facilities, through
                              impact fees, above the level of service that is supported by existing residents;
                          c. an expense for overhead, unless the expense is calculated pursuant to a methodology that is
                              consistent with generally accepted cost accounting practices and the methodological standards
                              set forth by the federal Office of Management and Budget for federal grant reimbursement;
                              and,
                3.   complies in each and every relevant respect with the Impact Fees Act.

           IFA Certification
           LYRB certifies that the attached impact fee analysis:
                1.   includes only the costs of public facilities that are:
                          a. allowed under the Impact Fees Act; and
                          b. actually incurred; or
                          c. projected to be incurred or encumbered within six years after the day on which each impact
                               fee is paid;
                2.   does not include:
                          a. costs of operation and maintenance of public facilities;
                          b. costs for qualifying public facilities that will raise the level of service for the facilities, through
                               impact fees, above the level of service that is supported by existing residents;
                          c. an expense for overhead, unless the expense is calculated pursuant to a methodology that is
                               consistent with generally accepted cost accounting practices and the methodological standards
                               set forth by the federal Office of Management and Budget for federal grant reimbursement;
                3.   offsets costs with grants or other alternate sources of payment; and,
                4.   complies in each and every relevant respect with the Impact Fees Act.

           LYRB makes this certification with the following caveats:
          1.    All of the recommendations for implementations of the IFFP made in the IFFP documents or in the IFA
                documents are followed by City Staff and elected officials.
          2.    If all or a portion of the IFFP or IFA are modified or amended, this certification is no longer valid.
          3.    All information provided to LYRB is assumed to be correct, complete, and accurate. This includes
                information provided by the City as well as outside sources.

           LEWIS YOUNG ROBERTSON & BURNINGHAM, INC.

       PAGE 2
       Lewis Young Robertson & Burningham, Inc.         Salt Lake City, Utah 84101    Office 801.596.0700 Fax 801.596.2800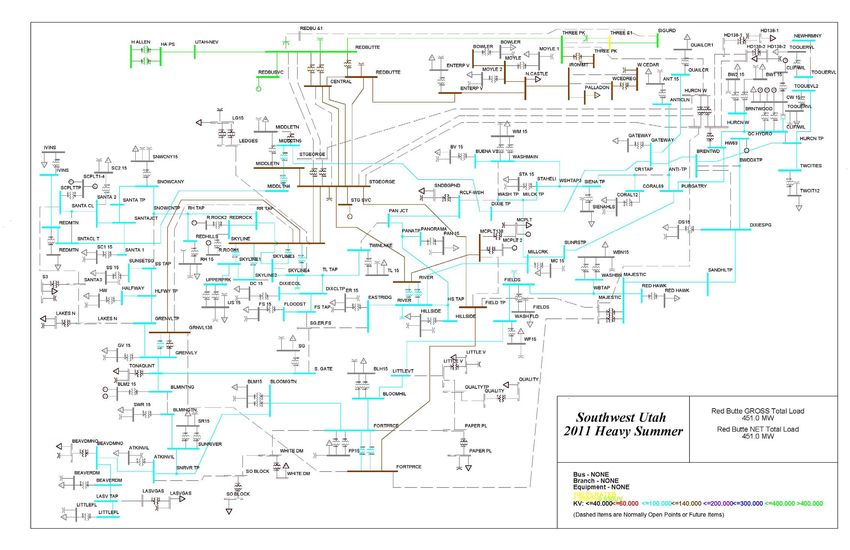
LYRB      IFFP AND IFA: MUNICIPAL POWER
          ST. GEORGE UTAH                                                                                                                                            JULY 10, 2014

                TABLE OF CONTENTS

                SECTION 1: EXECUTIVE SUMMARY.....................................................................................................4
                    PROPOSED POWER IMPACT FEE .................................................................................................................................... 4

                SECTION 2: GENERAL IMPACT FEE METHODOLOGY ..................................................................7

                SECTION 3: OVERVIEW OF SERVICE AREA, DEMAND, AND LOS ............................................9
                    SERVICE AREA .............................................................................................................................................................. 9
                    DEMAND UNITS ........................................................................................................................................................... 9
                    LEVEL OF SERVICE STANDARDS .................................................................................................................................. 10

                SECTION 4: EXISTING FACILTIES INVENTORY ............................................................................. 11
                    VALUE OF EXISTING POWER INFRASTRUCTURE .......................................................................................................... 11
                    EXCESS CAPACITY ...................................................................................................................................................... 11
                    MANNER OF FINANCING EXISTING INFRASTRUCTURE ............................................................................................... 13

                SECTION 5: CAPITAL FACILITY ANALYSIS ..................................................................................... 14
                    POWER RESOURCE IMPROVEMENTS............................................................................................................................ 14
                    CITY TRANSMISSION & DISTRIBUTION IMPROVEMENTS ............................................................................................. 14
                    MAIN TRANSMISSION SYSTEM IMPROVEMENTS ......................................................................................................... 15
                    SUMMARY OF FUTURE CAPITAL PROJECTS ................................................................................................................. 15
                    SYSTEM VS. PROJECT IMPROVEMENTS ......................................................................................................................... 19
                    FUNDING OF FUTURE FACILITIES ................................................................................................................................ 19
                    EQUITY OF IMPACT FEES ............................................................................................................................................. 19
                    NECESSITY OF IMPACT FEES........................................................................................................................................ 20

                SECTION 6: POWER IMPACT FEE CALCULATION ......................................................................... 21
                    PROPOSED POWER IMPACT FEES ................................................................................................................................ 21
                    CONSIDERATION OF ALL REVENUE SOURCES ............................................................................................................. 22
                    EXPENDITURE OF IMPACT FEES................................................................................................................................... 23
                    PROPOSED CREDITS OWED TO DEVELOPMENT ........................................................................................................... 23
                    GROWTH-DRIVEN EXTRAORDINARY COSTS ............................................................................................................... 23
                    SUMMARY OF TIME PRICE DIFFERENTIAL ................................................................................................................... 23

                APPENDIX A: POWER SERVICE AREA .............................................................................................. 24

                APPENDIX B: TYPICAL LOAD PROFILES ......................................................................................... 25

                APPENDIX C: JOINT PLAN STUDY .................................................................................................... 26

       PAGE 3
       Lewis Young Robertson & Burningham, Inc.                              Salt Lake City, Utah 84101                     Office 801.596.0700 Fax 801.596.2800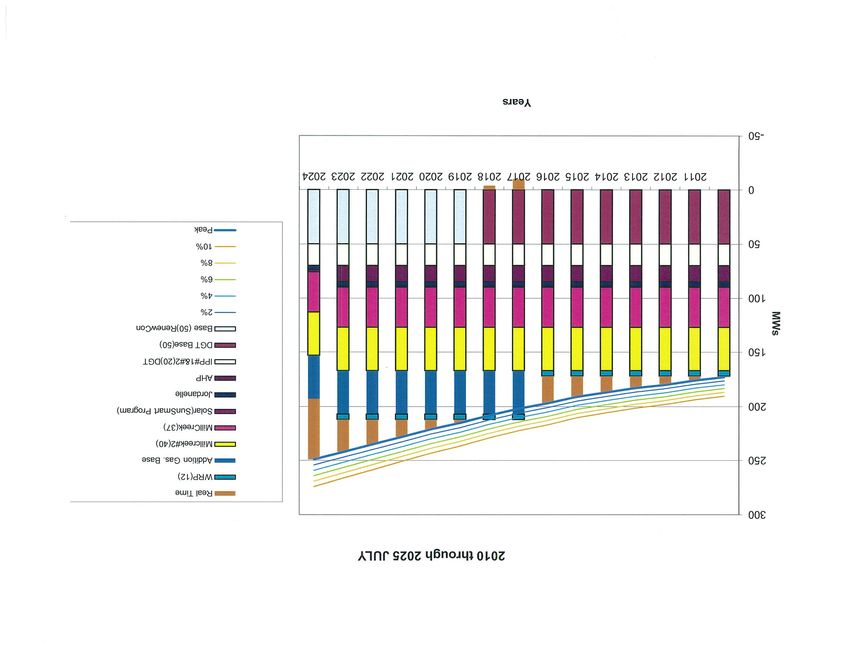
LYRB      IFFP AND IFA: MUNICIPAL POWER
          ST. GEORGE UTAH                                                                                                JULY 10, 2014

           SECTION 1: EXECUTIVE SUMMARY

           The purpose of the Municipal Power Impact Fee Facilities Plan (“IFFP”), with supporting Impact Fee Analysis
           (“IFA”), is to fulfill the requirements established in Utah Code Title 11 Chapter 36a, the “Impact Fees Act”, and
           assist the City of St. George (the “City”) in financing and constructing necessary capital improvements for future
           growth. This document will address the future infrastructure needed to serve the City through the next nine
           years, as well as the appropriate impact fees the City may charge to new growth to maintain the level of service
           (“LOS”).

                     Impact Fee Service Area: The Municipal Power Service Area (“Service Area”) currently serves
                     approximately 27,000 accounts or nearly 59,000 residents, which is approximately 74 percent of the
                     City’s total population. The remaining portion of the City is served by the Dixie Power Cooperative.
                     The City’s electric system also serves the majority of the commercial businesses.

                     Demand Analysis: The proposed impact fees are based upon the costs of capital infrastructure that will
                     be necessary to serve new development. A total of 104,472 additional kilowatts (kW) of demand will be
                     generated based on the projected build out in undeveloped land within the current Service Area. A total
                     41,068 kW are projected to occur within the IFFP planning horizon, (9-10 years; 2-3% per year growth).
                     See SECTION 3 for details regarding growth in kW and equivalent units (EUs).

                     Level of Service: The power level of service, as defined by the St. George City Energy Services
                     Department, is based on an average load per ERU of 6.69 kilowatts (“kWs”). The average load per ERU
                     was calculated by taking the peak load of 169,000 kW ending 2010 (see TABLE 3.1) and dividing by the
                     total number of ERUs (beginning 2011 at 25,261). New facilities are designed to maintain this level of
                     service.

                     Excess Capacity: The City does not have excess energy capacity during peak periods. Short term
                     market purchases are required to supply energy during peak periods. There is however, approximately
                     67 percent of the Green Valley substation that has capacity available for growth, the actual cost of which
                     is included in the impact fee calculation.1

                     Capital Facilities Analysis: The costs of future projects related to growth and funded with impact fees
                     are estimated at $28.8 million.2

                     Funding of Future Facilities: At the request of the City, no financing costs are included in this analysis
                     and thus assumes all future facilities will be funded on a cash basis.

           PROPOSED POWER IMPACT FEE
           PLAN BASED (FEE BASED ON DEFINED CAPITAL IMPROVEMENT PLAN)
           Impact fees can be calculated using a specific set of costs specified for future development. The improvements
           are identified in the IFFP, Capital Facilities Plan (“CFP”) or Capital Improvement Plan (“CIP”) as growth related
           projects. The total project costs are divided by the total demand units the projects are designed to serve. Under
           this methodology, it is important to identify the existing level of service and determine any excess capacity in
           existing facilities that could serve new growth.

           1 The Green Valley transmission and substation were built to serve the west side load and provide backup to the Skyline and
           River substations. Due to economies of scale and transformer size, a 75 mW transformer was installed with a future bay and
           additional transformer pad to the west side. Growth is expected over the next 10 years to use up this capacity.

           2All power generation projects have been removed due to the uncertainty of the type of projects needed to serve growth. Once
           these projects are more specifically defined, the impact fee will need to be revised to include the cost of these projects that is
           applicable to growth.

       PAGE 4
       Lewis Young Robertson & Burningham, Inc.            Salt Lake City, Utah 84101       Office 801.596.0700 Fax 801.596.2800
LYRB      IFFP AND IFA: MUNICIPAL POWER
          ST. GEORGE UTAH                                                                                                        JULY 10, 2014

           POWER IMPACT FEE CALCULATION
           Based on the growth-related projects, as well as the applicable buy-in fee, the cost per new kW is estimated at
           $858 as shown in TABLE 1.1 below. The fee per kW is then applied to the general usage statistics for residential
           and commercial users, as shown in TABLE 1.2 through 1.4.

           TABLE 1.1: ILLUSTRATION OF COST PER NEW KW
                                                                              % GROWTH
                                                           TOTAL COSTS                       GROWTH RELATED
                                                                              RELATED &                                 GROWTH           COST PER
               POWER PROJECTS                              WITHIN IFFP                         & IMPACT FEE
                                                                              IMPACT FEE                               RELATED KW        NEW KW
                                                            HORIZON                           FUNDED COSTS
                                                                               FUNDED
               CAPITAL PROJECTS
               Generation Additions                            $2,452,897          50%                  $1,226,448         41,068                $29.86
               Distribution and Transmission                  $34,509,165          80%              $27,594,646            41,068            $671.93
                  Sub-Total Capital Projects Cost             $36,962,061                           $28,821,094                              $701.79
               BUY-IN
               Green Valley                                   $11,680,125          67%                  $7,786,750         50,000            $155.73
                  Sub-Total Buy-In Cost                       $11,680,125                               $7,786,750                           $155.73
               OTHER
               Professional Expense3                              $9,675           100%                    $9,675          25,043                 $0.39
                  Sub-Total Other Cost                            $9,675                                   $9,675                                 $0.39
               Total4                                         $48,651,861                           $36,617,519                              $857.91

           TABLE 1.2: ILLUSTRATION OF RESIDENTIAL IMPACT FEE
               SERVICE DESCRIPTION                EST. KW             COST PER KW          IMPACT FEE                2006 FEE5          % CHANGE
               100 Amp - 240/120 V                  4.25                    $858                  $3,646                    $2,790                  31%
               200 Amp - 240/120 V                  5.25                    $858                  $4,504                    $3,446                  31%
               400 Amp - 240/120 V                  9.00                    $858                  $7,721                    $5,908                  31%

           TABLE 1.3: ILLUSTRATION OF COMMERCIAL IMPACT FEE
                                                                                            AVG PEAK
               SERVICE                               100% PANEL          AVG PANEL                            EST. CUSTOMER           EST. AVERAGE
                                PANEL RATING                                                DEMAND @
               DESCRIPTION                              KVA               LOADING                            CLASS DIVERSITY         DIVERSIFIED KVA
                                                                                           PANEL (KVA)
               Single Phase Service
                                           200                   48                30%             14.40                     55%                    7.92
               240/120 V
                                           400                   96                30%             28.80                     55%                   15.84
               Three Phase Service
                                            200                  72                40%             28.82                     55%                   15.85
                                            400                 144                40%             57.64                     55%                   31.70
               208Y/120 V                   800                 288                40%            115.29                     55%                   63.41
                                          1,200                 432                40%            172.93                     55%                   95.11
                                          2,000                 721                40%            288.21                     55%                  158.52
                                            200                 166                40%             66.51                     55%                   36.58
                                            400                 333                40%            133.02                     55%                   73.16
               480Y/277 V                   800                 665                40%            266.04                     55%                  146.32
                                          1,200                 998                40%            399.06                     55%                  219.49
                                          2,000               1,663                40%            665.11                     55%                  365.81

           3 This is the actual cost to update the IFFP and IFA. The City can use this portion of the impact fee to reimburse itself for the
           expense of updating the IFFP and IFA. The cost is divided over the new kWs generated in the next six years.
           4 As of June 30, 2013 the electric utility impact fee fund balance was negative and thus not shown in the calculation of the

           impact fee above.
           5 When the existing fee was adopted in 2006, it was adopted at 75 percent of what was recommended.

       PAGE 5
       Lewis Young Robertson & Burningham, Inc.                Salt Lake City, Utah 84101      Office 801.596.0700 Fax 801.596.2800
LYRB      IFFP AND IFA: MUNICIPAL POWER
          ST. GEORGE UTAH                                                                                     JULY 10, 2014

           TABLE 1.4: ILLUSTRATION OF COMMERCIAL IMPACT FEE (CONT.)
                                       EST. AVERAGE           ESTIMATED        COST PER
               SERVICE DESCRIPTION                                                           IMPACT FEE      2006 FEE       % CHANGE
                                      DIVERSIFIED KVA       DIVERSIFIED KW       KW
               Single Phase Service
                                                   7.92                 7.13         $858          $6,115       $4,679           31%
               240/120 V
                                                  15.84                14.26         $858         $12,230       $9,358           31%
               Three Phase Service
                                                  15.85                14.27         $858         $12,239       $9,365           31%
                                                  31.70                28.53         $858         $24,479      $18,731           31%
               208Y/120 V                         63.41                57.07         $858         $48,958      $37,462           31%
                                                  95.11                85.60         $858         $73,437      $56,192           31%
                                                 158.52               142.67         $858        $122,395      $93,654           31%
                                                  36.58                32.92         $858         $28,245      $21,612           31%
                                                  73.16                65.85         $858         $56,490      $43,225           31%
               480Y/277 V                        146.32               131.69         $858        $112,980      $86,450           31%
                                                 219.49               197.54         $858        $169,469     $129,675           31%
                                                 365.81               329.23         $858        $282,449     $216,125           31%

           NON-STANDARD IMPACT FEES
           The proposed fees are based upon growth in kWs. The City reserves the right under the Impact Fees Act to
           assess an adjusted fee that more closely matches the true impact that the land use will have upon public
           facilities.6 This adjustment could result in a higher or lower impact fee if the City determines that a particular
           user may create a different impact than what is standard for its land use.

                                                     Estimated Usage / 6.69 kWh * $858

           6   UC 11-36a-402(1)(c)

       PAGE 6
       Lewis Young Robertson & Burningham, Inc.         Salt Lake City, Utah 84101   Office 801.596.0700 Fax 801.596.2800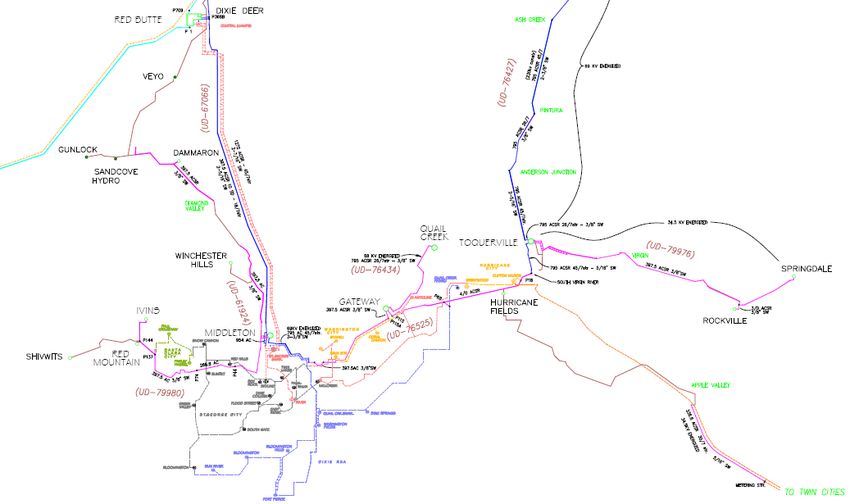
LYRB          IFFP AND IFA: MUNICIPAL POWER
              ST. GEORGE UTAH                                                                                 JULY 10, 2014

               SECTION 2: GENERAL IMPACT FEE METHODOLOGY

                                     The purpose of this study is to fulfill the requirements of the Impact Fees Act
                                     regarding the establishment of an IFFP and IFA. The IFFP is designed to identify the
                                     demands placed upon the City’s existing facilities by future development and evaluate
                                     how these demands will be met by the City. The IFFP is also intended to outline the
 FIGURE 2.1: IMPACT FEE              improvements which are intended to be funded by impact fees. The IFA is designed to
 METHODOLOGY                         proportionately allocate the cost of the new facilities and any excess capacity to new
                                     development, while ensuring that all methods of financing are considered. Each
                                     component must consider the historic level of service provided to existing
        DEMAND ANALYSIS              development and ensure that impact fees are not used to raise that level of service.
                                     The following elements are important considerations when completing an IFFP and
                                     IFA.

                                     DEMAND ANALYSIS
                                     The demand analysis serves as the foundation for the IFFP. This element focuses on a
          LOS ANALYSIS               specific demand unit related to each public service – the existing demand on public
                                     facilities and the future demand as a result of new development that will impact
                                     public facilities.

                                     LEVEL OF SERVICE ANALYSIS
                                     The demand placed upon existing public facilities by existing development is known
        EXISTING FACILITIES          as the existing “Level of Service” (“LOS”). Through the inventory of existing facilities,
             ANALYSIS                combined with the growth assumptions, this analysis identifies the level of service
                                     which is provided to a community’s existing residents and ensures that future
                                     facilities maintain these standards. Any excess capacity identified within existing
                                     facilities can be apportioned to new development. Any demand generated from new
                                     development that overburdens the existing system beyond the existing capacity
         FUTURE FACILITIES           justifies the construction of new facilities.
             ANALYSIS

                                     EXISTING FACILITY INVENTORY
                                     In order to quantify the demands placed upon existing public facilities by new
                                     development activity, the IFFP provides an inventory of the City’s existing system
                                     improvements. To the extent possible, the inventory valuation should consist of the
       FINANCING STRATEGY
                                     following information:

                                                   Original construction cost of each facility;
                                                   Estimated date of completion of each future facility;
                                                   Estimated useful life of each facility; and,
                                                   Remaining useful life of each existing facility.
       PROPORTIONATE SHARE
             ANALYSIS
                                     The inventory of existing facilities is important to properly determine the excess
                                     capacity of existing facilities and the utilization of excess capacity by new
                                     development.

                                     FUTURE CAPITAL FACILITIES ANALYSIS
                                     The demand analysis, existing facility inventory and LOS analysis allow for the
                                     development of a list of capital projects necessary to serve new growth and to
                                     maintain the existing system. This list includes any excess capacity of existing facilities
                                     as well as future system improvements necessary to maintain the level of service. Any
                                     demand generated from new development that overburdens the existing system
                                     beyond the existing capacity justifies the construction of new facilities.

          PAGE 7
          Lewis Young Robertson & Burningham, Inc.   Salt Lake City, Utah 84101    Office 801.596.0700 Fax 801.596.2800
LYRB IFFP AND IFA: MUNICIPAL POWER
ST. GEORGE UTAH JULY 10, 2014
FINANCING STRATEGY – CONSIDERATION OF ALL REVENUE SOURCES
This analysis must also include a consideration of all revenue sources, including service rates, impact fees, future
debt costs, alternative funding sources and the dedication of system improvements, which may be used to
finance system improvements.7 In conjunction with this revenue analysis, there must be a determination that
impact fees are necessary to achieve an equitable allocation of the costs of the new facilities between the new and
existing users.8
PROPORTIONATE SHARE ANALYSIS
The written impact fee analysis is required under the Impact Fees Act and must identify the impacts placed on
the facilities by development activity and how these impacts are reasonably related to the new development.
The written impact fee analysis must include a proportionate share analysis, clearly detailing each cost
component and the methodology used to calculate each impact fee. A local political subdivision or private entity
may only impose impact fees on development activities when its plan for financing system improvements
establishes that impact fees are necessary to achieve an equitable allocation to the costs borne in the past and to
be borne in the future (UCA 11-36a-302).
7 11-36a-302(2)
8 11-36a-302(3)
PAGE 8
Lewis Young Robertson & Burningham, Inc. Salt Lake City, Utah 84101 Office 801.596.0700 Fax 801.596.2800LYRB IFFP AND IFA: MUNICIPAL POWER
ST. GEORGE UTAH JULY 10, 2014
SECTION 3: OVERVIEW OF SERVICE AREA, DEMAND, AND LOS
SERVICE AREA
Utah Code requires the impact fee enactment to establish one or more service areas within which impact fees
will be imposed.9 The City’s electrical system currently serves approximately 27,000 accounts or nearly 59,000
residents which is approximately 74 percent of the City’s total population. The remaining portion of the City is
served by the Dixie Power Cooperative. The City’s electric system also serves the majority of the commercial
businesses. See APPENDIX A for a map of the Service Area.
DEMAND UNITS
The City of St. George Municipal Power system is in need of expansion to perpetuate the level of service that the
City has historically maintained as new growth and development activity continue to occur within the area
served by the City of St. George Municipal Energy Services Department. The City of St. George Energy Service
Department has outlined the recommended capital projects that will maintain the established level of service
through 2022.
All information regarding the existing power level of service, projected system load growth, future power capital
projects, and proposed power impact fee relates to the City of St. George Municipal Power and the area served
by the City of St. George Municipal Energy Services Department. The City of St. George Municipal Power
Service Area (“Power Impact Fee Service Area”) is defined in APPENDIX A of this study plan.
DEMAND UNITS
The proposed impact fees are based upon the costs of capital infrastructure that will serve future growth. TABLE
3.1 illustrates the new demand generated from all the undeveloped areas within the City. This is a build out
demand analysis based on current zoning plans within the City limits and service territory.
TABLE 3.1: ILLUSTRATION OF NEW DEMAND WITH SERVICE AREA
UNDEVELOPED AREAS – TOTAL EST. EST. % IN EST. UNITS IN EST. KW PER EST. TOTAL
NON-HILLSIDE: LAND USE CODE UNITS SERVICE AREA SERVICE AREA UNIT KW LOAD
High Density Residential (HDR) 1,083 20% 217 4.0 868
Low Density Residential (LDR) 13,049 75% 9,787 5.5 53,829
Medium Density Residential (MDR) 3,406 20% 681 5.0 3,405
Multi-Residential (MR) 12,839 20% 2,568 4.5 11,556
Rural Residential (RR) 1,547 0% 0 5.0 0
Very Low Density Residential (VLDR) 152 50% 76 5.5 418
Subtotal: 32,076 13,329 70,076
UNDEVELOPED AREAS: HILLSIDE
25 % Slope 1,240 50% 620 4.5 2,790
40 % Slope 0 0% 0 0
Subtotal: 620 2,790
Developed Areas - Vacant Lots 2,917 1,666 4.5 7,497
Est. Future Residential Load Additions: 80,363
Est. Commercial Load Additions: 24,109
Total Estimated New Demand: 104,472
To accurately determine the portion of the costs of future capital infrastructure that should be included in the
impact fees, this analysis projects the future growth in demand units (kW/ERU). The demand unit used in the
calculation of the power impact fees is the estimated summer peak load, or power capacity, measured in
kilowatts (kW). The summer peak values are used because the City’s power system is required by the Federal
9 UC 11-36a-402(a)
PAGE 9
Lewis Young Robertson & Burningham, Inc. Salt Lake City, Utah 84101 Office 801.596.0700 Fax 801.596.2800LYRB IFFP AND IFA: MUNICIPAL POWER
ST. GEORGE UTAH JULY 10, 2014
Energy Regulatory Commission (FERC) and the North American Electric Reliability Corporation (NERC) to
meet national reliability standards, which dictate the required design load levels. These demand values are
consistent with the values used in the area Joint Systems Transmission Planning Study, which has been included
in this document as APPENDIX C. The St. George City Energy Services Department has projected the existing and
future kWs within the Power Service Area through 2025, but this IFFP focuses primarily on the next nine years.
TABLE 3.2 summarizes the projected annual increase in kWs within the Power Service Area.
TABLE 3.2: PROJECTED GROWTH IN ERUS AND KILOWATTS IN SERVICE AREA
YEAR LOAD GROWTH RATE NEW KW NEW ERUS
2012 176,000
2013 180,000 2.3% 4,000 598
2014 183,000 1.7% 3,000 448
2015 187,000 2.2% 4,000 598
2016 191,000 2.1% 4,000 598
2017 195,011 2.1% 4,011 600
2018 199,964 2.5% 4,953 740
2019 205,043 2.5% 5,079 759
2020 210,251 2.5% 5,208 778
2021 215,592 2.5% 5,340 798
2022 221,068 2.5% 5,476 819
2023 226,683 2.5% 5,615 839
2024 232,441 2.5% 5,758 861
2025 238,345 2.5% 5,904 883
Total kW (2013-2022) 41,068
It is anticipated that the growth projected over the next nine years will impact the City’s existing services. Power
facilities will need to be expanded in order to maintain the existing level of service. The IFFP, in conjunction with
the impact fee analysis, are designed to accurately assess the true impact of a particular user upon the City’s
infrastructure.
LEVEL OF SERVICE STANDARDS
Impact fees cannot be used to finance an increase in the level of service to current or future users of capital
improvements. Therefore, it is important to identify the power level of service within the Power Service Area to
ensure that the new capacities of projects financed through impact fees do not exceed the established standard.
The power level of service, as defined by the St. George City Energy Services Department, is shown below.
TABLE 3.3: LEVEL OF SERVICE
LOS
Existing Peak Load (kw) 169,000
Existing ERUs (2011) 25,261
kW/ERU 6.69
The level of service or average load per ERU (6.69 kW) was calculated by taking the peak load in 2010 of 169,000
kW and dividing by the total number of ERUs beginning in 2011 (25,261).
PAGE 10
Lewis Young Robertson & Burningham, Inc. Salt Lake City, Utah 84101 Office 801.596.0700 Fax 801.596.2800LYRB IFFP AND IFA: MUNICIPAL POWER
ST. GEORGE UTAH JULY 10, 2014
SECTION 4: EXISTING FACILTIES INVENTORY
This section is intended to summarize the existing public facilities related to power services. Generally, existing
assets are separated into two areas: (1) Power Resources; and, (2) City Transmission and Distribution System
Improvements.
VALUE OF EXISTING POWER INFRASTRUCTURE
Based upon the City’s 2011 electric utility depreciation schedule, the existing power system is valued at
approximately $144 million, based on original cost, as shown in TABLE 4.1.
TABLE 4.1: VALUE OF EXISTING POWER SYSTEM
ITEM ORIGINAL COST
Building $82,725,934
Improvements $7,320,600
Land $350,166
Other $54,120,200
Total $144,516,900
“Other” includes some distribution related improvements.
EXCESS CAPACITY
POWER RESOURCES
Careful management and planning of the City’s power energy resources is critical to maintain a reliable electrical
system and keep costs to a minimum. The cost of the power that the City must either purchase or generate is the
largest component of the Energy Services budget as well as the cost of power to the City’s customers. The figure
below, as well as TABLE 4.2, illustrates the existing resources available to the City.
FIGURE 4.1: ILLUSTRATION OF EXISTING POWER RESOURCES
PAGE 11
Lewis Young Robertson & Burningham, Inc. Salt Lake City, Utah 84101 Office 801.596.0700 Fax 801.596.2800LYRB IFFP AND IFA: MUNICIPAL POWER
ST. GEORGE UTAH JULY 10, 2014
TABLE 4.2: EXISTING POWER RESOURCES
CURRENT SOURCES CAPACITY MW (PEAK)
Colorado River Storage Project Contract (Hydro) Expires 2024
Western Replacement Power 19
Western System Power Pool 10
Actual Contracted Amount before Market Purchase 11
Deseret Generation and Transmission
Bonanza 1 – Coal 50
Contract Sales (Other Shafts) 20
City Owned Generation
Red Rock – Diesel (Emergency Only) 14
Bloomington – Diesel (Emergency Only) 11
Millcreek #1– Natural Gas (Summer Use Only - Peaking) 37
Millcreek #2- Natural Gas (Completed Construction-2010) 40
Renewable Resources
SunSmart Solar (Including Net Metering) 1
Long Term Purchase Contacts
Jordanelle Hydro (Heber sale) 4
Total Resources Available to the City 163
Other Available Sources
Short Term Market Purchases/Sales (1-3 year contracts)
Utah Associated Municipal Power (UAMPS)
Natural Gas (BP Long Term Gas Hedge) (35%-50% of Requirements into 2021)
The shape of an electrical system’s load indicates the type of resources that are needed to supply the load. The
City’s system is summer peaking, which is caused by the heavy air conditioning load during hot summer days.
A typical load profile for the City’s electrical system for the month of July is shown in Figure C.1 of APPENDIX B.
Figure C.2 is a typical load profile for the month of October. Also included is Figure C.3 which shows the
number of hours that the City’s electrical load is at or above a given load level. These graphs show that the peak
load level during the off peak months is significantly lower than the summer. This indicates that there is excess
capacity in the system during the winter months but no excess capacity in the summer months. In fact, the City
often has to go to the market to purchase power when demand peaks at a level higher than City sources are able
to provide.
In 2005 and 2008 the City added an additional 77 MW of capacity with Millcreek #1 and Millcreek #2. The City
has historically followed a policy to purchase power from the market until reaching -25 MW, at which point an
additional generation resource is constructed.
It is anticipated that an additional peaking resource would be required in the 2017-2018 timeframe. The peaking
resource could be in the form of a power contract or additional generation facility. However, since the type of
source has not yet been identified, the City has chosen not to include a cost for additional generation resources in
the impact fee study. Future generation will be evaluated on a case by case basis. The City may elect to enter
into long term peaking agreements with outside entities rather than constructing new generation facilities inside
the City. Once the City has defined the type of generation resource needed to meet growing demand, the impact
fees will be revised to include these costs if necessary.
Thus, the only generation cost shown in the impact fee is approximately $200,000 of improvements included
annually in order to keep the City’s existing generation facilities in top operating condition and maintain the
level of service due to added growth.
PAGE 12
Lewis Young Robertson & Burningham, Inc. Salt Lake City, Utah 84101 Office 801.596.0700 Fax 801.596.2800LYRB IFFP AND IFA: MUNICIPAL POWER
ST. GEORGE UTAH JULY 10, 2014
CITY TRANSMISSION & DISTRIBUTION FACILITIES
The City maintains a network of transmission and distribution infrastructure. While segments of this
infrastructure may have excess capacity, it is difficult to quantify the excess capacity within individual
transmission and distribution lines or segments. The system operates as a whole by having one area back up
another in the event of an outage. The Green Valley Transmission Line and Substation is one exception and has
been included as a buy-in component in the impact fee. The cost of the Green Valley infrastructure was
approximately $11,680,125 with a total capacity of 75 MW. The City estimates only 25 MW of capacity have been
used to date, leaving an excess capacity of 50 MW or 67 percent of the total capacity. In constructing substations
and transmission lines, it is not practical to build just to meet current growth/load due to economies of scale.
Thus, the Green Valley system was built at an optimal level related to cost. The substation only has one
transformer with room to expand with the addition of a second transformer. The Green Valley area is an
identified growth area and will be fed out of the new Green Valley system.
MANNER OF FINANCING EXISTING INFRASTRUCTURE
St. George Energy Services has funded its existing capital infrastructure through a combination of different
revenue sources, including user fee revenues, service fees, impact fees, and bond issues. Therefore, the City’s
existing “level of service” standards have been funded by the City’s existing residents. The City anticipates that
it may receive some donations from new development to fund a specific improvement (project improvement),
thus the cost of this improvement has been removed from the impact fees. Also, the City does not foresee
receiving revenues from other entities (i.e. grants, federal or state funds, other contributions, etc.) to fund new
facilities.
PAGE 13
Lewis Young Robertson & Burningham, Inc. Salt Lake City, Utah 84101 Office 801.596.0700 Fax 801.596.2800LYRB IFFP AND IFA: MUNICIPAL POWER
ST. GEORGE UTAH JULY 10, 2014
SECTION 5: CAPITAL FACILITY ANALYSIS
The projected resource needs for the next several years are indicated in this section. The estimated costs of future
capital projects are based on historical experience with the system and projected growth patterns for the system.
The proposed capital projects are separated into three areas: (1) Power Resource Improvements, (2) City
Transmission and Distribution System Improvements, and (3) Main Jointly Owned Transmission System
Improvements.
POWER RESOURCE IMPROVEMENTS
The only generation costs included in the impact fee is approximately $200,000 of improvements annually to
allow the City’s existing generation facilities to accommodate any impact on the generation related to projected
growth. While it is difficult to specifically identify the exact amount related to growth, the City is planning on
sharing these costs through the user rate, thus 50% of the costs are allocated to growth in the impact fee and 50%
are allocated to existing residents and included in the user rate.
It is anticipated that an additional peaking resource would be required in the 2017-2018 timeframe. The peaking
resource could be in the form of a power contract or additional generation facility. However, since the type of
source has not yet been identified, the City has chosen not to include a cost for additional generation resources in
the impact fee study. Once the City has defined the type of generation resource needed to meet growing
demand, the impact fees will be revised to include these costs if necessary.
CITY TRANSMISSION & DISTRIBUTION IMPROVEMENTS
Due to the increasing system loads, improvements to the system will be required in order to maintain the level of
service and deliver the increased load demand to the City’s electrical customers. Improvements to various
components of the system will be required to meet all of the FERC/NERC reliability standards. The needed
capital improvement projects are described below:
Distribution capacitors help provide voltage support to both the distribution and transmission systems.
Capacitors also improve overall system efficiency by reducing losses from the conductors and
transformers on the system caused by additional load. The budget total is $411,000 for the installation
of capacitors on the distribution system.
Due to growth, new distribution substations and improvements to the existing distribution substations
will be required to maintain reliable electric service to the City’s customers. The cost will be $6,106,000.
Improvements to subtransmission lines are ongoing as load grows so that single line failure does not
cut off service to a large number of customers for more than a short time. Budgeted cost is $1,389,000.
For new customer meters on the system, $1,001,000 has been budgeted. However, only 95% of these
meters are growth related. In addition, connection fees cover approximately 70% of the meter cost, thus
only 30% of the costs related to growth are included in the calculation of the impact fee.
The City is in the process of adding equipment to increase the number of meters that can be
automatically read by the City’s automatic meter reading system. $1,500,000 has been allocated for the
automatic meter reading system to account for future new meters.
In order to increase capacity and to improve system efficiency, $1,391,000 has been included in the
budget for reconductor portions of existing distribution lines rather than building new lines.
Yard additions will be necessary to house the equipment in the future. Budgeted costs are $572,000.
However, these costs are not attributed to growth, thus they are not included in the impact fee.
Several improvements to the City’s internal 69 kV transmission system will be needed to accommodate
growth. These improvements include work such as 69 kV switch installations and line/pole relocations.
The needed improvements are budgeted to cost $6,350,000.
The SCADA system, which monitors and controls the various system components, requires ongoing
improvements in order to keep the SCADA operating as required and to accommodate growth. The
various SCADA upgrades are estimated to cost $631,000 for the next nine budgeted years.
Budgeted cost for underground distribution projects and additions for growth is $2,785,000.
PAGE 14
Lewis Young Robertson & Burningham, Inc. Salt Lake City, Utah 84101 Office 801.596.0700 Fax 801.596.2800LYRB IFFP AND IFA: MUNICIPAL POWER
ST. GEORGE UTAH JULY 10, 2014
A budget amount of $1,531,000 has been allocated for miscellaneous smaller projects and improvements
on the City’s electrical system. However, these costs are not attributed to growth, thus they are not
included in the impact fee.
An amount of $351,000 has been budgeted to connect the City’s substations to the new fiber loop
system to accommodate growth of data being transferred.
Equipment improvements are needed for the substations to keep the flow of electricity to customers.
Over the next nine years the cost will be $5,781,000. However, only $2,711,317 of the total cost will be
related to growth and is included in the impact fee analysis.
The City anticipates the need for the construction of a 69kV transmission line to serve the area from
approximately mile marker 6 on State Route 18 north to the existing City limit at Winchester Hills to
accommodate growth in the area. Cost in the year 2022 is estimated to be $9,540,000. At this time,
however, the City has not determined the final cost and the manner in which this project will be funded
and therefore has not included this cost in the impact fee calculation.
Construct Dixie 138 kV Tie – West Side transmission line. $2,470,000 is budgeted for 2019 to cover these
costs. This line will provide backup to the entire system.
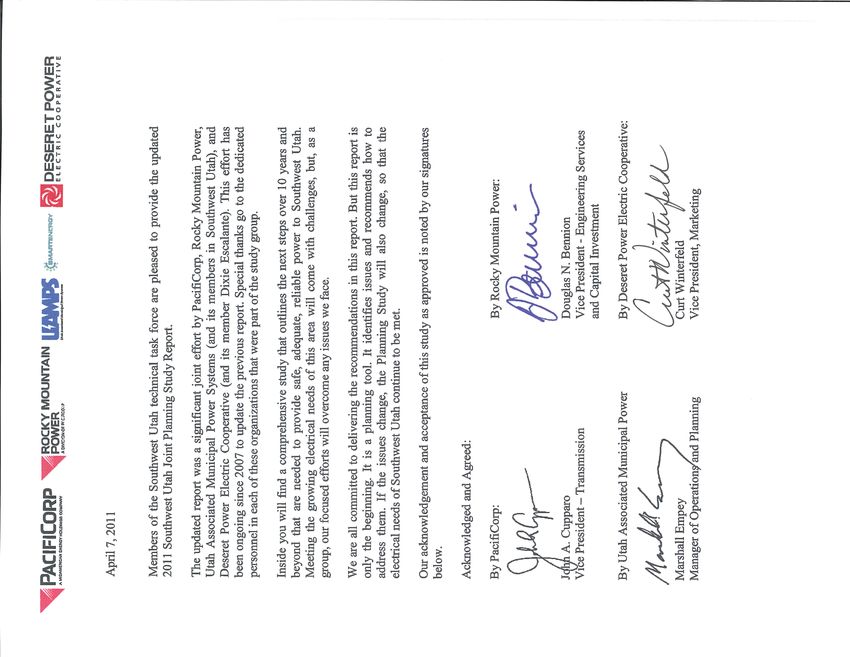
MAIN TRANSMISSION SYSTEM IMPROVEMENTS
The main transmission system which supplies power to Washington County (the “County”) is owned and
operated by several utilities and organizations. Over the past several years the utilities in the County have spent
considerable time and effort to develop system plans to serve the increasing loads supplied by the various
County utilities (Joint Plan System). The results of these cooperative efforts will be a more reliable electrical
system, which also minimizes overall costs of the system by reducing the need for duplicate facilities. This
cooperative effort has been referred to as the “one system plan-Joint System Plan”, meaning that the planning
and installation of main transmission infrastructure for the County will be developed similar to the approach if a
single utility served all of the loads in the County. The City receives its power supply from two transmission
systems, UAMPS and PacifiCorp. The most recent Joint Plan Study has been attached as APPENDIX C and needed
improvements are outlined in this plan.
SOUTHWEST UTAH JOINT TRANSMISSION PROJECTS
Expand the area with additional looped 138 kV transmission throughout the study period
Establish a new 138 kV delivery point and 138/69 kV substation in west Hurricane around 2014 with
future 345 kV capability
Expand St. George substation to 345 kV operation and install a 345/138 kV transformer by 2015
Energize a 4th circuit between Red Butte and St. George at 345 kV by 2015
Re-conductor St. George-fields 138 kV line with high temperature conductor by 2017
Energize 2nd 345 kV circuit between Red Butte and St. George and add second 345/138 kV transformer at
St. George by 2021
Re-conductor St. George-Skyline #1 and #2 lines with high temperature conductor by 2022
Construct new St. George-Hurricane 345 kV Line (initially operated 138kV) by 2023
Construct Three Peaks-Hurricane 345 kV line to coincide with PacifiCorp Transmission requirements,
energize St. George-Hurricane line at 345 kV, and install 345/138 kV transformation at proposed
Hurricane West substation
Most of these joint transmission improvements are put into the rate base because they become an operating
expense due to the City not having direct ownership or debt obligations. Thus these improvements are not
included in the capital requirements for the City.
SUMMARY OF FUTURE CAPITAL PROJECTS
Based upon the projected increase in kilowatts and demand on the system, the City has identified the future
power capital projects that must be constructed over the next nine years to serve future development. The costs
of these projects are detailed in TABLE 5.1 and summarized in TABLE 5.2. The percentage of the total costs that is
attributable to growth is based upon information provided by the City’s Energy Services Department. All of the
PAGE 15
Lewis Young Robertson & Burningham, Inc. Salt Lake City, Utah 84101 Office 801.596.0700 Fax 801.596.2800LYRB IFFP AND IFA: MUNICIPAL POWER
ST. GEORGE UTAH JULY 10, 2014
projects listed in the table below have a life expectancy of more than 10 years. In addition, projects listed as
“additions” or “improvements” only include the cost of added capacity to serve new growth and does not
include the cost to replace the existing improvement.
TABLE 5.1: FUTURE POWER CAPITAL PROJECT COSTS
CONSTRUCTION % TO INFLATED COST % IMPACT
POWER PROJECTS YEAR 2011 COST SUBTOTALS
YEAR COSTS GROWTH TO GROWTH FEE FUNDED
RESOURCES
Generation Additions 2013 $200,000 $204,020 50% $102,010 100% $102,010
Generation Additions 2014 $206,000 $212,242 50% $106,121 100% $106,121
Generation Additions 2015 $212,180 $220,795 50% $110,398 100% $110,398
Generation Additions 2016 $218,545 $229,693 50% $114,846 100% $114,846
Generation Additions 2017 $225,102 $238,950 50% $119,475 100% $119,475
Generation Additions 2018 $231,855 $248,580 50% $124,290 100% $124,290
Generation Additions 2019 $238,810 $258,597 50% $129,299 100% $129,299
Generation Additions 2020 $245,975 $269,019 50% $134,510 100% $134,510
Generation Additions 2021 $253,354 $279,860 50% $139,930 100% $139,930
Generation Additions 2022 $260,955 $291,139 50% $145,570 100% $145,570
Total Other Resources $2,292,776 $2,452,897 $1,226,448 $1,226,448
DISTRIBUTION AND TRANSMISSION
Distribution Capacitors 2013 $74,000 $75,487 100% $75,487 100% $75,487
Distribution Capacitors 2015 $78,000 $81,167 100% $81,167 100% $81,167
Distribution Capacitors 2017 $83,000 $88,106 100% $88,106 100% $88,106
Distribution Capacitors 2019 $88,000 $95,291 100% $95,291 100% $95,291
Distribution Capacitors 2021 $88,000 $97,207 100% $97,207 100% $97,207
Distribution Substations - New
2014 $1,353,000 $1,393,997 100% $1,393,997 100% $1,393,997
& Improvements
Distribution Substations - New
2016 $1,523,000 $1,600,688 100% $1,600,688 100% $1,600,688
& Improvements
Distribution Substations - New
2018 $1,615,000 $1,731,499 100% $1,731,499 100% $1,731,499
& Improvements
Distribution Substations - New
2021 $1,615,000 $1,783,965 100% $1,783,965 100% $1,783,965
& Improvements
Subtransmission Line
2013 $246,000 $250,945 100% $250,945 100% $250,945
Improvements
Subtransmission Line
2014 $127,000 $130,848 100% $130,848 100% $130,848
Improvements
Subtransmission Line
2017 $130,000 $137,998 100% $137,998 100% $137,998
Improvements
Subtransmission Line
2018 $178,000 $190,840 100% $190,840 100% $190,840
Improvements
Subtransmission Line
2020 $189,000 $206,707 100% $206,707 100% $206,707
Improvements
Subtransmission Line
2021 $330,000 $364,525 100% $364,525 100% $364,525
Improvements
Subtransmission Line
2022 $189,000 $210,861 100% $210,861 100% $210,861
Improvements
Meters 2013 $50,000 $51,005 95% $48,455 30% $14,536
Meters 2014 $95,000 $97,879 95% $92,985 30% $27,895
Meters 2015 $98,000 $101,979 95% $96,880 30% $29,064
Meters 2016 $101,000 $106,152 95% $100,844 30% $30,253
Meters 2017 $104,000 $110,398 95% $104,878 30% $31,463
Meters 2018 $107,000 $114,718 95% $108,983 30% $32,695
Meters 2019 $110,000 $119,114 95% $113,159 30% $33,948
Meters 2020 $113,000 $123,586 95% $117,407 30% $35,222
PAGE 16
Lewis Young Robertson & Burningham, Inc. Salt Lake City, Utah 84101 Office 801.596.0700 Fax 801.596.2800LYRB IFFP AND IFA: MUNICIPAL POWER
ST. GEORGE UTAH JULY 10, 2014
CONSTRUCTION % TO INFLATED COST % IMPACT
POWER PROJECTS YEAR 2011 COST SUBTOTALS
YEAR COSTS GROWTH TO GROWTH FEE FUNDED
Meters 2021 $110,000 $121,508 95% $115,433 30% $34,630
Meters 2022 $113,000 $126,071 95% $119,767 30% $35,930
AMR Remote Metering 2014 $500,000 $515,151 80% $412,120 100% $412,120
AMR Remote Metering 2015 $500,000 $520,302 80% $416,242 100% $416,242
AMR Remote Metering 2016 $500,000 $525,505 80% $420,404 100% $420,404
Reconductor Distribution Lines 2013 $123,000 $125,472 100% $125,472 100% $125,472
Reconductor Distribution Lines 2014 $127,000 $130,848 100% $130,848 100% $130,848
Reconductor Distribution Lines 2015 $130,000 $135,279 100% $135,279 100% $135,279
Reconductor Distribution Lines 2016 $134,000 $140,835 100% $140,835 100% $140,835
Reconductor Distribution Lines 2017 $138,000 $146,490 100% $146,490 100% $146,490
Reconductor Distribution Lines 2018 $143,000 $153,315 100% $153,315 100% $153,315
Reconductor Distribution Lines 2019 $147,000 $159,180 100% $159,180 100% $159,180
Reconductor Distribution Lines 2020 $151,000 $165,146 100% $165,146 100% $165,146
Reconductor Distribution Lines 2021 $147,000 $162,379 100% $162,379 100% $162,379
Reconductor Distribution Lines 2022 $151,000 $168,466 100% $168,466 100% $168,466
Yard Additions 2014 $127,000 $130,848 0% $0 0% $0
Yard Additions 2018 $143,000 $153,315 0% $0 0% $0
Yard Additions 2020 $151,000 $165,146 0% $0 0% $0
Yard Additions 2022 $151,000 $168,466 0% $0 0% $0
SCADA Improvements 2015 $150,000 $156,091 100% $156,091 100% $156,091
SCADA Improvements 2018 $160,000 $171,542 100% $171,542 100% $171,542
SCADA Improvements 2021 $170,000 $187,786 100% $187,786 100% $187,786
SCADA Improvements 2022 $151,000 $168,466 100% $168,466 100% $168,466
Underground Projects &
2013 $246,000 $250,945 100% $250,945 100% $250,945
Additions
Underground Projects &
2014 $253,000 $260,666 100% $260,666 100% $260,666
Additions
Underground Projects &
2015 $261,000 $271,598 100% $271,598 100% $271,598
Additions
Underground Projects &
2016 $269,000 $282,722 100% $282,722 100% $282,722
Additions
Underground Projects &
2017 $277,000 $294,041 100% $294,041 100% $294,041
Additions
Underground Projects &
2018 $285,000 $305,559 100% $305,559 100% $305,559
Additions
Underground Projects &
2019 $294,000 $318,360 100% $318,360 100% $318,360
Additions
Underground Projects &
2020 $303,000 $331,387 100% $331,387 100% $331,387
Additions
Underground Projects &
2021 $294,000 $324,759 100% $324,759 100% $324,759
Additions
Underground Projects &
2022 $303,000 $338,048 100% $338,048 100% $338,048
Additions
Miscellaneous Projects 2013 $135,000 $137,714 0% $0 0% $0
Miscellaneous Projects 2014 $139,000 $143,212 0% $0 0% $0
Miscellaneous Projects 2015 $144,000 $149,847 0% $0 0% $0
Miscellaneous Projects 2016 $148,000 $155,549 0% $0 0% $0
Miscellaneous Projects 2017 $152,000 $161,351 0% $0 0% $0
Miscellaneous Projects 2018 $157,000 $168,325 0% $0 0% $0
Miscellaneous Projects 2019 $162,000 $175,423 0% $0 0% $0
Miscellaneous Projects 2020 $166,000 $181,552 0% $0 0% $0
Miscellaneous Projects 2021 $162,000 $178,949 0% $0 0% $0
Miscellaneous Projects 2022 $166,000 $185,201 0% $0 0% $0
PAGE 17
Lewis Young Robertson & Burningham, Inc. Salt Lake City, Utah 84101 Office 801.596.0700 Fax 801.596.2800LYRB IFFP AND IFA: MUNICIPAL POWER
ST. GEORGE UTAH JULY 10, 2014
CONSTRUCTION % TO INFLATED COST % IMPACT
POWER PROJECTS YEAR 2011 COST SUBTOTALS
YEAR COSTS GROWTH TO GROWTH FEE FUNDED
Fiber Optic Projects 2013 $31,000 $31,623 100% $31,623 100% $31,623
Fiber Optic Projects 2014 $32,000 $32,970 100% $32,970 100% $32,970
Fiber Optic Projects 2015 $33,000 $34,340 100% $34,340 100% $34,340
Fiber Optic Projects 2016 $34,000 $35,734 100% $35,734 100% $35,734
Fiber Optic Projects 2017 $35,000 $37,153 100% $37,153 100% $37,153
Fiber Optic Projects 2018 $36,000 $38,597 100% $38,597 100% $38,597
Fiber Optic Projects 2019 $37,000 $40,066 100% $40,066 100% $40,066
Fiber Optic Projects 2020 $38,000 $41,560 100% $41,560 100% $41,560
Fiber Optic Projects 2021 $37,000 $40,871 100% $40,871 100% $40,871
Fiber Optic Projects 2022 $38,000 $42,395 100% $42,395 100% $42,395
Miscellaneous Substation
2013 $12,000 $12,241 100% $12,241 100% $12,241
(Improve Equip)
Miscellaneous Substation
2014 $25,000 $25,758 100% $25,758 100% $25,758
(Improve Equip)
Miscellaneous Substation
2016 $1,008,000 $1,059,418 0% $0 0% $0
(Improve Equip)
Miscellaneous Substation
2018 $1,141,000 $1,223,306 0% $0 0% $0
(Improve Equip)
Miscellaneous Substation
2020 $1,210,000 $1,323,359 100% $1,323,359 100% $1,323,359
(Improve Equip)
Miscellaneous Substation
2021 $1,175,000 $1,297,931 0% $0 0% $0
(Improve Equip)
Miscellaneous Substation
2022 $1,210,000 $1,349,959 100% $1,349,959 100% $1,349,959
(Improve Equip)
Ledges Transmission Line 2022 $0 100% $0 0% $0
Substation Capacitor Banks 69
2017 $1,000,000 $1,061,520 100% $1,061,520 100% $1,061,520
kV and 15 kV
Dixie 138 kV Tie - West Side 2019 $2,470,000 $2,674,656 100% $2,674,656 100% $2,674,656
Install 2nd 138 kV Transformer
2016 $2,500,000 $2,627,525 100% $2,627,525 100% $2,627,525
in Green Valley Sub
Reconductor Twin Lakes Tap to
2015 $1,750,000 $1,821,057 100% $1,821,057 100% $1,821,057
Flood Street 69 kV
Green Valley to the Lakes North
2018 $1,100,000 $1,179,349 100% $1,179,349 100% $1,179,349
Transmission Line
Total Distribution and
$32,269,000 $34,509,165 $28,307,799 $27,594,646
Transmission
TOTAL COSTS: $34,561,776 $36,962,061 $29,534,247 $28,821,094
TABLE 5.2: SUMMARY OF FUTURE POWER CAPITAL PROJECT COSTS
% OF TOTAL COSTS TO
COST OF FUTURE CAPITAL TOTAL COSTS TO GROWTH &
SERVICE GROWTH & IMPACT
PROJECTS * IMPACT FEE
FEES**
Generation Additions $2,452,897 50% $1,226,448
Distribution and Transmission $34,509,165 80% $27,594,646
* The Cost of Future Capital Projects includes 1% annual construction inflation. **Generation additions are being allocated 50% to growth and
the other 50% to replace depreciated equipment. The distribution and transmission is being allocated 80%, which is the aggregate percentage of
all the projects listed in TABLE 5.1. Some of the projects are only being partially allocated to growth because some of the funds will be spent on
replacement of existing equipment (i.e. meters and AMR).
The City of St. George Energy Services Department has prepared this capital plan using capital project and
engineering data, planning analysis and other information provided by the Energy Services staff. The City has
provided all future capital project data including project descriptions and estimated project costs. The accuracy
and correctness of this plan is contingent upon the accuracy of the data and assumptions. Any deviations or
PAGE 18
Lewis Young Robertson & Burningham, Inc. Salt Lake City, Utah 84101 Office 801.596.0700 Fax 801.596.2800LYRB IFFP AND IFA: MUNICIPAL POWER
ST. GEORGE UTAH JULY 10, 2014
changes in the assumptions due to changes in the economy or other relevant information used by the City for
this study may cause this plan to be inaccurate and may require modifications.
SYSTEM VS. PROJECT IMPROVEMENTS
System improvements are defined as existing and future public facilities that are intended to provide services to
service areas within the community at large.10 Project improvements are improvements and facilities that are
planned and designed to provide service for a specific development (resulting from a development activity) and
considered necessary for the use and convenience of the occupants or users of that development. 11 The Impact
Fee Analysis may only include the costs of impacts on system improvements related to new growth within the
proportionate share analysis. One example of a project improvement is The Ledges transmission line which has
not been included in the calculation of the impact fee. However, impact fees will be used for the substations, etc
since these are considered system improvements.
FUNDING OF FUTURE FACILITIES
UTILITY RATE REVENUES
Utility rate revenues serve as the primary funding mechanism within enterprise funds. Rates are established to
ensure appropriate coverage of all operations and maintenance expenses, debt service coverage, and non-growth
related capital project needs.
GRANTS AND DONATIONS
The City does not anticipate receiving grants or donations to fund improvements currently contemplated in this
IFFP. However, the impact fees will be adjusted if grants become available to reflect the grant monies received.
A donor will be entitled to a reimbursement for the value of the system improvements funded through impact
fees if donations are made by new development. SECTION 6 further addresses proposed credits owed to
development.
IMPACT FEE REVENUES
Impact fees have become a logical mechanism for funding growth-related infrastructure. Impact fees are
charged to ensure that new growth pays its proportionate share of the costs for the development of public
infrastructure. Impact fee revenues can also be attributed to the future expansion of public infrastructure if the
revenues are used to maintain an existing level of service. Increases to an existing level of service cannot be
funded with impact fee revenues. Analysis is required to accurately assess the true impact of a particular user
upon the City infrastructure and to prevent existing users from subsidizing new growth. The following
paragraphs discuss other issues pertaining to impact fees. Impact fee revenues are generally considered non-
operating revenues and help offset future capital costs.
DEBT FINANCING
In the event the City has not accumulated sufficient impact fees to pay for the construction of time sensitive or
urgent capital projects needed to accommodate new growth, the City must look to revenue sources other than
impact fees for funding. The Impact Fees Act allows for the costs related to the financing of future capital
projects to be legally included in the impact fee. This allows the City to finance and quickly construct
infrastructure for new development and reimburse itself later from impact fee revenues for the costs of issuing
debt. However, at the request of the City, no financing costs are included in this analysis.
EQUITY OF IMPACT FEES
Impact fees are intended to recover the costs of capital infrastructure that relate to future growth. The impact fee
calculations are structured for impact fees to fund 100% of the growth-related facilities identified in the
proportionate share analysis as presented in the impact fee analysis. Even so, there may be years that impact fee
revenues cannot cover the annual growth-related expenses. In those years, other revenues such as general utility
10 11-36a-102(20)
11 11-36a102(13)
PAGE 19
Lewis Young Robertson & Burningham, Inc. Salt Lake City, Utah 84101 Office 801.596.0700 Fax 801.596.2800LYRB IFFP AND IFA: MUNICIPAL POWER
ST. GEORGE UTAH JULY 10, 2014
rate revenues will be used to make up any annual deficits. Any borrowed funds are to be repaid in their entirety
through impact fees.
NECESSITY OF IMPACT FEES
An entity may only impose impact fees on development activity if the entity’s plan for financing system
improvements establishes that impact fees are necessary to achieve parity between existing and new
development. This analysis has identified the improvements to public facilities and the funding mechanisms to
complete the suggested improvements. Impact fees are identified as a necessary funding mechanism to help
offset the costs of new capital improvements related to new growth. In addition, alternative funding mechanisms
are identified to help offset the cost of future capital improvements.
PAGE 20
Lewis Young Robertson & Burningham, Inc. Salt Lake City, Utah 84101 Office 801.596.0700 Fax 801.596.2800LYRB IFFP AND IFA: MUNICIPAL POWER
ST. GEORGE UTAH JULY 10, 2014
SECTION 6: POWER IMPACT FEE CALCULATION
PROPOSED POWER IMPACT FEES
The calculation of impact fees relies upon the information contained in this analysis. Impact fees are calculated
based on many variables centered on proportionality and level of service. The following paragraph briefly
discusses the methodology for calculating impact fees.
PLAN BASED (FEE BASED ON DEFINED CIP)
Impact fees can be calculated using a specific set of costs specified for future development. The improvements
are identified in the IFFP, CFP or CIP as growth related projects. The total project costs are divided by the total
demand units the projects are designed to serve. Under this methodology, it is important to identify the existing
level of service and determine any excess capacity in existing facilities that could serve new growth.
POWER IMPACT FEE CALCULATION
Based on the growth-related projects, as well as the applicable buy-in fee, the cost per new kW is estimated at
$858, as described below in TABLE 6.1.
TABLE 6.1: ILLUSTRATION OF COST PER NEW KW
% GROWTH
TOTAL COSTS GROWTH RELATED
RELATED & GROWTH COST PER
POWER PROJECTS WITHIN IFFP & IMPACT FEE
IMPACT FEE RELATED KW NEW KW
HORIZON FUNDED COSTS
FUNDED
CAPITAL PROJECTS
Generation Additions $2,452,897 50% $1,226,448 41,068 $29.86
Distribution and Transmission $34,509,165 80% $27,594,646 41,068 $671.93
Sub-Total Capital Projects Cost $36,962,061 $28,821,094 $701.79
BUY-IN
Green Valley $11,680,125 67% $7,786,750 50,000 $155.73
Sub-Total Buy-In Cost $11,680,125 $7,786,750 $155.73
OTHER
Professional Expense12 $9,675 100% $9,675 25,043 $0.39
Sub-Total Other Cost $9,675 $9,675 $0.39
Total13 $48,651,861 $36,617,519 $857.91
The fee per kW is then applied to the general usage statistics for residential and commercial users, as shown in
the TABLE 6.2, TABLE 6.3 and TABLE 6.4 below.
TABLE 6.2: ILLUSTRATION OF RESIDENTIAL IMPACT FEE
SERVICE DESCRIPTION EST. KW COST PER KW IMPACT FEE 2006 FEE14 % CHANGE
100 Amp - 240/120 V 4.25 $858 $3,646 $2,790 31%
200 Amp - 240/120 V 5.25 $858 $4,504 $3,446 31%
400 Amp - 240/120 V 9.00 $858 $7,721 $5,908 31%
12 This is the actual cost to update the IFFP and IFA. The City can use this portion of the impact fee to reimburse itself for the
expense of updating the IFFP and IFA. The cost is divided over the new kWs generated in the next six years.
13 As of June 30, 2013 the electric utility impact fee fund balance was negative and thus not shown in the calculation of the
impact fee above.
14 When the existing fee was adopted in 2006, it was adopted at 75 percent of what was recommended.
PAGE 21
Lewis Young Robertson & Burningham, Inc. Salt Lake City, Utah 84101 Office 801.596.0700 Fax 801.596.2800You can also read