MultiEarth 2022 - Multimodal Learning for Earth and Environment Workshop and Challenge
←
→
Page content transcription
If your browser does not render page correctly, please read the page content below
MultiEarth 2022 – Multimodal Learning for Earth and Environment
                                                                      Workshop and Challenge

                                               Miriam Cha1 , Kuan Wei Huang2 , Morgan Schmidt2 , Gregory Angelides1 , Mark Hamilton2 ,
                                            Sam Goldberg2 , Armando Cabrera3 , Phillip Isola2 , Taylor Perron2 , Bill Freeman2 , Yen-Chen Lin2 ,
                                                                          Brandon Swenson3 , Jean Piou1
arXiv:2204.07649v3 [cs.CV] 31 May 2022

                                                            1
                                                             MIT Lincoln Laboratory, [miriam.cha, gregangelides, jepiou]@ll.mit.edu
                                                  2
                                                      MIT, [kwhuang, morgansc, markth, sgoldberg, phillipi, perron, billf, yenchenl]@mit.edu
                                                          3
                                                            DAF MIT AI Accelerator, [armando.cabrera, brandon.swenson.2]@us.af.mil

                                                                  Abstract                                      task, but SAR images are more difficult for humans to in-
                                                                                                                terpret than optical images. A key component of this chal-
                                             The Multimodal Learning for Earth and Environment                  lenge is to monitor the Amazon rainforest in all weather
                                         Challenge (MultiEarth 2022) will be the first competi-                 and lighting conditions using our multimodal remote sens-
                                         tion aimed at the monitoring and analysis of deforesta-                ing dataset, which includes a time series of multispectral
                                         tion in the Amazon rainforest at any time and in any                   and SAR images. The 2022 Multimodal Learning for Earth
                                         weather conditions. The goal of the Challenge is to pro-               and Environment Challenge (MultiEarth 2022) will be the
                                         vide a common benchmark for multimodal information pro-                first competition aimed at monitoring the Amazon rainfor-
                                         cessing and to bring together the earth and environmen-                est and predicting deforestation using multimodal represen-
                                         tal science communities as well as multimodal represen-                tation learning methods.
                                         tation learning communities to compare the relative mer-                   While considerable research has been devoted to track-
                                         its of the various multimodal learning methods to defor-               ing changes in forests [4, 6, 8, 9], the analyses typically rely
                                         estation estimation under well-defined and strictly com-               on passive, optical sensors such as the U.S. Geological Sur-
                                         parable conditions. MultiEarth 2022 will have three sub-               vey’s Landsat, NASA’s Moderate Resolution Imaging Spec-
                                         challenges: 1) matrix completion, 2) deforestation esti-               troradiometer (MODIS), and the European Space Agency’s
                                         mation, and 3) image-to-image translation. This paper                  Sentinel-2 [1]. These passive, optical sensors need an un-
                                         presents the challenge guidelines, datasets, and evaluation            obstructed and illuminated view of the scene in order to
                                         metrics for the three sub-challenges. Our challenge web-               capture meaningful images. This limits their effectiveness
                                         site is available at https://sites.google.com/                         in monitoring the Amazon rainforest with year-round cloud
                                         view/rainforest-challenge.                                             coverage. Beyond the Amazon, approximately 67 percent
                                                                                                                of Earth’s surface is typically covered by clouds [7]. There-
                                                                                                                fore, using SAR for cloud-free observation will have a
                                         1. Introduction                                                        broad applicability.
                                                                                                                    MultiEarth 2022 will conduct the following sub-
                                             Despite international efforts to reduce deforestation, the         challenges to support the interpretation and analysis of the
                                         world loses, so far, an area of forest that is equivalent to the       rainforest at any time and any weather conditions:
                                         size of 40 football fields every minute [11]. Deforestation in
                                         the Amazon rainforest accounts for the largest share, con-                • Matrix Completion Sub-Challenge: given remote
                                         tributing to reduced biodiversity, habitat loss, and climate                sensing images taken at different locations and dates,
                                         change. Since much of the region is difficult to access, satel-             and in different modalities, participants are required to
                                         lite remote sensing offers a powerful tool to track changes                 predict appearance at a novel [lon, lat, date, modal-
                                         in the Amazon. However, obtaining a continuous time series                  ity] query. Performance is measured on the following
                                         of images is hindered by seasonal weather, clouds, smoke,                   visual metrics: Peak Signal-to-Noise Ratio (PSNR),
                                         and other inherent limitations of optical sensors. Synthetic                Structural Similarity Index Measure (SSIM) [10],
                                         aperture radar (SAR), which is insensitive to lighting and                  Learned Perceptual Image Patch Similarity (LPIPS)
                                         weather conditions, appears to be a well suited tool for the                [12], and Fréchet Inception Distance (FID) [5]. De-

                                                                                                            1
tailed challenge description is provided in Section 3.1.
• Deforestation Estimation Sub-Challenge: beyond
visual appearance, participants are required to classify
whether a region is deforested or not at a novel [lon,
lat, date, modality] query. Modality will be ‘deforesta-
tion’ for this sub-challenge. Participants will be given
the multimodal remote sensing dataset along with the
deforestation label maps. Performance is measured on
the following metrics: pixel accuracy, F1 score, and
Intersection over Union (IoU). Detailed description of
this sub-challenge can be found in Section 3.2.
• Image-to-Image Translation Sub-Challenge: partic-
ipants are required to predict a set of possible cloud-
free corresponding optical images given an input SAR
image. For this sub-challenge, we provide an aligned
dataset (e.g. [x, [y1 , y2 , ..., yN ]]) where an input SAR
image x is paired to a set of ground truth optical im-
agesP[y1 , y2 , ..., yN ]. Performance is evaluated based
on j mini kf (x)i − yj k where f (·) is a prediction
of y given x, and f may make multiple predictions in-
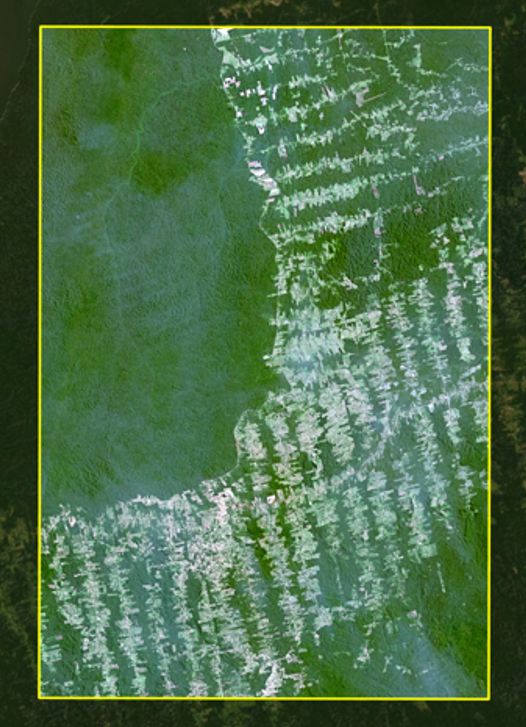
Figure 1. Study area in the Amazon, bounded by (4.39◦ S, 55.2◦
dexed by i. Detailed guideline of the sub-challenge is
W), (4.39◦ S, 54.48◦ W), (3.33◦ S, 54.48◦ W) and (3.33◦ S, 55.2◦
provided in Section 3.3. W).
To be eligible to participate in the challenge, every entry
has to be accompanied by a paper presenting the results and
the methods that created them, which will undergo peer- S, 54.48◦ W) and (3.33◦ S, 55.2◦ W) as shown in Fig-
review. The organizers reserve the right to re-evaluate the ure 1. This area is further divided into squares centered
findings, but will not participate in the Challenge. on 54 × 37 = 1998 coordinate pairs by iterating in 0.02◦
increments in the latitude and longitude directions. Our
2. Datasets dataset consists of 11,978,118 total training images. (Note
that the image-to-image translation sub-challenge will use
2.1. Multimodal Remote Sensing Dataset a subset of the total training images.) Test images are
Participants will receive a multimodal remote sens- selected from the middle 7 columns (from longitudes -
ing dataset that consists of Sentinel-1, Sentinel-2, Land- 54.78 to -54.90), which are withheld as test region. The
sat 5, and Landsat 8 as reported in Table 1. Sentinel-1 training images come from all bands and dates from the
uses a synthetic aperture radar (SAR) instrument, which 4 sensor collections specified in Table 1 covering the
collects in two polarization bands: VV (vertical trans- area outside of the test region. Each image file name is
mit/vertical receive) and VH (vertical transmit/horizontal in the format {Collection} {Band} {Longitude}
receive). Sentinel-2, Landsat 5, and Landsat 8 use optical {Latitude} {Year} {Month} {Day}.tiff. Sample
instruments, which measure in spectral bands in the visible images of Sentinel-1, Sentinel-2, Landsat 5, and Landsat 8
and infrared spectra. We also include in the dataset the as- from our dataset are shown in Figure 2.
sociated layers with cloud quality for Sentinel-2, Landsat 5, Satellite images from this dataset are downloaded us-
and Landsat 8 (i.e. QA60 and QA PIXEL). Detailed band ing Google’s Earth Engine platform. Each coordinate pair
designations for each sensor can be found in Google Earth is projected from UTM (Universal Transverse Mercator)
Engine Data Catalog1 . to EPSG (European Petroleum Survey Group). Then a
The region of interest is the rectangle bounded by the 256×256 image centered at the coordinate is extracted for
points (4.39◦ S, 55.2◦ W), (4.39◦ S, 54.48◦ W), (3.33◦ Sentinel-1 and Sentinel-2, and a 85×85 image centered at
1 Sentinel-1: https://developers.google.com/earth- engine/ the coordinate is extracted for Landsat 5 and Landsat 8.
datasets/catalog/COPERNICUS_S1_GRD The difference in pixels accounts for the 10-meter resolu-
Sentinel-2: https : / / developers . google . com / earth - engine /
datasets/catalog/COPERNICUS_S2_SR
tion Sentinel-1 and Sentinel-2 vs the 30-meter resolution
Landsat 5: https : / / developers . google . com / earth - engine / Landsat 5 and Landsat 8. If the Landsat images are upsam-
datasets/catalog/LANDSAT_LT05_C02_T1_L2
Landsat 8: https : / / developers . google . com / earth - engine /
pled to 256×256, they will be geospatially aligned with the
datasets/catalog/LANDSAT_LC08_C02_T1_L2 Sentinel images.
2
Sensor         Time                  Bands                 Resolution (m)         # Images       Link
                                                                                                                     link1
                   Sentinel-1   2014-2021                VV, VH                        10              859,627
                                                                                                                     link2
                                                  B1, B2, B3, B4, B5,
                                                                                                                     link1
                   Sentinel-2   2018-2021        B6, B7, B8, B8A, B9,                  10             5,395,559
                                                                                                                     link2
                                                   B11, B12, QA60
                                                SR B1, SR B2, SR B3,
                                                                                                                     link1
                   Landsat 5    1984-2012       SR B4, SR B5, ST B6,                   30             3,550,368
                                                                                                                     link2
                                                  SR B7, QA PIXEL
                                                SR B1, SR B2, SR B3,
                                                                                                                     link1
                   Landsat 8    2013-2021       SR B4, SR B5, SR B6,                   30             2,172,564
                                                                                                                     link2
                                              SR B7, ST B10, QA PIXEL

       Table 1. Overview of our multimodal remote sensing dataset that includes Sentinel-1, Sentinel-2, Landsat 5, and Landsat 8.

   The dataset can be downloaded from the links provided               time slices in Figure 3.
in Table 1. Data is freely available for development, re-
search, or educational purposes. For more details, please              3. Challenge Tasks
refer to Google Earth Engine License Agreement2 .
                                                                       3.1. Matrix Completion Sub-Challenge
2.2. Deforestation Labels
                                                                       Problem Definition. Most studies of forest monitoring
    Labeled data of deforestation for training and testing are         rely on remote sensing data collected by optical sensors
manually labeled using cloud-free monthly mosaic satellite             [4,6,8,9]. However, it is often difficult, particularly in moist
images from Planet [2]. The Planet imagery has 3.7 m spa-              forest areas like the Amazon rainforest, to obtain cloud-
tial resolution and consists of 3 bands (RGB) with images              free images. This sub-challenge focuses on filling in spatial,
from a single month joined together to achieve an image                temporal, and modality gaps in remote sensing data, espe-
with the least amount of cloud cover. Most are cloud-free              cially gaps created by unfavorable lighting, weather con-
but some have a few clouds. Eleven time slices (months)                ditions, or other atmospheric factors. The Matrix Comple-
are labeled over six years, from 2016 to 2021. They in-                tion Sub-Challenge represents the sensory world as a huge
clude: 08/2016; 07, 08/2017; 06, 08/2018; 07, 08/2019; 06,             tensor of measurements, in multiple modalities, sampled
08/2020; and 05, 08/2021. The August 2016 image con-                   at different places and times. This tensor is typically very
tains a greater number of clouds and artifacts for the mo-             sparse, with most measurements missing, since satellites
saic process. August 2021 is labeled by the authors and the            only photograph a tiny fraction of all possible wavelengths
remaining ten are labeled by the team at Scale AI [3]. The             at all possible positions on the globe at all possible points
following guidelines are used by Scale AI to label defor-              in time. Participants are required to solve the tensor comple-
ested areas within polygons: 1) areas deforested for human             tion problem on this huge yet sparse multidimensional mea-
use in any stage of regrowth; 2) forested areas 1 hectare              surement tensor, and may develop and use methods from
or larger with unbroken forest canopy are not labeled; 3)              representation learning and generative modeling, or may
roads are included as deforested if clearly visible; 4) rivers         consider other approaches.
going through deforested areas are left unlabeled if their             Data. Training set from the multimodal remote sensing
area is greater than 1 hectare; 5) clouds or image artifacts           dataset described in Section 2.1 is provided.
are not labeled; 6) snapping was used during labeling to
                                                                       Metrics. To rank all submissions to this sub-challenge,
connect polygons. For the August 2021 labeled data, our
                                                                       imaging results entered by the participants will be evalu-
team does not use snapping but instead leave small spaces
                                                                       ated using the following four metrics: Peak Signal-to-Noise
between polygons. Therefore, in the labeled dataset, unla-
                                                                       Ratio (PNSR), Structural Similarity Index Measure (SSIM)
beled areas are mostly forest, but may also contain some
                                                                       [10], Learned Perceptual Image Patch Similarity (LPIPS)
clouds or rivers. Shapefiles with labeled polygons are con-
                                                                       [12], and Fréchet Inception Distance (FID) [5].
verted into rasters with 0’s for forested/other and 1’s for de-
                                                                       Submission Format. For the test input, 2000 test
forested areas. Rasters are divided into georeferenced im-
                                                                       queries will be provided as a list of lists i.e.
age chips (256×256 pixels) that correspond with the multi-
                                                                       [[lon0 , lat0 , date0 , modality0 ], . . . , [lon1999 , lat1999 , date1999 ,
modal remote sensing dataset described in Section 2.1. We
                                                                       modality1999 ]]. Each test query is in the format [lon, lat,
show sample images of deforestation label maps at various
                                                                       date, modality]. For example, [−55.15, −4.11, 2021 12 04,
  2 https://earthengine.google.com/terms/                              Landsat8 SR B2] will represent Landsat8 SR B2 -55.15 -

                                                                   3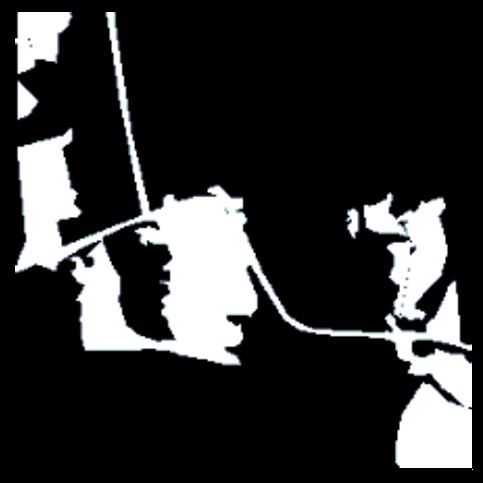
(a) Sentinel-1                      (b) Sentinel-2                       (c) Landsat 5                            (d) Landsat 8

Figure 2. Image examples from our multimodal dataset (LAT/LON: -4.11/-55.14) (a) Sentinel-1 VV on 12/30/2021, (b) Sentinel-2 RGB
(B4, B3, B2) on 8/4/2021, (c) Landsat 5 RGB (SR B3, SR B2, SR B1) on 6/12/1998, and (d) Landsat 8 RGB (SR B4, SR B3, SR B2) on
12/4/2021.

         (a) 08/2016                        (b) 07/2017                         (c) 06/2018                              (d) 08/2020

Figure 3. Example images of deforestation label maps corresponding to the location shown in Figure 2 (LAT/LON: -4.11/-55.14) at various
time slices: 08/2016, 07/2017, 06/2018, and 08/2020.

4.11 2021 12 04.tiff. For the test output, participants will          queries will be provided as a list of lists i.e.
submit in total 2,000 256×256 images, one 256×256                     [[lon0 , lat0 , date0 , modality0 ], . . . , [lon999 , lat999 , date999 ,
image for each input test query. Imagery related to the input         modality999 ]]. Each test query is in the format [lon, lat,
test queries will be made available in our website and can            date, modality]. For example, [−55.15, −4.11, 2021 08 01,
be used to help generate the requested output.                        deforestation] will represent deforestation -55.15 -
                                                                      4.11 2021 08.png. To have a consistent naming convention
3.2. Deforestation Estimation Sub-Challenge                           for the date (i.e. year month day), we add a nominal day
                                                                      label of “ 01” to all deforestation estimation test queries.
Problem Definition. Beyond predicting visual appearance,
                                                                      For the test output, participants will submit in total 1,000
this sub-challenge is aimed at estimating deforestation from
                                                                      256×256 binary masks, one 256×256 binary mask for each
the multimodal remote sensing dataset. As described in the
                                                                      input test query. Imagery related to the input test queries
Matrix Completion Sub-Challenge, the multimodal dataset
                                                                      will be made available in our website and can be used to
can be represented as a multidimensional data matrix with
                                                                      help generate the requested output.
missing entries. The goal of this sub-challenge is to perform
a binary classification to predict whether a region is defor-
ested or not. As solutions for the Matrix Completion Sub-             3.3. Image-to-Image Translation Sub-Challenge
Challenge can be naturally extended, we strongly encour-              Problem Definition. Obtaining a continuous time series
age participants in the Matrix Completion Sub-Challenge               of view of the Amazon rainforest is hindered by weather,
to submit to the Deforestation Estimation Sub-Challenge.              clouds, smoke, and other inherent limitations of passive sen-
Data. Participants will use the multimodal remote sensing             sors (e.g. optical sensors) that rely on sunlight. Such limita-
dataset described in Section 2.1 to predict binary deforesta-         tions produce a major information gap in the Amazon rain-
tion label maps in Section 2.2.                                       forest that gets rain throughout the entire year. Synthetic
Metrics. Performance is measured on the following stan-               aperture radar (SAR) is an active sensor that can collect im-
dard metrics: pixel accuracy, F1 score, and Intersection over         ages with relative invariance to weather and lighting condi-
Union (IoU).                                                          tions. However, visual interpretation of SAR images is not
Submission Format. For the test input, 1000 test                      intuitive due to the large dynamic range, low spatial corre-

                                                                  4
lation, and radar-specific geometry distortion. To enhance              It comprises three sub-challenges: 1) matrix completion,
SAR interpretability, this sub-challenge is aimed at mod-               2) deforestation estimation, and 3) image-to-image trans-
eling a distribution of possible electro-optical (EO) image             lation. This manuscript describes MultiEarth 2022’s chal-
outputs conditioned on a SAR input image. Here, EO image                lenge conditions, data, evaluation metrics, and submission
is a 3-channel RGB image from Sentinel-2. In Sentinel-2,                guideline. Only a few labeled, multimodal datasets includ-
RGB bands are represented as B4, B3, and B2, respectively.              ing passive and active sensors have been publicly available,
SAR image is a 2-channel Sentinel-1 image consisting of                 limiting the number of participants who can research and
VV and VH bands. In this Image-to-Image Translation Sub-                analyze Earth’s surface at all times and in all weather condi-
Challenge, participants need to model a distribution of po-             tions. We collect and disseminate a multimodal dataset that
tential results in a conditional generative modeling setting.           includes a continuous time series of Sentinel-1, Sentinel-2,
Data. For this sub-challenge, we provide JSON files speci-              Landsat 5 and Landsat 8, with deforestation labels.
fying which Sentinel-2 EO images (B4, B3, and B2) corre-
spond to which SAR images. We provide two JSON files:                   5. Acknowledgments
one for Sentinel-1 VV band3 and another for Sentinel-1VH                    The authors would like to thank Dr. M.K. Newey for helping the team
band 4 . The mappings in both files are identical. The aligned          labeling the August 2021 time slice data, and Scale AI, for its efforts to
dataset will have the following format: [x, [y1 , y2 , ..., yN ]]       label, in a short period of time, the remaining ten time slices considered in
                                                                        this MultiEarth2022.
where a SAR image x is paired to a set of ground truth                      Research was sponsored by the United States Air Force Research Lab-
EO images [y1 , y2 , ..., yN ]. For each SAR image, all EO              oratory and the United States Air Force Artificial Intelligence Accelerator
images of the same geographic region and which were col-                and was accomplished under Cooperative Agreement Number FA8750-19-
lected within 7 days of the SAR image timestamp will be                 2-1000. The views and conclusions contained in this document are those of
                                                                        the authors and should not be interpreted as representing the official poli-
identified. On average 3 EO images are paired with each                 cies, either expressed or implied, of the United States Air Force or the U.S.
SAR image (N ≈ 3).                                                      Government. The U.S. Government is authorized to reproduce and dis-
Metrics. Performance is evaluated based on following:                   tribute reprints for Government purposes notwithstanding any copyright
                                                                        notation herein.
                     X
                         min kf (x)i − yj k                  (1)
                     j
                          i                                             References
                                                                         [1] European Space Agency, 2015. Sentinels: Space for Copernicus.
where f (x)i is a set of possible EO images translated from a                http://esamultimedia.esa.int.
generative model f (·) conditioned on an input SAR image                 [2] Planet Team. https://api.planet.com.
x, and yj is an EO image from the corresponding ground                   [3] Scale AI. https://scale.com.
                                                                         [4] Maria Antonia Brovelli, Yaru Sun, and Vasil Yordanov. Monitoring
truth set. This metric also evaluates diversity of generated
                                                                             forest change in the amazon using multi-temporal remote sensing
output images staying faithful to the diversity of the ground-               data and machine learning classification on google earth engine. IS-
truth EO data.                                                               PRS International Journal of Geo-Information, 2020.
Submission Format. For testing, we will provide 5000                     [5] Martin Heusel, Hubert Ramsauer, Thomas Unterthiner, Bernhard
                                                                             Nessler, and Sepp Hochreiter. GANs Trained by a Two Time-Scale
Sentinel-1 SAR images, where each SAR image is                               Update Rule Converge to a Local Nash Equilibrium. NeurIPS, 2017.
256×256×2 and the 2 channels correspond to the Sentinel-                 [6] Crismeire Isbaex and Ana Margarida Coelho. The potential of
1 VV and VH bands, respectively. For the test output, par-                   sentinel-2 satellite images for land-cover/land-use and forest biomass
ticipants will submit in total 15,000 256×256×3 EO im-                       estimation: A review. In Forest Biomass. IntechOpen, Rijeka, 2021.
                                                                         [7] Michael D. King, Steven Platnick, W. Paul Menzel, Steven A. Ack-
ages, three translated 256×256×3 EO images for each in-                      erman, and Paul A. Hubanks. Spatial and temporal distribution of
put Sentinel-1 SAR image. The EO image channels corre-                       clouds observed by modis onboard the terra and aqua satellites. IEEE
spond to the Sentinel-2 RGB channels (B4, B3, B2). This                      Transactions on Geoscience and Remote Sensing, 2013.
is a multimodal image-to-image translation problem where                 [8] Thaı́s Almeida Lima, René Beuchle, Andreas Langner,
                                                                             Rosana Cristina Grecchi, Verena C. Griess, and Frédéric Achard.
participants will generate three possible EO images given                    Comparing sentinel-2 msi and landsat 8 oli imagery for monitoring
an input SAR image.                                                          selective logging in the brazilian amazon. Remote Sensing, 2019.
                                                                         [9] Fiona Ngadze, Kudzai Shaun Mpakairi, Blessing Kavhu, Henry
4. Conclusion                                                                Ndaimani, and Monalisa Shingirayi Maremba. Exploring the util-
                                                                             ity of sentinel-2 msi and landsat 8 oli in burned area mapping for a
   We introduce MultiEarth 2022 – the first open Mul-                        heterogenous savannah landscape. PLOS ONE, 2020.
                                                                        [10] Zhou Wang, Alan C. Bovik, Hamid R. Sheikh, and Eero P. Simon-
timodal Learning for Earth and Environment Challenge.                        celli. Image quality assessment: from error visibility to structural
  3 https://rainforestchallenge.blob.core.windows.                           similarity. IEEE Transactions on Image Processing, 2004.
net / dataset / sentinel _ vv _ image _ alignment _ train .             [11] World Resources Institute. 2017 Was the Second-Worst Year on
json                                                                         Record for Tropical Tree Cover Loss. https://www.wri.org.
  4 https://rainforestchallenge.blob.core.windows.                      [12] Richard Zhang, Phillip Isola, Alexei A. Efros, Eli Shechtman, and
net / dataset / sentinel _ vh _ image _ alignment _ train .                  Oliver Wang. The unreasonable effectiveness of deep features as a
json                                                                         perceptual metric, 2018.

                                                                    5
You can also read