Multi muscle deep learning segmentation to automate the quantification of muscle fat infiltration in cervical spine conditions - Nature
←
→
Page content transcription
If your browser does not render page correctly, please read the page content below
www.nature.com/scientificreports

                OPEN              Multi‑muscle deep learning
                                  segmentation to automate
                                  the quantification of muscle
                                  fat infiltration in cervical spine
                                  conditions
                                  Kenneth A. Weber II3*, Rebecca Abbott4, Vivie Bojilov3, Andrew C. Smith5,
                                  Marie Wasielewski4, Trevor J. Hastie6, Todd B. Parrish7, Sean Mackey3 & James M. Elliott1,2,4

                                  Muscle fat infiltration (MFI) has been widely reported across cervical spine disorders. The
                                  quantification of MFI requires time-consuming and rater-dependent manual segmentation techniques.
                                  A convolutional neural network (CNN) model was trained to segment seven cervical spine muscle
                                  groups (left and right muscles segmented separately, 14 muscles total) from Dixon MRI scans
                                  (n = 17, 17 scans < 2 weeks post motor vehicle collision (MVC), and 17 scans 12 months post MVC).
                                  The CNN MFI measures demonstrated high test reliability and accuracy in an independent testing
                                  dataset (n = 18, 9 scans < 2 weeks post MVC, and 9 scans 12 months post MVC). Using the CNN in 84
                                  participants with scans < 2 weeks post MVC (61 females, 23 males, age = 34.2 ± 10.7 years) differences
                                  in MFI between the muscle groups and relationships between MFI and sex, age, and body mass index
                                  (BMI) were explored. Averaging across all muscles, females had significantly higher MFI than males
                                  (p = 0.026). The deep cervical muscles demonstrated significantly greater MFI than the more superficial
                                  muscles (p < 0.001), and only MFI within the deep cervical muscles was moderately correlated to
                                  age (r > 0.300, p ≤ 0.001). CNN’s allow for the accurate and rapid, quantitative assessment of the
                                  composition of the architecturally complex muscles traversing the cervical spine. Acknowledging
                                  the wider reports of MFI in cervical spine disorders and the time required to manually segment the
                                  individual muscles, this CNN may have diagnostic, prognostic, and predictive value in disorders of the
                                  cervical spine.

                                  Abbreviations
                                  CNN	Convolutional neural network
                                  GT	Ground truth
                                  MVC	Motor vehicle collision
                                  MFI	Muscle fat infiltration
                                  MFSS	Multifidus and semispinalis cervicis
                                  LC	Longus colli and longus capitis
                                  SSCap	Semispinalis capitis
                                  SPCap	Splenius capitis
                                  LS	Levator scapula
                                  SCM	Sternocleidomastoid

                                  1
                                   Northern Sydney Local Health District, The Kolling Institute, St. Leonards, NSW, Australia. 2The Faculty of
                                  Medicine and Health, The University of Sydney, Camperdown, NSW, Australia. 3Division of Pain Medicine,
                                  Department of Anesthesiology, Perioperative and Pain Medicine, Stanford University School of Medicine, Palo
                                  Alto, CA, USA. 4Department of Physical Therapy and Human Movement Sciences, Feinberg School of Medicine,
                                  Northwestern University, Chicago, IL, USA. 5Physical Therapy Program, Department of Physical Medicine and
                                  Rehabilitation, School of Medicine, University of Colorado, Aurora, CO, USA. 6Statistics Department, Stanford
                                  University, Palo Alto, CA, USA. 7Department of Radiology, Northwestern University, Chicago, IL, USA. *email:
                                  kenweber@stanford.edu

Scientific Reports |   (2021) 11:16567               | https://doi.org/10.1038/s41598-021-95972-x                                            1

                                                                                                                                         Vol.:(0123456789)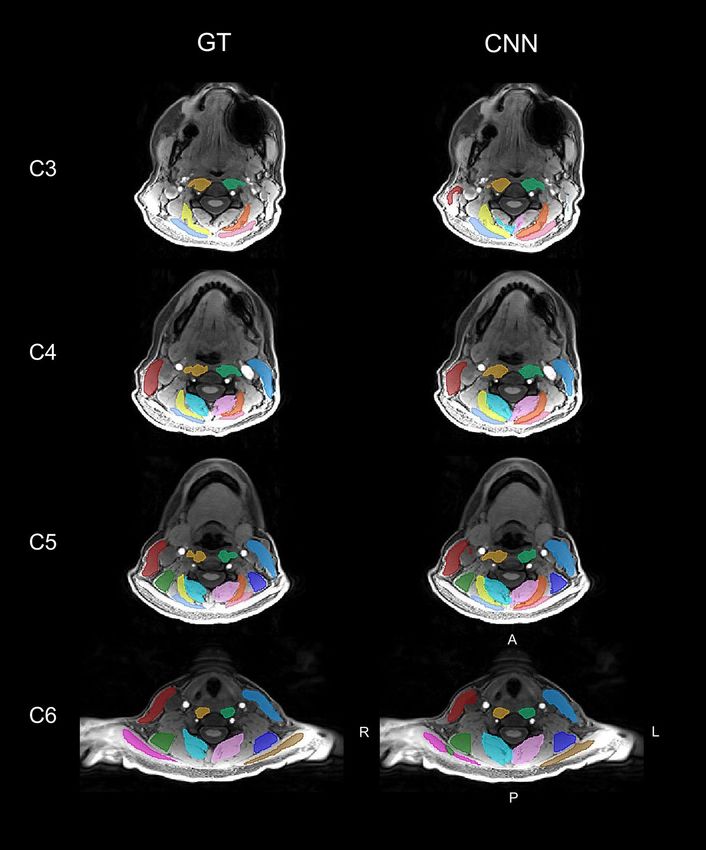
www.nature.com/scientificreports/
TR Trapezius
BMI Body mass index
Spinal conditions are a leading cause of pain and physical disability world-wide, afflicting an estimated one
billion people across the globe1–4. Conventional medical imaging (radiographs, computed tomography (CT),
and magnetic resonance imaging (MRI)) provides excellent visualization of the spinal anatomy and pathology.
However, spinal conditions often present with multi-level pathological c hanges5, and incidental findings are
frequently present even in asymptomatic individuals6, questioning the predictive value and clinical relevance
of conventional imaging for long-term outcomes7–10. The recent application of artificial intelligence methods
(e.g. convolutional neural networks (CNNs)) to image analysis is transforming medical imaging by providing
the power to efficiently and automatically extract many quantitative metrics from images not previously pos-
sible in the typical clinical w orkflow11. Using data-driven approaches, these complementary imaging metrics,
combined with examination and imaging findings, may lead to an improved understanding of spinal disease
and deliver more sensitive and specific measures of spinal pathology with greater diagnostic, prognostic, and
predictive value12,13. Artificial intelligence combined with precision medicine approaches can enable augmented
intelligence-driven medical decision making and the personalized delivery of health c are14.
One example is the infiltration of the spinal musculature with fat, muscle fat infiltration (MFI), which has
been consistently observed in patients with cervical spine conditions, including degenerative cervical myelopathy,
traumatic spinal cord injury, and whiplash from a motor vehicle collision (MVC)15–17. MFI appears to be uniquely
present in those with poor functional recovery, suggesting its presence may represent a modifiable target for
treatment. While the pathophysiological and pathomechanical mechanisms underlying these spinal conditions
differ, the characteristic pattern of MFI appears to occur with greatest magnitude in the deep muscular layers
of the cervical extensors (i.e., multifidus and semispinalis cervicis (MFSS)) and cervical flexors (i.e. longus colli
and longus capitis (LC))18–20. The ubiquitous nature of muscle compositional changes in these spinal conditions
suggests MFI may be one common biological explanation or risk factor for persisting neck-related disability. The
magnitude of MFI could have clinical implications for the management of the spine and recovery from persistent
spinal disorders. For example, new evidence suggests that higher pre-surgical MFI of the LC in degenerative
cervical myelopathy is associated with reduced post-surgical improvement in physical f unction21.
Using manual methods, MFI can be quantified from conventional ( T1- and T2-weighted) and advanced (Dixon
and proton density fat fraction) MRI and CT20,22,23. Manual segmentation of spinal muscles is not efficiently
performed in a clinical environment, thereby limiting its use to research environments. Recently, we trained
a deep-learning CNN model to perform segmentation of a single cervical spine muscle group (i.e., MFSS) in
participants with varying levels of whiplash-related pain and disability following a M VC24. We reported high
accuracy and reliability of the CNN MFI measures in an independent testing dataset and demonstrated higher
MFSS MFI in patients with persisting pain and neck-related disability at 3 months post MVC versus those par-
ticipants nominating full recovery. The CNN markedly improved the efficiency of the segmentation, reducing
the processing time from 20 min per image to only seconds. In addition to our work, CNN’s have been used to
automate the segmentation of the lumbar paraspinal and iliopsoas muscles from T 1-weighted and Dixon MRI
scans, respectively25,26. CNN’s have also been applied to other spinal structures, allowing for the automatic
quantification of vertebrae and intervertebral disc morphology from M RI27.
Other cervical spine muscle groups, in addition to the MFSS, have been implicated in cervical spine condi-
tions, and the assessment of multiple muscles is desired for a comprehensive evaluation of cervical spine muscle
composition16. The time required for manual segmentation scales with the number and architectural complexity
of the muscle groups being segmented, providing the motivation for developing accurate and reliable automated
multi-muscle segmentation methods to be used beyond the research environment with a target for clinical
implementation. Here, we trained and tested a CNN to segment seven cervical spine muscles groups (left and
right muscles segmented separately): MFSS, LC, semispinalis capitis (SSCap), splenius capitis (SPCap), leva-
tor scapula (LS), sternocleidomastoid (SCM), and trapezius (TR) using high-resolution Dixon fat-water MRI
(Table 1). We then explored relationships between the CNN-derived MFI measures and sex and age, known risk
factors for chronic whiplash symptoms, as well as body mass index (BMI) in participants with a whiplash injury
imaged within two weeks of a MVC. We hypothesized that higher levels of MFI would be associated with older
age, female sex, and higher BMI28–30.
Results
CNN accuracy and reliability. Training of the CNN segmentation model was completed in 100,000 itera-
tions (Supplementary Material Fig. 1), and the accuracy and reliability of the trained CNN model was evaluated
on the independent testing dataset (n = 18). Figures 1 and 2 compare the GT segmentations to the CNN segmen-
tations from a randomly selected testing scan. The CNN accuracy for the primary measure of MFI was high; for
all muscle groups, the absolute value of the mean bias in MFI was less than 2.0%, the MFI mean absolute error
(MAE) was less than 2.0%, and the MFI root mean squared error (RMSE) was less than 3.0% (Table 2 and Fig. 3).
Likewise, the reliability of the CNN MFI measures was excellent with the I CC2,1 exceeding 0.800 for all muscle
groups (Table 3 and Fig. 3)31. The accuracy and reliability of the secondary measure of muscle volume were gen-
erally lower than the MFI measurements (Table 2, 3, and Fig. 4). While the reliability of the MFSS, SSCap, LS,
SCM, and TR muscle volume was good ( ICC2,1 > 0.600), the reliability of the SPCap and LC volumes were fair
(ICC2,1 = 0.407–0.462) to poor (ICC2,1 = 0.207–0.395), respectively (Table 3 and Fig. 4). The mean Sørensen-Dice
index between the CNN and GT was > 0.65 for all muscle groups except the TR (Sørensen-Dice index < 0.50).
The volume ratios were greater than one for all muscles indicating that the CNN model generated segmentations
of a larger volume than the GT. See Table 4 for a summary of all segmentation metrics.
Scientific Reports | (2021) 11:16567 | https://doi.org/10.1038/s41598-021-95972-x 2
Vol:.(1234567890)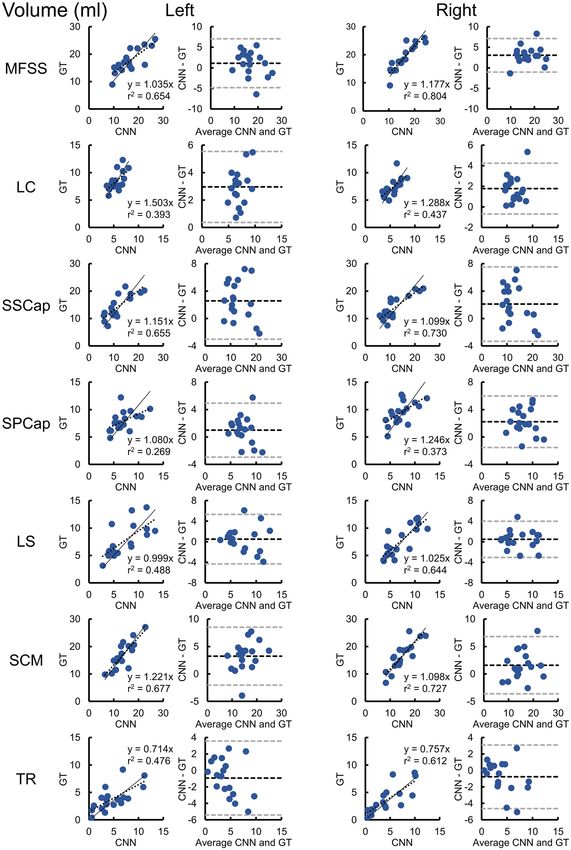
www.nature.com/scientificreports/

                                   Muscle                                 Abbreviation   Vertebral levels   Label (Left/Right)
                                   Multifidus and Semispinalis Cervicis   MFSS           C4–C6              2/1
                                   Longus Colli and Longus Capitis        LC             C3–C6              4/3
                                   Semispinalis Capitis                   SSCap          C3–C5              8/7
                                   Splenius Capitis                       SPCap          C3–C5              6/5
                                   Levator Scapula                        LS             C5–C6              14/13
                                   Sternocleidomastoid                    SCM            C4–C6              10/9
                                   Trapezius                              TR             C6                 12/11

                                  Table 1.  Muscle abbreviations.

                                  Figure 1.  Multi-muscle convolutional neural network (CNN) segmentation of seven cervical spine muscle
                                  groups. CNN segmentation masks for the ground truth (GT) and CNN from a randomly selected testing scan
                                  are shown overlaid the water-only image. Axial images at the C3–C6 vertebral levels were selected to show
                                  changes in muscle morphometry across the cervical spine. The muscle groups segmented included the MFSS
                                  (left = light pink, right = aqua), LC (left = light green, right = gold), SSCap (left = orange, right = yellow), SPCap
                                  (left = dark pink, right = light blue), LS (left = indigo, right = dark green), SCM (left = blue, right = red), and TR
                                  (left = brown, right = magenta). The artifact in the left jaw is due to metal from dental work. See Fig. 2 for three-
                                  dimensional renderings of the GT and CNN segmentations. L = left, R = right, A = anterior, P = posterior.

Scientific Reports |   (2021) 11:16567 |                   https://doi.org/10.1038/s41598-021-95972-x                                                      3

                                                                                                                                                  Vol.:(0123456789)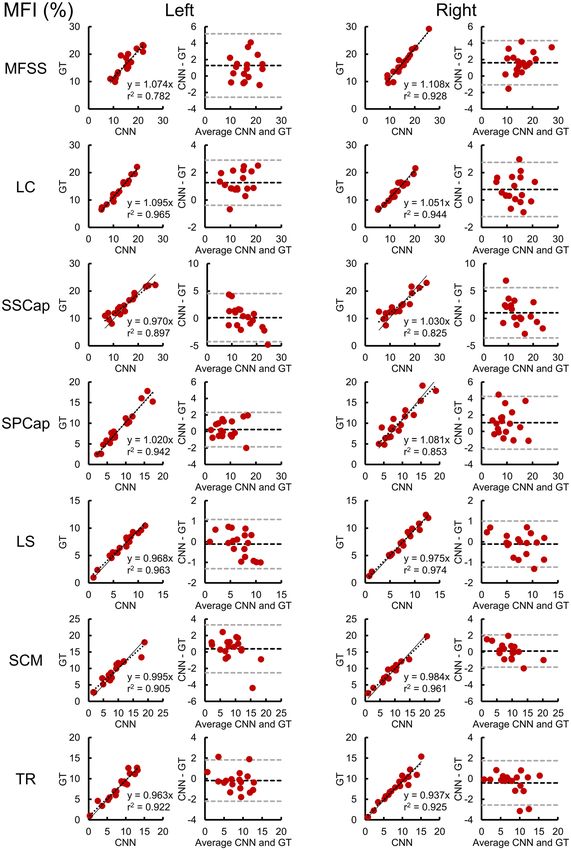
www.nature.com/scientificreports/
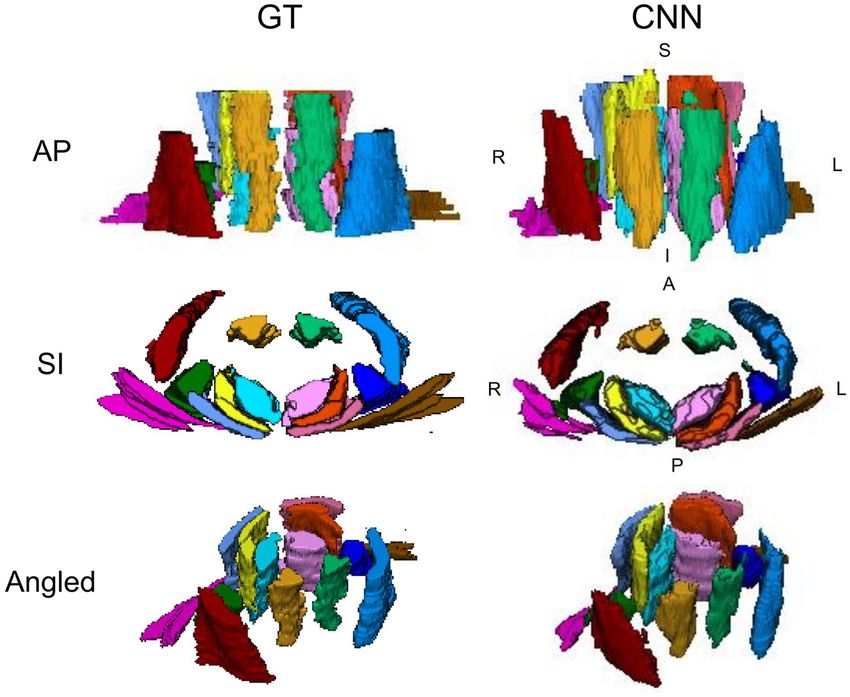
Figure 2. Three-dimensional renderings of the cervical spine muscle segmentations. The ground truth (GT)
and convolutional neural network (CNN) segmentations from a randomly selected testing scan are shown as
three-dimensional renderings. The muscle groups segmented included the MFSS (left = light pink, right = aqua),
LC (left = light green, right = gold), SSCap (left = orange, right = yellow), SPCap (left = dark pink, right = light
blue), LS (left = indigo, right = dark green), SCM (left = blue, right = red), and TR (left = brown, right = magenta).
See Fig. 1 for the two-dimensional segmentation masks of the GT and CNN overlaid the water-only image.
L = left, R = right, A = anterior, P = posterior, S = superior, I = inferior.
Interrater reliability. Another trained independent rater segmented a subset of the dataset (n = 10) to
assess the reliability of the manual segmentations between human raters. Interrater reliability for the MFI meas-
ures was excellent (ICC2,1 > 0.800) for most muscles except for the left SSCap, which demonstrated good inter-
rater reliability ( ICC2,1 = 0.742) (Supplementary Table 2). Similarly, the interrater reliability of the muscle volume
measures was excellent ( ICC2,1 > 0.800) for most muscle groups with only a few exceptions. The left and right
LC and right LS demonstrated good interrater reliability (ICC2,1 > 0.600). The left and right TR muscle, however,
demonstrated poor interrater reliability (ICC2,1 < 0.300) (Supplementary Table 2, Supplementary Figs. 2, 3).
MFI characterization. Next, we assessed MFI between the muscle groups and the relationship of MFI to
sex, age, and BMI in participants within two weeks of experiencing a whiplash injury from a MVC (See Sup-
plementary Table 3 for sample characteristics). A repeated measures ANCOVA controlling for BMI and age
demonstrated a significant within subject effect of the muscle group on MFI (F(4.5,361.8) = 2.791, p = 0.021) and a
between-subject effect of sex on MFI (F(1,80) = 5.160, p = 0.026). MFI between each muscle group was positively
correlated (Supplementary Fig. 4). Paired t-tests demonstrated significant differences in MFI between each mus-
cle group with the deep cervical muscles (MFSS, LC, and SSCap) having greater MFI than the more superficial
muscles (Fig. 5A). When averaging across all muscle groups, female participants had significantly higher MFI
than male participants (1.8% ± 0.8% higher MFI in females, p = 0.026). Sex differences within each muscle groups
were assessed with a one-way ANCOVA controlling for age and BMI. Females had significantly higher MFI than
males in the SSCap, SPCap, and TR (Supplementary Table 3 and Fig. 5B). Two-tailed partial correlations control-
ling for sex and BMI demonstrated that age and MFI were moderately correlated (r > 0.300) in the deep cervical
muscles (MFSS, LC, SSCap), while age and MFI were only weakly correlated (r < 0.300) in the more superficial
muscles. Finally, BMI was only weakly correlated (r < 0.300) with MFI across the muscle groups after controlling
for sex and age (Fig. 6).
Discussion
We trained and tested a CNN model for segmentation of seven cervical spine muscle groups (left and right
muscles segmented separately) using high-resolution fat-water Dixon MRI in participants within 2 weeks of
a MVC-related whiplash injury. We demonstrate the feasibility of developing a CNN model for a complex,
Scientific Reports | (2021) 11:16567 | https://doi.org/10.1038/s41598-021-95972-x 4
Vol:.(1234567890)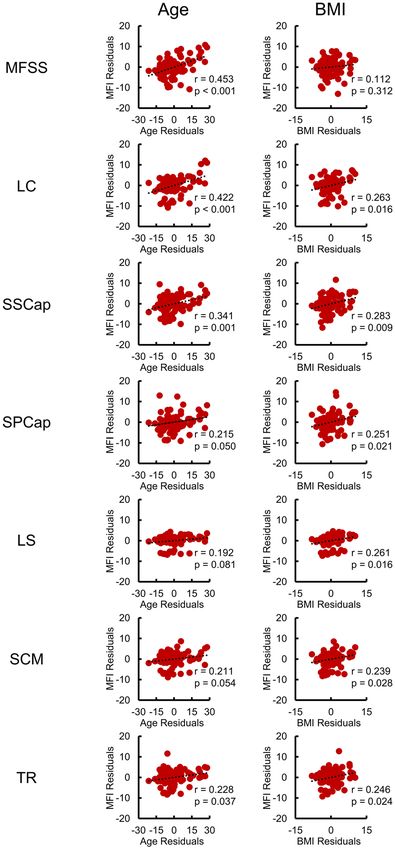
www.nature.com/scientificreports/
MFI (%) Volume (ml)
Muscle Mean Bias 95% LA MAE RMSE r2 Mean Bias 95% LA MAE RMSE r2
MFSS
Left 16.8 ± 1.0 1.3 −2.6–5.1 1.7 2.3 0.782 17.5 ± 1.0 1.1 −4.8–7.1 2.7 3.2 0.654
Right 16.4 ± 1.2 1.6 −1.1–4.3 1.8 2.1 0.928 18.8 ± 1.1 3.0 −1.0–7.1 3.2 3.7 0.804
LC
Left 13.7 ± 1.0 1.3 −0.4–2.9 1.3 1.5 0.965 8.4 ± 0.4 3.0 0.4–5.5 3..0 3.2 0.393
Right 13.3 ± 1.0 0.8 −1.2–2.7 1.0 1.2 0.944 7.3 ± 0.4 1.8 −0.7–4.3 1.8 2.2 0.437
SSCap
Left 14.9 ± 1.0 0.1 −4.2–4.5 1.7 2.2 0.897 14.2 ± 1.0 2.6 −3.0–8.2 3.1 3.8 0.655
Right 14.5 ± 1.0 1.0 −3.6–5.6 1.9 2.5 0.825 13.9 ± 1.0 2.1 −3.3–7.5 2.8 3.4 0.730
SPCap
Left 8.8 ± 1.0 0.2 −1.8–2.3 0.9 1.1 0.942 7.9 ± 0.4 1.0 −2.9–4.9 1.8 2.2 0.269
Right 10.1 ± 1.0 1.1 −2.1–4.3 1.5 1.9 0.853 9.5 ± 0.5 2.2 −1.5–6.0 2.4 2.9 0.373
LS
Left 6.7 ± 0.6 −0.1 −1.3–1.1 0.5 0.6 0.963 7.6 ± 0.7 0.5 −4.3–5.3 1.9 2.4 0.488
Right 7.4 ± 0.7 −0.1 −1.2–1.0 0.4 0.6 0.974 7.6 ± 0.7 0.5 −3.1–4.0 1.4 1.8 0.644
SCM
Left 9.0 ± 0.9 0.4 −2.5–3.3 1.1 1.5 0.905 16.9 ± 1.1 3.2 −2.0–8.5 3.7 4.2 0.677
Right 9.2 ± 0.9 0.1 −1.8–2.1 0.8 1.0 0.961 16.3 ± 1.2 1.6 −3.6–6.8 2.3 3.0 0.727
TR
Left 8.0 ± 0.8 −0.2 −2.2–1.8 0.8 1.0 0.922 3.9 ± 0.5 −0.9 −5.4–3.6 2.0 2.4 0.476
Right 7.8 ± 0.8 −0.4 −2.6–1.7 0.7 1.1 0.925 3.7 ± 0.6 −0.8 −4.6–3.1 1.6 2.1 0.612
Table 2. CNN MFI and volume accuracy. Bland-Altman plots and Pearson correlations were used to assess
the accuracy of the convolutional neural network (CNN) model compared to the ground truth (GT) for muscle
fat infiltration (MFI) and muscle volume measures on the testing dataset (n = 18) (Fig. 3, 4). Mean = mean
CNN measure ± 1 standard error. Bias = mean difference between CNN and GT. LA = limits of agreement.
MAE = mean absolute error. RMSE = root mean squared error.
multi-muscle segmentation task: 14 muscles total. The trained CNN model was highly efficient – segmenting an
image, and all muscles within that image, in less than 30 s compared to 4 to 8 h with manual segmentation. Across
all muscle groups, we report high accuracy (mean bias < 2.0%) and high reliability (ICC2,1 > 0.800) for the CNN
MFI measures compared to manual segmentation. Using the CNN measures, we identified higher MFI in females
than males, and we also identified significant positive correlations between age (controlling for sex and BMI)
and MFI, which was most pronounced (r > 0.300) for the deep cervical muscles: MFSS, LC, and SSCap. Overall,
the CNN model permits the automatic extraction of accurate and reliable measures of muscle composition. The
use of these measures as secondary markers in clinical trials, may lead to an improved understanding of spinal
disease, delivering more sensitive and specific measures of spinal pathology, where the slow progression, often
masked by age-related changes, pose a major roadblock to measuring therapeutic success. Such work could also
advance the management of spinal conditions by encouraging efficiencies and innovation in clinical assessment
and therapy development because the measures may detect change earlier than clinical endpoints (more sensitive)
and are independent of assessor variability (more objective). Furthermore, these measures may aid in augmented
intelligence-driven clinical decision making, allowing the clinician to better risk- and treatment-stratify patients
using this information along with other clinical markers and e ndpoints14.
In the cervical spine, MFI has been reported to be present in greater magnitude in the deeper muscles
surrounding the vertebrae, compared to the more superficial m uscles18,20. We also found this to be true for
our CNN MFI measurements supporting these previous findings. Prior research as well as our current study
highlight the difficulty in determining whether elevated MFI is due to a pathological process or more part of
normal aging, as age and MFI have been demonstrated to be a ssociated29,32–34. For this study, the imaging data
were from a parent study of individuals with neck pain due to a whiplash injury from a MVC, and thus aging as
well as musculoskeletal trauma may have contributed to the MFI expressions in our cohort. We demonstrated
higher MFI in females than males, which is consistent with previous findings in the lumbar spine musculature
in asymptomatic33 and s ymptomatic30 participants. The effect of sex was present even when controlling for age
and BMI. BMI, however, is only a rough estimate of body composition, and more accurate measures of body
fat percentage (e.g., skinfold testing or bioimpedance) and physical function could help better understand the
relationship between sex and M FI35. Sex and age are potential confounds when studying MFI. The inclusion of a
sufficient number of male and female participants without whiplash symptoms following a MVC or an uninjured
pain-free cohort is necessary to determine the nature of MFI expression and whether the magnitude is influenced
by disorder severity, age, or sex.
While the accuracy and reliability of the CNN MFI measures were high for all muscle groups, the accuracy
and reliability of the muscle volumes were generally lower, especially for the SPCap and LC, which had fair to
Scientific Reports | (2021) 11:16567 | https://doi.org/10.1038/s41598-021-95972-x 5
Vol.:(0123456789)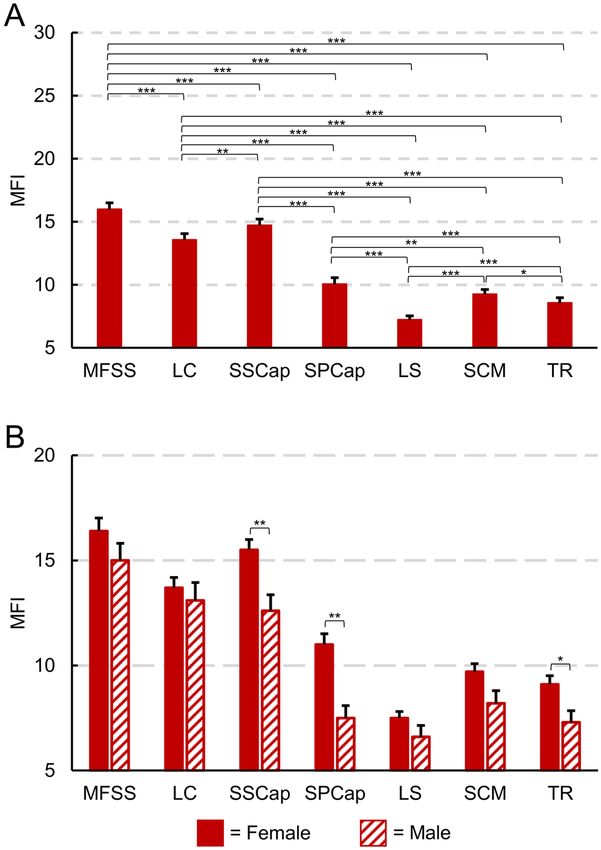
www.nature.com/scientificreports/
Figure 3. Reliability and accuracy of the convolutional neural network (CNN) muscle fat infiltration (MFI)
measures on the testing dataset (n = 18). Correlation and Bland-Altman plots are shown for MFI for each of the
muscle groups. In the correlation plots, the dashed black line represents the best fit line, and the linear regression
coefficient (β) of the ground truth (GT) on CNN (intercept = 0) is also provided (solid black line), which can be
used to correct the CNN measurement bias. In the Bland-Altman plots, the dashed black and gray lines indicate
the mean difference (i.e., bias) ± 1.96 × standard deviation (i.e., 95% limits of agreement). See Table 3 for the
intraclass correlation coefficients (ICC2,1).
Scientific Reports | (2021) 11:16567 | https://doi.org/10.1038/s41598-021-95972-x 6
Vol:.(1234567890)www.nature.com/scientificreports/
MFI (%) Volume (ml)
Muscle ICC2,1 95% CI p ICC2,1 95% CI p
MFSS
Left 0.847 0.541–0.946 < 0.001 0.781 0.510–0.911 < 0.001
Right 0.902 0.280–0.974 < 0.001 0.733 −0.056–0.927 < 0.001
LC
Left 0.941 0.214–0.987 < 0.001 0.207 −0.074–0.583 0.003
Right 0.957 0.804–0.987 < 0.001 0.395 −0.112–0.751 0.001
SSCap
Left 0.910 0.777–0.966 < 0.001 0.699 0.129–0.895 < 0.001
Right 0.870 0.675–0.950 < 0.001 0.765 0.313–0.917 < 0.001
SPCap
Left 0.971 0.925–0.989 < 0.001 0.462 0.044–0.752 0.014
Right 0.898 0.668–0.965 < 0.001 0.407 −0.099–0.747 0.003
LS
Left 0.975 0.934–0.990 < 0.001 0.699 0.363–0.875 < 0.001
Right 0.985 0.960–0.994 < 0.001 0.800 0.550–0.919 < 0.001
SCM
Left 0.937 0.844–0.976 < 0.001 0.635 −0.047–0.881 < 0.001
Right 0.972 0.927–0.989 < 0.001 0.806 0.489–0.928 < 0.001
TR
Left 0.958 0.893–0.984 < 0.001 0.629 0.258–0.841 0.001
Right 0.954 0.882–0.983 < 0.001 0.742 0.438–0.894 < 0.001
Table 3. CNN MFI and volume reliability. Intraclass correlation coefficients ( ICC2,1, two-way random,
absolute agreement, single measure) were used to assess the reliability of the convolutional neural network
(CNN) model compared to the ground truth (GT) for the muscle fat infiltration (MFI) and muscle volume
measures on the testing dataset (n = 18). CI = confidence interval. p = F-test with true value of 0.
poor reliability, respectively. The lower reliability of the muscle volumes was not unexpected, and several impor-
tant limitations regarding the volume measurements should be noted. First, we chose not to segment the full
length of each muscle group, and instead, limited the segmentations to the axial slices that cross the vertebral
levels listed in Table 1 for each muscle group. This was to standardize the segmentation process because some
muscles become difficult to differentiate close to their attachments and some muscles originated from outside the
field of view (e.g. trapezius). Second, the axial slices do not cross most muscles perpendicularly, meaning that the
area on an axial slice may not represent a true cross-sectional area of the muscle at that level. This is a common
limitation for imaging studies that report cross-sectional area and is a good argument for reporting full volume
instead, if possible23. While the CNN model only trained on the segmentations restricted to the pre-determined
vertebral levels, the CNN model output was not restricted to these vertebral levels, and additional slices not
included in the GT segmentations appear to have been included in the segmentations output by the CNN model.
This is demonstrated by the volume ratio being greater than one for all muscle groups and a positive mean bias
for muscle volume for all muscles except the TR, indicating that the CNN muscle segmentations produced a
systematically greater volume than the GT. Despite the low CNN reliability for the volume measures, the mean
bias in the muscle segmentations was less than 5 ml for all muscle groups, which is relatively low.
Despite advancements in MRI technology (e.g., improved image resolution and contrast), manual segmenta-
tion of the cervical spine muscles requires a high-level of knowledge in cervical spine anatomy and a substantial
amount of time (i.e., 4 to 8 h per scan in this study). Due to the high-level of expertise and time requirements,
we only trained and tested the CNN model using segmentations from one rater, which were then reviewed by an
additional independent rater. This raises concern that the CNN model may be biased to a single rater’s interpreta-
tion of the anatomy. To mitigate this concern, in a subset of the dataset, we assessed the interrater reliability of
manual segmentation with a third human rater, and we demonstrated excellent to good reliability for the MFI
and volume measures of all muscles groups besides the TR muscle volume measures, which had poor reliability.
Factors contributing to differences in segmentations between raters include the complex three-dimensional
muscle and bone architecture as well as challenges in visualizing borders between adjacent muscle groups. The
complexity of the TR muscular architecture likely led to the poor interrater reliability values for the TR muscle
volume. The upper TR muscle fibers are primarily vertical near its cranial attachment, but fan out at the lower
vertical levels, becoming almost parallel to the axial slices. Despite receiving similar instruction and training, the
two raters may have used slightly different techniques to segment this muscle23. Caution should be used when
interpreting the TR muscle measures as the segmentations likely do not generalize to all raters or participants.
The challenge of differentiating between adjacent muscles drove our previous decision to combine the multi-
fidus and semispinalis cervicis (MFSS)23. The MFSS are both deep extensor muscles with similar actions. These
muscle groups have many vertebral attachments and multiple layered fiber bundles that make boundaries chal-
lenging to differentiate. Similar reasoning was used for the grouping the longus colli and longus capitis (LC). In
Scientific Reports | (2021) 11:16567 | https://doi.org/10.1038/s41598-021-95972-x 7
Vol.:(0123456789)www.nature.com/scientificreports/
Figure 4. Reliability and accuracy of the convolutional neural network (CNN) muscle volumes on the testing
dataset (n = 18). Correlation and Bland-Altman plots are shown for volume for each of the muscle groups. In
the correlation plots, the dashed black line represents the best fit line, and the linear regression coefficient (β) of
the ground truth (GT) on CNN (intercept = 0) is also provided (solid black line), which can be used to correct
the CNN measurement bias. In the Bland-Altman plots, the dashed black and gray lines indicate the mean
difference (i.e., bias) ± 1.96 × standard deviation (i.e., 95% limits of agreement). See Table 3 for the intraclass
correlation coefficients (ICC2,1).
Scientific Reports | (2021) 11:16567 | https://doi.org/10.1038/s41598-021-95972-x 8
Vol:.(1234567890)www.nature.com/scientificreports/
Muscle Dice JI CC TPR TNR PPV VR
MFSS
Left 0.79 ± 0.01 0.65 ± 0.01 0.45 ± 0.04 0.83 ± 0.02 1.00 ± 0.00 0.76 ± 0.02 1.10 ± 0.05
Right 0.78 ± 0.01 0.64 ± 0.01 0.44 ± 0.02 0.86 ± 0.01 1.00 ± 0.00 0.72 ± 0.01 1.21 ± 0.04
LC
Left 0.70 ± 0.01 0.54 ± 0.02 0.11 ± 0.05 0.89 ± 0.02 1.00 ± 0.00 0.58 ± 0.02 1.58 ± 0.07
Right 0.71 ± 0.01 0.56 ± 0.01 0.18 ± 0.05 0.84 ± 0.02 1.00 ± 0.00 0.63 ± 0.02 1.36 ± 0.06
SSCap
Left 0.73 ± 0.01 0.58 ± 0.02 0.24 ± 0.05 0.83 ± 0.02 1.00 ± 0.00 0.66 ± 0.02 1.29 ± 0.07
Right 0.74 ± 0.01 0.59 ± 0.02 0.28 ± 0.05 0.83 ± 0.02 1.00 ± 0.00 0.68 ± 0.03 1.26 ± 0.07
SPCap
Left 0.68 ± 0.02 0.52 ± 0.02 0.02 ± 0.08 0.75 ± 0.03 1.00 ± 0.00 0.64 ± 0.02 1.20 ± 0.07
Right 0.67 ± 0.01 0.51 ± 0.01 0.01 ± 0.05 0.79 ± 0.02 1.00 ± 0.00 0.60 ± 0.02 1.37 ± 0.08
LS
Left 0.76 ± 0.01 0.62 ± 0.02 0.36 ± 0.04 0.86 ± 0.02 1.00 ± 0.00 0.69 ± 0.02 1.26 ± 0.05
Right 0.76 ± 0.01 0.62 ± 0.02 0.36 ± 0.04 0.80 ± 0.02 1.00 ± 0.00 0.73 ± 0.02 1.11 ± 0.05
SCM
Left 0.73 ± 0.02 0.58 ± 0.02 0.20 ± 0.11 0.77 ± 0.03 1.00 ± 0.00 0.71 ± 0.03 1.15 ± 0.09
Right 0.74 ± 0.02 0.59 ± 0.02 0.26 ± 0.08 0.78 ± 0.03 1.00 ± 0.00 0.72 ± 0.03 1.12 ± 0.07
TR
Left 0.41 ± 0.04 0.27 ± 0.03 −2.01 ± 0.40 0.49 ± 0.06 0.94 ± 0.06 0.46 ± 0.03 1.09 ± 0.17
Right 0.45 ± 0.04 0.30 ± 0.03 −2.40 ± 0.83 0.46 ± 0.05 1.00 ± 0.00 0.50 ± 0.05 1.07 ± 0.18
Table 4. CNN segmentation performance metrics. The convolutional neural network (CNN)
segmentation performance was further assessed on the testing dataset (n = 18) using the Sørensen-Dice index
(Dice), Jaccard index (JI), conformity coefficient (CC), true positive rate (TPR), true negative rate (TNR),
positive predictive value (PPV), and volume ratio (VR). Metrics shown = mean ± 1 standard error.
comparison to our previous CNN model for the MFSS, which used two-dimensional convolutional layers, here
three-dimensional convolutional layers were employed. The choice of the three-dimensional model was due to
the increased complexity of the muscle architecture, particularly of the superficial muscles, where the shape and
spatial relationship of the muscles varies substantially along the superior-inferior axis. The three-dimensional
model includes this additional spatial information, possibly allowing the model to better learn the complex
three-dimensional architecture of the muscles, leading to improved performance.
In our previous CNN model, we trained the model using just the water-only images and limited the measure
to the MFSS24. Here, we chose to train on the in-phase and out-of-phase images for two reasons. First, using
the corresponding pairs of images generated from the Dixon sequence (e.g., fat-only and water-only images or
in-phase and out-of-phase images), provides complementary information, which may have helped better define
the muscle b oundaries36. Second, the in-phase and out-of-phase images were used over the water-only and fat-
only images due to the presence of the fat-water swapping artifact, which appears frequently in Dixon imaging
(≈10% of the fat-water imaging scans)37,38. The fat-water swapping artifact results from misclassification of the fat
and water signal in areas of magnetic field inhomogeneities, resulting in regions where fat-only and water-only
images contain water-only and fat-only voxels, respectively. This artifact is not present in the in-phase and out-
of-phase magnitude images. The use of both image contrasts does increase the number of features leading to a
larger network size, higher model complexity, and increased computational costs. While we did not test whether
the use of both the in-phase and out-of-phase images improves the segmentation performance, it is plausible
as the images contain unique tissue contrast. Outputting the in-phase and out-of-phase images is an option
on most scanners but may not be the default setting. With three-dimensional models, especially multi-modal
models, memory does become an issue, limiting the batch size for training to only three datasets in this study.
We are currently exploring the trade-off between the spatial window size and model performance to reduce the
memory demands without sacrificing accuracy.
Here we employed the dense V-Net, a fully CNN model, to perform multi-muscle segmentation. We chose
the dense V-Net because this model demonstrated state-of-the-art performance in a multi-organ segmentation
task using abdominal CT images39. U-Net is another commonly used fully CNN segmentation model with both
two-dimensional and three-dimensional architectures and structural similarities to V-Net40,41. U-Net has demon-
strated high performance for lung segmentation from radiographs and bone segmentation from MRI in addition
to many other tasks42,43. In this study, we did not compare different CNN architectures, but the results of a recent
segmentation challenge showed similar performance between three-dimensional V-Net and three-dimensional
U-Net models for a knee cartilage MRI segmentation task44. The application of CNN’s and deep learning into
medical imaging analysis has been a major advancement in the field, leading to significant gains in segmenta-
tion performance across multiple medical imaging applications (for a comprehensive review see Hesamian et al.
(2019))45. New architectures are continuing to be developed, leading to further improvements in segmentation
performance over the V-Net and U-Net architectures46. Examples include recurrent neural networks, such as long
Scientific Reports | (2021) 11:16567 | https://doi.org/10.1038/s41598-021-95972-x 9
Vol.:(0123456789)www.nature.com/scientificreports/
Figure 5. Muscle fat infiltration (MFI) of each muscle was calculated from the convolutional neural network
(CNN) segmentations in 84 participants from the first time point (< 2 weeks following a motor vehicle collision,
61 females, 23 males, age = 34.2 ± 10.7 years). The left and right MFI measures for each muscle group were
averaged for these analyses. (A) Between muscle group comparison of MFI. Each muscle group had significantly
different MFI (paired t-tests) with the deep cervical extensors and flexors having higher MFI than the more
superficial layers. (B) MFI by sex for each muscle group. When averaging across all muscle groups, female
participants had significantly greater MFI than male participants (1.8% ± 0.8% higher MFI in females, p = 0.026).
Females had significantly higher MFI than males in the SSCap, SPCap, and TR (one-way ANCOVA controlling
for age and BMI). Estimated marginal means are shown. See Table 2 and Supplementary Table 3 for additional
information. Error bars = 1 standard error. *p < 0.05, **p < 0.01, ***p < 0.001.
short-term memory networks, and ensembles of neural networks47,48. Adopting these more advanced networks
would likely improve the accuracy and reliability of the cervical spine muscle segmentations reported in this
study as well as the resulting MFI measures.
We present these findings from the perspective of cervical spine conditions; however, we are actively working
to expand this technology to the entire musculoskeletal system. A major barrier in developing the CNN models
is the availability of large, diverse annotated datasets for training. The use of images from the same site, sequence,
and imaging parameters likely reduces the generalizability of the trained CNN model and is a recognized limita-
tion in this study. We are currently building a global coalition of musculoskeletal clinicians and researchers to
pool clinical- and research-based imaging datasets to develop a large multi-site and multi-cultural annotated
musculoskeletal imaging database for research purposes. Using this database, we aim to develop models that
generalize to images of varying resolution, field-of-view, orientation, and image contrast (multi-modality and
multi-scale) to establish normative reference values to inform clinical care on a patient-by-patient b asis49,50.
Fortunately, many past examples of open imaging databases for organizing and sharing imaging datasets exist
to guide this process (e.g., OpenNeuro)51. Efficiently generating the annotated datasets with sufficient accuracy
remains the greatest hurdle. We are currently exploring ways to employ crowd sourcing strategies and gamify the
segmentation task, with the goal of developing a web-based educational platform targeted to health professional
trainees to learn musculoskeletal anatomy interactively.
Based on our findings, we now have the technology to automate the segmentation of multiple muscles of the
cervical spine, permitting the quantitative comprehensive assessment of cervical spine muscle composition. Our
success in the cervical spine, with its architecturally complex anatomy, suggests that effectively extending these
methods to other body regions is possible, and we have efforts underway in the lumbar spine, foot, leg, hip, and
shoulder using both CT and MRI. The integration of the CNN models into the conventional clinical workflow
Scientific Reports | (2021) 11:16567 | https://doi.org/10.1038/s41598-021-95972-x 10
Vol:.(1234567890)www.nature.com/scientificreports/
Figure 6. Relationship between muscle fat infiltration (MFI), age, and body mass index (BMI) across the
muscle groups. Partial correlations (Pearson’s r) were performed to identify linear relationships between MFI
and age or MFI and BMI in 84 participants from the first time point (< 2 weeks following a motor vehicle
collision, 61 females, 23 males, age = 34.2 ± 10.7 years) after controlling for sex and BMI or sex and age,
respectively. The left and right MFI measures for each muscle group were averaged for this analysis. For MFI and
age, the residuals of MFI are plotted on the residuals of age after controlling for sex and BMI. For MFI and BMI,
the residuals of MFI are plotted on the residuals of BMI after controlling for sex and age. Moderate correlations
(r > 0.300) were only present between MFI and age for the deep cervical muscles (MFSS, LC, and SSCap).
as a postprocessing step should be straightforward, and in the not-too-distant future, these methods could
provide clinicians with quantitative metrics of muscle characteristics extracted from the images obtained in a
conventional musculoskeletal imaging series. Finally, these muscle measures would complement the examina-
tion and standard imaging findings and may provide increased diagnostic, prognostic, and predictive informa-
tion to better inform the assessment and management of a wide variety of musculoskeletal and neuromuscular
Scientific Reports | (2021) 11:16567 | https://doi.org/10.1038/s41598-021-95972-x 11
Vol.:(0123456789)www.nature.com/scientificreports/
conditions. Relating these findings to clinical examinations across a patient population with varying levels of
pain and disability is required before definitive conclusions can be made. This is well underway.
Methods
Participants. MRI datasets from 84 participants (61 females, 23 males, age = 34.2 ± 10.7 years) were obtained
from a prospective observational longitudinal study exploring recovery from whiplash (ClinicalTrials.gov Iden-
tifier: NCT02157038). Datasets from the first (< 2 weeks post MVC) and fourth (12 months post MVC) study
time points were used in the present study. Inclusion criteria included age 18 to 65 years, Quebec Task Force
whiplash grades of II to III, and < 1 week post MVC with a primary complaint of neck pain. Exclusion criteria
included a history of a previous MVC, spinal fracture, previous spinal surgery, previous diagnosis of cervical
or lumbar radiculopathy, history of neurological or metabolic disorders, and contraindications to MRI. The
study was approved by Northwestern University’s Institutional Review Board. All applicable institutional and
governmental regulations concerning the ethical use of human volunteers were followed during the course of
this research according to the Declaration of Helsinki, and written informed consent was obtained from every
participant. Prior to working with the datasets, identifying personal information was removed.
Image acquisition. A 3.0 T Siemens (Munich, Germany) Prisma scanner equipped with a 64-chan-
nel head/neck coil was used to acquire high-resolution three-dimensional fat-water images of the cervical
and upper thoracic spine with a dual-echo gradient-echo FLASH sequence (2-point Dixon, TR = 7.05 ms,
TE1 = 2.46 ms, TE2 = 3.69 ms, flip angle = 12°, bandwidth = 510 Hz/pixel, field-of-view = 190 mm × 320 mm, slab
oversampling of 20% with 40 partitions to prevent aliasing in the anterior-posterior direction, in-plane resolu-
tion = 0.7 mm × 0.7 mm, slice thickness = 3.0 mm, number of averages = 6, acquisition time = 4 min 5 s)52. Fat
and water have different chemical structures and precessional frequencies that differentially influence the local
magnetic field. Images can be acquired when the fat and water signals are in-phase (IP = W + F) and out-of-phase
(OOP = W – F). The in-phase and out-of-phase images can be combined to create images with fat-only signal
(F = (IP – OOP) / 2) and water-only signal (W = (IP + OOP) / 2). As the images are acquired simultaneously in
the same sequence and space, the images require no coregistration.
Muscle segmentation. The muscle groups of interest included the left and right multifidus and semispi-
nalis cervicis (MFSS), longus colli and longus capitis (LC), semispinalis capitis (SSCap), splenius capitis (SPCap),
levator scapula (LS), sternocleidomastoid (SCM), and trapezius (TR). Each muscle was segmented manually
by tracing their muscle borders on consecutive axial slices using methods previously described23. The muscle
groups were segmented with separate labels for the left and right muscles at predetermined cervical levels where
each muscle group is consistently present and can be accurately segmented. A mid-sagittal slice was used to
identify the axial slices corresponding to each vertebral level (Table 1). The segmentation masks contained the
background (label = 0) and each muscle labeled with an integer value (labels = 1–14). A single rater (VB) blinded
to any demographic or clinical information segmented the 14 muscles of interest from 52 cervical spine Dixon
scans. The segmentations were then reviewed by an additional independent, blinded rater (KW). Time required
to segment a single Dixon scan ranged from 4 to 8 h. These segmentations were used as the ground truth (GT)
for training and testing the CNN model. To assess interrater reliability, a third independent rater (RA), seg-
mented a randomly selected subset of the Dixon scans (n = 10). All raters were doctoral level health professionals
(physical therapy (RA) and chiropractic (VB and KW)) with extensive training in cervical spine anatomy and
musculoskeletal imaging. The raters were permitted to use the fat, water, in-phase, and out-of-phase images to
guide the segmentations.
Data augmentation. Data augmentation was used to increase the variability in the training dataset. First,
the images were split into training and testing datasets. The training dataset consisted of images from 17 par-
ticipants (14 females, 3 males, age = 33.7 ± 11.4 years) with 17 scans from the first study time point and 17 scans
from the fourth study time point (34 training scans total). The testing dataset consisted of images from 18
participants (11 females, 7 males, age = 31.7 ± 9.6 years) with 9 scans from the first time point and 9 scans from
the fourth time point (18 testing scans total). Participants in the testing dataset were independent from the par-
ticipants in the training dataset. From the training dataset, 2,000 augmented images were generated by applying
a series of random mirroring (left-right flip), elastic deformation (number of control points = 3, sigma = 10), ani-
sotropic spatial scaling (percentage = ± 2.5), and rotation (left-right axis rotation = ± 2.5°, anterior-posterior axis
rotation = ± 2.5°, superior-inferior axis rotation = ± 5.0°). The non-augmented (i.e., raw) training images (n = 34)
were used to assess the model performance across the training iterations using the Sørensen-Dice index (i.e.,
validation dataset). Data augmentation and training and testing the CNN model were performed using NiftyNet
(Version 0.6.0), an open-source deep-learning platform built on TensorFlow (Version 1.15) in Python (Version
3.6) and designed specifically for medical imaging analysis53.
Dense V‑Net. CNNs are a class of deep neural networks that preserve spatial information in the network
architecture and can learn patterns within images. Here we used the dense V-Net, a fully CNN model designed
for segmentation tasks39. The dense V-Net consists of batch-wise spatial dropout, dense features stacks, V-Net
downsampling and upsampling subnetworks, and dilated convolutions54–56. Skip connections in the V-Net archi-
tecture forward higher resolution information to the final segmentation. To limit bias towards predicting the
image background, a loss function based on the Sørensen-Dice index (Dice Hinge) was employed and mini-
mized. The output after soft-max transformation is probabilistic segmentation masks for each muscle with the
same dimensions as the input volume.
Scientific Reports | (2021) 11:16567 | https://doi.org/10.1038/s41598-021-95972-x 12
Vol:.(1234567890)www.nature.com/scientificreports/
Training. Each dataset was first resampled to 0.7 mm × 0.7 mm × 3.0 mm resolution and zero padded
(90 × 60 × 8 voxels). A three-dimensional dense V-Net model was trained using the in-phase and out-of-phase
images of the augmented training dataset (spatial window = 360 × 240 × 32 voxels, learning rate = 0.001, activa-
tion function = ReLu, optimizer = Adam, loss function = Dice Hinge, regularization = ℓ2, decay = 0.00001, sam-
ples per volume = 3, batch size = 3, window sampling = uniform). Prior to training, histogram standardization
and label normalization were performed. The dense V-Net model was initialized with random weights, and
training was completed once the Sørensen-Dice index plateaued on the validation dataset.
Performance. Performance of the CNN model was assessed using the Sørensen-Dice index (Dice), Jac-
card index (JI), conformity coefficient (CC), true positive rate (TPR), true negative rate (TNR), positive predic-
tive value (PPV), and volume ratio (VR) measures (Supplementary Table 1)57. Percent muscle fat infiltration
(MFI) and muscle volume (ml) were measured using the segmentation masks from the GT and the CNN model
for each muscle. MFI was calculated as the mean fat-only signal within a muscle divided by the sum of the mean
fat-only signal and the mean water-only signal within a muscle multiplied by 100:
Fat
MFI = × 100
(Fat + Water)
Accuracy and reliability between the GT and the CNN model were assessed using Bland-Altman plots,
Pearson correlations, and intraclass correlation coefficients ( ICC2,1). The reliability between the two manual
raters was also similarly calculated to assess interrater reliability between two human raters. For reliability and
accuracy, MFI was considered the primary measure, while volume was used as a secondary measure to further
assess the CNN segmentations.
MFI assessment and characterization. Next, we used the trained CNN model to automatically segment
the datasets of 84 participants from the first study time point (< 2 weeks following MVC, 61 females, 23 males,
age = 34.2 ± 10.7 years) to examine differences in MFI between the muscle groups and then explore the relation-
ship between MFI and sex, age, and BMI. The MFI of each muscle was calculated from the CNN segmentations,
and then the left and right MFI measures for each muscle group were averaged to limit the number of compari-
sons and because we had no a priori hypotheses regarding left-right differences in MFI. A repeated measures
ANCOVA with a within-subject variable of the muscle group, a between-subject factor of sex, and covariates of
BMI and age was performed. This was followed by two-tailed paired t-tests to assess differences in MFI between
the muscle groups, and pair-plots were generated to assess correlations in MFI between each muscle group. To
identify sex differences in MFI for each muscle group, a one-way ANCOVA (i.e., multiple linear regression)
was performed with a fixed factor of sex and covariates of age and BMI. Two-tailed partial Pearson correlations
were performed to identify linear relationships between MFI and age or MFI and BMI while correcting for sex
and BMI or sex and age, respectively. As these analyses were exploratory and aimed at further characterizing
the MFI measures, no corrections for multiple comparisons were performed. Since the muscle groups were
segmented at specific vertebral levels rather than across the entire superior-inferior extent of the muscle, the
muscle volume measures obtained from the CNN model were not expected to represent an accurate measure of
muscle size, and therefore, a more in-depth analysis of muscle volumes was not performed. Statistical analyses
were performed using IBM SPSS Statistics (Version 27.0, Armonk, NY, USA), and an α < 0.05 was considered
statistically significant.
Data availability
The de-identified datasets used in this study are available from the corresponding author upon reasonable request.
The CNN segmentation model was developed using open-source Python packages (Tensorflow and NiftyNet). We
are making the code and model openly available for transparency, replication, reproduction, and further research
in more diverse samples. These will be made available on GitHub (https://g ithub.c om/k ennet haweb
erii/). We will
also release code to segment and compute volume and MFI from a cervical spine Dixon fat-water imaging scan.
Received: 26 April 2021; Accepted: 28 July 2021
References
1. Global, regional, and national age-sex specific all-cause and cause-specific mortality for 240 causes of death, 1990–2013: a system-
atic analysis for the Global Burden of Disease Study 2013. Lancet 385(9963), 117–171 (2015).
2. Hoy, D., Brooks, P., Blyth, F. & Buchbinder, R. The epidemiology of low back pain. Best Pract. Res. Clin. Rheumatol. 24(6), 769–781
(2010).
3. Hoy, D. et al. The global burden of low back pain: estimates from the Global Burden of Disease 2010 study. Ann. Rheum. Dis. 73(6),
968–974 (2014).
4. Hoy, D. et al. The global burden of neck pain: estimates from the global burden of disease 2010 study. Ann. Rheum. Dis. 73(7),
1309–1315 (2014).
5. Elliott, J. M. et al. Does overall cervical spine pathology relate to the clinical heterogeneity of chronic whiplash? Am. J. Emerg. Med.
38(5), 869–873 (2020).
6. Nakashima, H. et al. Abnormal findings on magnetic resonance images of the cervical spines in 1211 asymptomatic subjects. Spine
40(6), 392–398 (2015).
7. Brinjikji, W. et al. Systematic literature review of imaging features of spinal degeneration in asymptomatic populations. AJNR Am.
J. Neuroradiol. 36(4), 811–816 (2015).
8. Romeo, V. et al. High Prevalence of Spinal Magnetic Resonance Imaging Findings in Asymptomatic Young Adults (18–22 Yrs)
Candidate to Air Force Flight. Spine (Phila Pa 1976) 44(12), 872–878 (2019).
Scientific Reports | (2021) 11:16567 | https://doi.org/10.1038/s41598-021-95972-x 13
Vol.:(0123456789)www.nature.com/scientificreports/
9. Maus, T. Imaging the back pain patient. Phys Med Rehabil Clin N Am 21(4), 725–766 (2010).
10. Deyo, R. A., Mirza, S. K., Turner, J. A. & Martin, B. I. Overtreating chronic back pain: time to back off?. J Am Board Fam Med
22(1), 62–68 (2009).
11. Sykes, J. Reflections on the current status of commercial automated segmentation systems in clinical practice. J. Med. Radiat. Sci.
61(3), 131–134 (2014).
12. Azimi, P. et al. A Review on the use of artificial intelligence in spinal diseases. Asian SPINE J. 14(4), 543–571 (2020).
13. Khan, O., Badhiwala, J. H., Grasso, G. & Fehlings, M. G. Use of machine learning and artificial intelligence to drive personalized
medicine approaches for spine care. World Neurosurg. 140, 512–518 (2020).
14. Johnson, K. B. et al. Precision Medicine, AI, and the Future of Personalized Health Care. Clin. Transl. Sci. 14(1), 86–93 (2021).
15. Cloney, M. et al. Fatty infiltration of the cervical multifidus musculature and their clinical correlates in spondylotic myelopathy. J
Clin Neurosci 57, 208–213 (2018).
16. Elliott, J. et al. Fatty infiltration in the cervical extensor muscles in persistent whiplash-associated disorders: a magnetic resonance
imaging analysis. Spine 31(22), E847-855 (2006).
17. Smith, A. C. et al. Potential associations between chronic whiplash and incomplete spinal cord injury. Spinal Cord Ser Cases. 1,
15024 (2015).
18. Elliott, J. M. et al. Magnetic resonance imaging findings of fatty infiltrate in the cervical flexors in chronic whiplash. Spine 35(9),
948–954 (2010).
19. Smith, A. C. et al. Confirming the geography of fatty infiltration in the deep cervical extensor muscles in whiplash recovery. Sci.
Rep. 10(1), 11471 (2020).
20. Elliott, J. M. et al. Muscle fat infiltration following whiplash: a computed tomography and magnetic resonance imaging comparison.
PLoS One. 15(6), e0234061 (2020).
21. Paliwal, M. et al. Fatty infiltration in cervical flexors and extensors in patients with degenerative cervical myelopathy using a
multi-muscle segmentation model. PLoS One. 16(6), e0253863 (2021).
22. Crawford, R. J., Cornwall, J., Abbott, R. & Elliott, J. M. Manually defining regions of interest when quantifying paravertebral muscles
fatty infiltration from axial magnetic resonance imaging: a proposed method for the lumbar spine with anatomical cross-reference.
BMC Musculoskelet Disord 18(1), 25 (2017).
23. Elliott, J. M., Cornwall, J., Kennedy, E., Abbott, R. & Crawford, R. J. Towards defining muscular regions of interest from axial
magnetic resonance imaging with anatomical cross-reference: part II—cervical spine musculature. BMC Musculoskelet Disord
19(1), 171 (2018).
24. Weber, K. A. et al. Deep learning convolutional neural networks for the automatic quantification of muscle fat infiltration following
whiplash injury. Sci. Rep. 9(1), 7973 (2019).
25. Shen, H. et al. A deep-learning-based, fully automated program to segment and quantify major spinal components on axial lumbar
spine magnetic resonance images. Phys. Ther. 101(6), pzab041 (2021).
26. Fitzpatrick, J. A. et al. Large-scale analysis of iliopsoas muscle volumes in the UK Biobank. Sci Rep 10(1), 20215 (2020).
27. Huang, J. et al. Spine Explorer: a deep learning based fully automated program for efficient and reliable quantifications of the
vertebrae and discs on sagittal lumbar spine MR images. Spine J 20(4), 590–599 (2020).
28. Dow, D. F., Mehta, K., Xu, Y. & England, E. The relationship between body mass index and fatty infiltration in the shoulder mus-
culature. J Comput Assist Tomogr 42(2), 323–329 (2018).
29. Marcus, R. L., Addison, O., Kidde, J. P., Dibble, L. E. & Lastayo, P. C. Skeletal muscle fat infiltration: impact of age, inactivity, and
exercise. J Nutr Health Aging 14(5), 362–366 (2010).
30. Urrutia, J. et al. Lumbar paraspinal muscle fat infiltration is independently associated with sex, age, and inter-vertebral disc
degeneration in symptomatic patients. Skeletal Radiol 47(7), 955–961 (2018).
31. Cicchetti, D. V. Guidelines, criteria, and rules of thumb for evaluating normed and standardized assessment instruments in psy-
chology. Psychol. Assess. 6(4), 284–290 (1994).
32. Delmonico, M. J. et al. Longitudinal study of muscle strength, quality, and adipose tissue infiltration. Am. J. Clin. Nutr. 90(6),
1579–1585 (2009).
33. Crawford, R. J. et al. Age- and level-dependence of fatty infiltration in lumbar paravertebral muscles of healthy volunteers. AJNR
Am. J. Neuroradiol. 37(4), 742–748 (2016).
34. Crawford, R. J., Elliott, J. M. & Volken, T. Change in fatty infiltration of lumbar multifidus, erector spinae, and psoas muscles in
asymptomatic adults of Asian or Caucasian ethnicities. Eur. Spine J. 26(12), 3059–3067 (2017).
35. Etchison, W. C. et al. Body mass index and percentage of body fat as indicators for obesity in an adolescent athletic population.
Sports Health 3(3), 249–252 (2011).
36. Zhang, W. et al. Deep convolutional neural networks for multi-modality isointense infant brain image segmentation. Neuroimage
108, 214–224 (2015).
37. Glocker, B. et al. Correction of Fat-Water Swaps in Dixon MRI. Medical Image Computing and Computer-Assisted Intervention -
MICCAI 2016. 536–543 (Cham. Springer International Publishing, 2016).
38. Jafari, R. et al. Deep neural network for water/fat separation: supervised training, unsupervised training, and no training. Magn.
Reson. Med. 85(4), 2263–2277 (2021).
39. Gibson, E. et al. automatic multi-organ segmentation on abdominal CT With dense V-networks. IEEE Trans. Med. Imaging 37(8),
1822–1834 (2018).
40. Ronneberger, O., Fischer, P., Brox, T. U-Net: Convolutional Networks for Biomedical Image Segmentation. Medical Image Comput-
ing and Computer-Assisted Intervention – MICCAI 2015. 234–241 (Cham. Springer International Publishing, 2015).
41. Çiçek, Ö., Abdulkadir, A., Lienkamp, S. S., Brox, T., Ronneberger, O. Three-dimensional U-Net: Learning Dense Volumetric
Segmentation from Sparse Annotation. Medical Image Computing and Computer-Assisted Intervention – MICCAI 2016. 424–432
(Cham. Springer International Publishing, 2016).
42. Zeng, G. et al. Three-dimensional U-net with Multi-level Deep Supervision: Fully Automatic Segmentation of Proximal Femur in
three-dimensional MR Images. Machine Learning in Medical Imaging. 274–282 (Cham. Springer International Publishing, 2017).
43. Gordienko, Y. et al. Deep Learning with Lung Segmentation and Bone Shadow Exclusion Techniques for Chest X-Ray Analysis of
Lung Cancer. Advances in Computer Science for Engineering and Education. 638–647 (Cham. Springer International Publishing,
2019).
44. Desai, A. D. et al. Group ISCW. The International Workshop on Osteoarthritis Imaging Knee MRI segmentation challenge: a
multi-institute evaluation and analysis framework on a standardized dataset. Radiol Artif Intell 3(3), e200078 (2021).
45. Hesamian, M. H., Jia, W., He, X. & Kennedy, P. Deep learning techniques for medical image segmentation: achievements and
challenges. J Digit Imaging 32(4), 582–596 (2019).
46. Kavur, A. E. et al. CHAOS Challenge - combined (CT-MR) healthy abdominal organ segmentation. Med. Image Anal. 69, 101950
(2021).
47. Cai, J. et al. Improving deep pancreas segmentation in CT and MRI images via recurrent neural contextual learning and direct
loss function. arXiv:1707.04912 (2017).
48. Isensee, F., Jaeger, P. F., Kohl, S. A. A., Petersen, J. & Maier-Hein, K. H. nnU-Net: a self-configuring method for deep learning-based
biomedical image segmentation. Nat. Methods 18(2), 203–211 (2021).
Scientific Reports | (2021) 11:16567 | https://doi.org/10.1038/s41598-021-95972-x 14
Vol:.(1234567890)www.nature.com/scientificreports/
49. Al-Masni, M. A. & Kim, D. H. CMM-Net: contextual multi-scale multi-level network for efficient biomedical image segmentation.
Sci Rep 11(1), 10191 (2021).
50. Billot, B. et al. A Learning strategy for contrast-agnostic MRI segmentation. In: Proceedings of the Third Conference on Medical
Imaging with Deep Learning. Proceedings of Machine Learning Research, Vol. 121 (eds Tal, A. et al.) 75–93 (2020).
51. OpenNeuro. https://openneuro.org. 2021.
52. Dixon, W. T. Simple proton spectroscopic imaging. Radiology 153(1), 189–194 (1984).
53. Gibson, E. et al. NiftyNet: a deep-learning platform for medical imaging. Comput Methods Programs Biomed 158, 113–122 (2018).
54. Milletari, F., Navab, N. & Ahmadi, S. -A. V-Net: Fully Convolutional Neural Networks for Volumetric Medical Image Segmenta-
tion. Preprint at, https://arxiv.org/abs/1606.04797 (2016).
55. Yu F, Koltun V. Multi-scale context aggregation by dilated convolutions. Preprint at, https://arxiv.org/abs/1511.07122 (2016).
56. Huang, G., Liu, Z., Maaten, L. V. D. & Weinberger, K. Q. Densely connected convolutional. Networks 2017(21–26), 2261–2269
(2017).
57. Prados, F. et al. Spinal cord grey matter segmentation challenge. Neuroimage 152, 312–329 (2017).
Acknowledgements
This study was supported by grants from the National Institute of Child Health and Human Development/
National Center for Medical Rehabilitation Research (Grant Numbers R01HD079076, R03HD094577), the
National Institute of Neurological Disorders and Stroke (Grant Numbers K23NS104211, L30NS108301), and
the National Institute of Drug Abuse (Grant Number K24DA029262). The content is solely the responsibility of
the authors and does not necessarily represent the official views of the National Institutes of Health.
Author contributions
KAW: Conceptualization, Methodology, Software, Formal analysis, Investigation, Data Curation, Writing—Orig-
inal Draft, Writing—Review and Editing, Visualization, Funding acquisition. RA: Methodology, Validation,
Investigation, Writing—Original Draft, Writing—Review and Editing. VB: Methodology, Validation, Inves-
tigation, Writing—Review and Editing. ACS: Methodology, Investigation, Data Curation, Writing—Original
Draft, Writing—Review and Editing. MW: Investigation, Data Curation, Writing—Review and Editing. TJH:
Methodology, Supervision, Writing—Review and Editing. TBP: Methodology, Supervision, Writing—Review
and Editing, Funding acquisition. SM: Resources, Writing—Review and Editing, Supervision, Funding acquisi-
tion. JME: Methodology, Investigation, Resources, Data Curation, Writing—Original Draft, Writing—Review
and Editing, Project administration, Funding acquisition.
Competing interests
The authors declare no competing interests.
Additional information
Supplementary Information The online version contains supplementary material available at https://doi.org/
10.1038/s41598-021-95972-x.
Correspondence and requests for materials should be addressed to K.A.W.
Reprints and permissions information is available at www.nature.com/reprints.
Publisher’s note Springer Nature remains neutral with regard to jurisdictional claims in published maps and
institutional affiliations.
Open Access This article is licensed under a Creative Commons Attribution 4.0 International
License, which permits use, sharing, adaptation, distribution and reproduction in any medium or
format, as long as you give appropriate credit to the original author(s) and the source, provide a link to the
Creative Commons licence, and indicate if changes were made. The images or other third party material in this
article are included in the article’s Creative Commons licence, unless indicated otherwise in a credit line to the
material. If material is not included in the article’s Creative Commons licence and your intended use is not
permitted by statutory regulation or exceeds the permitted use, you will need to obtain permission directly from
the copyright holder. To view a copy of this licence, visit http://creativecommons.org/licenses/by/4.0/.
© The Author(s) 2021
Scientific Reports | (2021) 11:16567 | https://doi.org/10.1038/s41598-021-95972-x 15
Vol.:(0123456789)You can also read