Monitoring the impacts of COVID19 on affordable diets: Real-Time Cost of the Diet and Household Economic Analysis pilot Malawi, Results Brief ...
←
→
Page content transcription
If your browser does not render page correctly, please read the page content below
Monitoring the impacts of COVID19 on affordable diets:
Real-Time Cost of the Diet and Household Economic Analysis pilot
Malawi, Results Brief

INTRODUCTION
Purpose of the pilot, brief and audience:
The COVID-19 pandemic has disrupted food supply chains and economic systems worldwide. With countries facing
disrupted livelihoods, restricted movements, disrupted markets, border closures and rising food prices, this study aimed to
understand how these disruptions may have impacted cost and affordability of the diet. The pilot aimed to leverage
existing price data to adapt the HEA and CotD methodologies for real-time monitoring of the cost and affordability of a
nutritious diet changes over time in the context of the COVID-19 pandemic. This brief presents key learnings for policy
makers and technical learnings for practitioners.

Cost of the Diet (CotD)?
The CotD is an innovative method and software developed by Save the Children UK to estimate the amount and
combination of local foods that are needed to provide a typical family with a diet that meets their average needs for
energy and their recommended intakes of protein, fat and micronutrients.

Household Economy Analysis (HEA)
HEA 1 is a livelihoods framework that assesses and quantifies different households’ food, income and expenditure sources
to identify if they have enough resources to meet their food and non -food needs. It has modeling capacity and can predict
how a change (positive or negative) will impact households’ abilities to access their typical food and cash sources. HEA has
two main components:

1) Baseline analysis – the analysis of how people get by in a typical (non-shock) year (called the reference year) and the
   connections with other people and places that enable them to do so, and
2) Outcome analysis (OA) - the investigation of how that baseline access to food and income will likely change as a result
   of a specific hazard such as drought or as the result of a positive change, such as a program input or beneficial price
   policy.

HEA and CotD are interlinked and complementary. In this pilot, HEA has been used to assess the affordability of the diets
produced by CotD.

    Location of study:        Zomba district, Malawi in Shire Highlands (SHI) and Lake Chilwa-Phalombe Plain (PHA)
                              livelihood zones.

    Period of study:          April 2020 - March 2021

1
 For more information on the method, please see: https://resourcecentre.savethechildren.net/library/household-economy-approach-
guide-programme-planners-and-policy-makers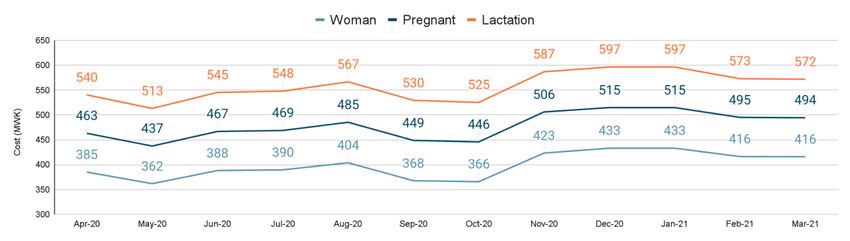
Methods:                                                         Household Composition of 6 in           5 Markets:
    ● Use of market prices of food items from an existing            SHI and 7 in PHA:                       SHI Livelihood Zone
      Minimum Expenditure Basket (MEB) 2                              ● Breastfed child 12-23 months          ● Chinamwali
                                                                      ● Child, 7-8 years                      ● Mayaka
    ● Analysis and cost of the diet modelling using the CotD
                                                                      ● Child, 9-10 years                     ● Jali
      Software
                                                                      ● Child, 11-12 years                    ● Songani
    ● Diet was adjusted for the usual consumption of rice,            ● Chld, 13-17 years (for               PHA Livelihood Zone
      millet, sorghum and cowpeas3                                        household of 7 only)                ● Chinamwali
    ● Projected annual income is updated using HEA                    ● Man, 30-59 years, 50kg,
      monitoring data from field work from                                moderately active
    ● Analysis is for the very poor wealth group only                 ● Lactating Woman, 30-59
                                                                          years

    Adaptations to CotD         ●    Use of a shortened food list of typically consumed foods
    methodology                 ●    CotD analysis was conducted monthly instead of per season
                                ●    Food habit constraints were limited for usual consumption of staples and cowpeas only
                                     using existing focus group discussion data

    Adaptations to the HEA     Monitoring data was collected monthly from November 2020 to March 2021 on off-farm
    methodology                income generating activities. The HEA outcome analysis was updated once to reflect this data.

    Limitations                The cost of the diet calculated in the study may not reflect the lowest possible cost since price
                               market data is collected for a shortened food list defined by the MEB at a limited number of
                               markets. The study was not located in the worst hit areas of COVID-19.

KEY RESULTS

Part 1: Diet Composition
Foods selected

●     The World Food Programme collects prices for food and non-food items from over 100 traders in 70 rural and urban
      local markets in Malawi for the Minimum Expenditure Basket (MEB). 4 The foods included in the MEB are based on the
      needs, preferences, and demand behaviour of households, as well as those found in local markets. As a result, foods
      included best represent the food consumption behaviours of Malawi. The MEB excludes meat and dairy as they are
      rarely consumed especially by those classified as vulnerable. The only fruit included in the MEB data is tomato. Millet
      was rarely available in the markets in both livelihood zones according to the MEB data.

●     It is feasible to use the MEB market prices to produce a nutritious diet 5 for a standard family of seven in PHA and six in
      SHI using the prices of the foods monitored by the MEB.

●     The lowest cost diet that is adequate in nutrients for a standard family, taking into account the typical consumption of
      staples and cowpeas, is similar between both livelihood zones. Table 1 illustrates the foods selected for each
      livelihood zone. In both livelihood zones, the diet is comprised of nine to twelve foods per month including two

2
  Non-food items were not included in the analysis. The MEB is defined as what a household requires in order to meet their essentia l
needs, on a regular or seasonal basis, and its cost. For more information see World Food Programme Minimum Expenditure Basket
Guidance Note
3
  As the main staple in Malawi, maize was assumed to be eaten at least once a day and at most twice a day. Rice, millet and sor ghum,
which are not eaten as often, had a maximum consumption of once a day. Cowpeas are usually eaten at most twice a day.
4
  See MEB in Malawi reports for the construction of the MEB, assumptions, and list of commodities included in data collection.
5
  The nutritious diet in this brief is defined as a diet which meets the macro and micronutrient adjusted for staples and cowpeas.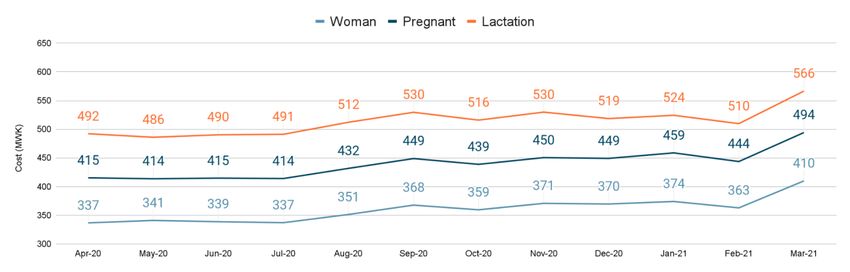
varieties of dried fish (mostly bonya and/or usipa), one type of legume (cowpeas), and eggs as the mai n protein items.
         In addition to maize, in some months rice or sorghum is included. The four vegetables are mpiru (mustard leaves),
         chisoso (blackjack leaves), rape leaves, and chinese cabbage. Table 1 shows how the foods selected vary across the
         months. In addition to the food groups which were not included in the MEB data, fruit, roots and tubers, and milk
         products were not selected.

TABLE 1: FOODS SELECTED IN THE NUTRITIOUS AND LOWEST COST DIET

                                                                Shire Highlands                                      Lake Chilwa - Phalombe Plain

                                                          Year 2020                             2021                       Year 2020                             2021

  Food group      Foods included          Apr   May Jun   Jul   Aug Sep   Oct   Nov Dec   Jan    Feb Mar   Apr   May Jun   Jul   Aug Sep   Oct   Nov Dec   Jan    Feb Mar

  Cereals         Maize, dried, raw
                                                                                                 x   x                                                            x   x
                  Rice, raw
                                                                                                                                                                      x

                  Sorghum                                                                                                                                         x
  Legumes nuts    Cowpea, uncooked
  and seeds                                                                                      x   x                                                            x   x
  Eggs            Egg, chicken, raw
                                                                                                 x   x                                                            x   x
  Fish            Bonya

                  Usipa (Fish, sardine,
                  lake, whole, dried)
                                                                                                 x   x                                                            x   x
  Vegetables      Chinese cabbage, raw

                  Chisoso (blackjack
                  leaves, raw)
                                                                                                                                 x                                x   x
                  Rape leaves, raw
                                                                                                 x   x                                                            x   x
                  Mpiru (mustard leaves
                  raw)
                                                                                                 x   x                                                            x   x
  Oils and fats   Oil, vegetable
                                                                                                 x   x                                                            x   x
  Breast Milk     Breast milk
                                                                                                 x   x                                                            x   x
  Lean Season
Food group contributions to nutrients and cost

Figure 1 shows the average food group contribution to the cost, calories and protein of the nutritious diet between April
2020 to March 2021 for SHI and PHA livelihood zones.

Shire Highlands (SHI)

●   The breakdown illustrates the importance of grains contributing 29% of the cost of the diet and providing the bulk of
    calories (60%) and protein needs (42%).

●   The main staples are maize and rice. In this context, maize is highly important to the diet as it provides approximately
    27% of quantity (kg), 42% of calories, 30% of protein, with only 13% of the cost of the diet. Sorghum is included in
    September and October and only contributes to 4% of calories while rice is included 10 out of 12 months contributing
    14% to total calories.

●   Another major nutrient source is cowpeas, the only legumes. It accounts for 17% of the cost of diet, 10% of total
    quantity (kg),14% of calories, 30% of protein and 74% of folic acid. Other nutrients cowpeas also provide include 23%
    of niacin, 27% of vitamin B1 and 25% of zinc.

●   While two types of fish are selected, bonya and usipa are both types of sardines. Together, they contribute to 51% of
    vitamin B2 and 78% of vitamin B12. Because fish is included in a small amount, less than one serving size a week, it is
    not a major source of calcium (6%).

●   Four varieties of vegetables selected are mpiru (mustard greens), rape leaves, blackjack leaves, and chinese cabbage.
    Mpiru is an important source of vitamin A (61%), vitamin C (90%), vitamin B6 (27%), calcium (34%), and iron (15%).
    Rape leaves also provide 24% of vitamin A, 43% of calcium, and 21% of iron in the diet. Chinese cabbage, on the other
    hand, provides little nutrients to the diet.

Lake Chilwa - Phalombe Plain

●   Food group contribution of a nutritious diet in PHA (Figure 1b) follows a similar pattern in Shire Highlands with the
    exception of staples where the composition of staples vary. In the PHA diet, sorghum in addition to maize and rice are
    selected throughout the year (table 1). Unlike in the Shire Highlands, sorghum in addition to maize is an important
    source of calories (23%), protein (22%), and micronutrients.

●   On average, the cost contribution of grains is lower in PHA (26%) compared to SHI (29%). Additionally, the cost
    contribution of eggs is higher in the PHA livelihood zone (25%) compared to the SHI livelihood zone (17%).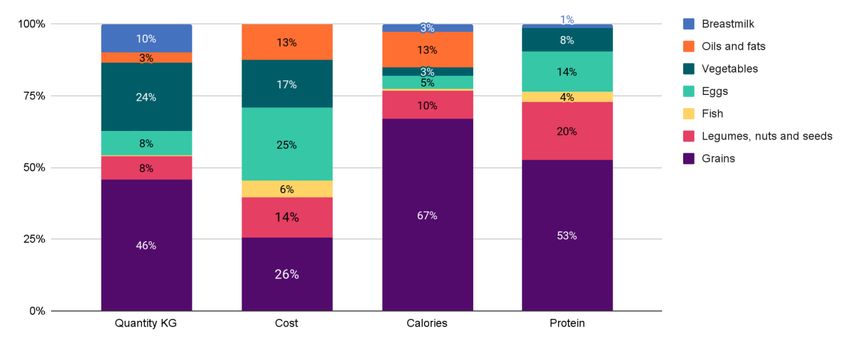
FIGURE 1: AVERAGE FOOD GROUP CONTRIBUTION TO COST OF THE DIET, CALORIES AND PROTEIN FROM APRIL 2020 TO MARCH
 2021

    a)    SHIRE HIGHLANDS (SHI)

    b)    LAKE CHILWA - PHALOMBE PLAIN (PHA)

Part 2: Cost of the diet from April 2020 to March 2021

Figure 2 illustrates the daily cost of a nutritious diet by month for a family in the very poor wealth group in Shire Highlan ds
and Lake Chilwa Phalombe Plain from April 2020 to March 2021. Trends in the cost contribution for each food group can
be found in figure 3.

Shire Highlands

●        In the Shire Highlands, the daily cost of a nutritious diet ranged from 1862 MWK in May 2020 to 2303 MWK in
         December 2020/January 2021. On average, the daily cost was 2084 MWK. The cost of a nutritious diet was lowest
         following the months of harvest in May. As expected, the cost of the diet increased as the lean season approached
         starting in December.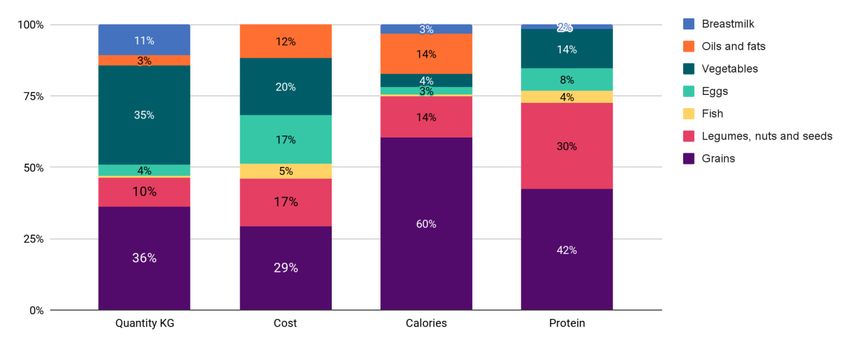
● The price of cowpeas was highest in September and October 2020. As a result, cowpeas were replaced by fish and
eggs in those months.
Lake Chilwa - Phalombe Plain
● On average, the daily cost of the diet between April 2020 to March 2021 was 2234 MWK. This is higher than in the SHI
livelihood zone where a very poor household has six instead of seven people.
● The daily cost of the diet ranged between 2052 MWK in July 2021 and 2603 MWK in March 2021. The cost of the diet
in PHA remained relatively stable between April 2020 to August 2020 varying between 2052 MWK to 2603 MWK per
day. The cost then begins to rise as the lean season approaches in October. The daily cost in March 2021 was around
300 MWK higher than February 2021 likely due to sorghum not unavailable in the market.
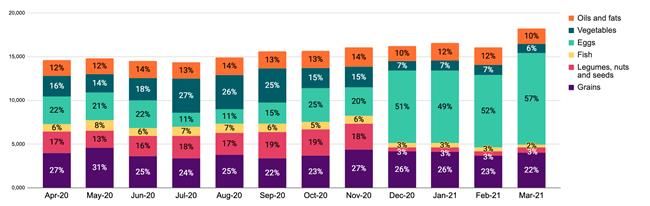
● Because the price of cowpeas increased by 42% from November 2020 to December 2020, a large proportion of
cowpeas was replaced by eggs. The price of cowpeas increased further in January 2021 and this trend continued until
March 2021. As a result, in December 2020 and January 2021, the cost contribution of eggs increased from 20% to
approximately 50%.
FIGURE 2: DAILY COST (MWK) OF A NUTRITIOUS DIET BY MONTH IN SHIRE HIGHLANDS (SHI) AND LAKE CHILWA PHALOMBE PLAIN
(PHA)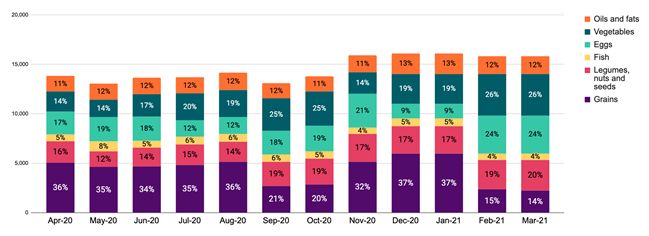
FIGURE 3: WEEKLY COST AND COST CONTRIBUTION OF FOOD GROUPS OF A NUTRITIOUS DIET BY MONTH IN SHI AND PHA
        a) SHIRE HIGHLANDS (SHI)

                                                                              Lean season

        b)   Lake Chilwa - Phalombe Plain (PHA)

                                                                         Lean season

Effect of COVID-19 on the cost of the diet

The specific effects of the COVID-19 pandemic are difficult to distinguish from other factors that affect food prices. Malawi
was one of the last countries in Africa to be hit by the COVID-19 pandemic with the first case confirmed in April 2020. 6 A
full lock-down was proposed in mid-April but was never implemented in recognition of the risk of populations vulnerable
to economic and health service disruptions.7 However, social distancing measures were tightened in June 2020. 8 Daily
confirmed cases in Malawi remained below 200 between April and August 2020, dropped to below five confirmed daily

6
  Reuter. Malawi records first three cases of coronavirus (2 April 2020)
7
  The Lancet. Africa faces difficult choices in responding to COVID-19. (12 May 2020)
8
  IFPRI Malawi. The Short-term Impacts of COVID-19 on the Malawian Economy, 2021-2021. A SAM multiplier modeling analysis
(December 2020)
cases, but began rising again in December 2020.9 By 22 January 2021, the number of confirmed cases peaked at 1,326. By
April, this has fallen to below 20 confirmed daily cases.
FewsNet reports that the impact of COVID-19 control measures on rural livelihoods remain minimal in 2021 as agricultural
production and marketing continue to take place normally. 10 Below is a summary of pricing trends for specific food items.
● Weak demand for produce observed from May till July likely due to low consumer spending from job losses or fear
of job loss. In June, the weak demand for produce manifested through low prices. By the end of June, low prices
continue due to abundant supplies of grains and other staple foods including rice, cassava, and sweet potatoes. 11 This
low price continued until early July. Early July is supposed to be the peak of the commodity marketing season but
demand remains weak for agriculture products.
● The price of maize in 2020 and 2021, an important part of the nutritious diet, was lower than the 2019 price levels.
Diverging from seasonal price increases, national maize prices remained stable in November and December 2020 at
24 to 39 percent below their corresponding 2019 levels. 12 This trend continued into January and February 2021 where
maize prices continued to remain below (30 to 44%) the prices at the same time last year. 13
Price of pulses (beans, cowpeas, and pigeon peas) was above the five-year average in the study period. 14 In August, the
price of pulses increased as more households turned to markets. 15 While the price of pulses began falling between the end
of February 2021 as a result of increased market supplies from consumption of own har vests, in March 2021, the prices of
pulses remained higher during the current lean season compared to the corresponding period in the previous year despite
a surplus in production of pulses in the country. 16 This may be explained by exports into regional markets driving prices
during the lean season.17
9
https://covid19.health.gov.mw/Charts/publicdashboards
10
Fews Net, Malawi Humanitarian assistance improves outcomes, with above-average crop production expected in April/May
(February 2021)
11
World Food Programme Minimum Expenditure Basket in Malawi - Round 5: 15-23 June 2020
12
Fews Net, New COVID-19 restrictions drive re-emergence of crises (IPC Phase 3) outcomes in urban areas January 2021
13
Fews Net, Malawi Price Bulletin February 2021
14
World Food Programme Minimum Expenditure Basket in Malawi - Round 25: 22nd to 26th March 202
15
World Food Programme Minimum Expenditure Basket in Malawi - Round 9: 10th to 17th August 2020
16
World Food Programme Minimum Expenditure Basket in Malawi - Round 26: 5th to 9th April 2021
17
World Food Programme Minimum Expenditure Basket in Malawi - Round 26: 5th to 9th April 2021Part 3: Income Analysis
● The MVAC seasonal assessment results TABLE 2: ANNUAL INCOME OF A VERY POOR HOUSEHOLD
from April 2020 have been updated Livelihood zone SHI PHA
using HEA monitoring data from
fieldwork covering off-farm income
generating activities from November Consumption year Apr 2020 - Mar 2021
2020. Annual calculated (projected) cash income from
● The main changes to the April 2020 HEA 157,105 160,321
outcome analysis: agricultural labour in
the cultivation season is 10% lower and Annual value of own produce / free foods 168,196 197,206
self-employment income is half of
Total annual income (cash+food) 2020-21 325,301 357,527
baseline levels. The crop and livestock
analysis conducted during the April Cost of non-food expenditure 2020-21(NFE) -67,015 -63,899
2020 seasonal assessment has not
been revised. Total annual income minus NFE 258,287 293,628
● Monthly changes to income through HEA is not feasible in this context, a rural setting where income is concentrated
in certain months. In Malawi, the bulk of income comes from crop sales at the start of the consumption year. See
table 2 for annual income calculations.
Part 4: Affordability
● The monthly cost of the diet was converted to an annual cost and then compared with the projected annual total
income for very poor households in each livelihood zone for the consumption year April 2020 to March 2021. This is
because the HEA analysis is annual and cannot be broken down by month.
● In both the livelihood zones, the nutritious diet adjusted for staples is not affordable for the very poor wealth group
(Figure 4 and 5). In the SHI livelihood zone, the cost of a nutritious diet is over 260% of the annual income (ranges
between 263% to 325%). By the fifth month, the cost of the diet exceeds 100% of the annual income. Similarly, the
diet is unaffordable for the very poor households in PHA with the monthly cost of the diet equating to a minimum of
260% of the income. Similar to the SHI livelihood zone, by the fifth month, the cost of the diet in PHA reaches 100% of
the annual income.
FIGURE 4: ANNUAL COST OF THE DIET (BY MONTH) VERSUS HEA ANNUAL INCOME*
A) SHIRE HIGHLANDS (SHI) B) LAKE CHILWA - PHALOMBE PLAIN (PHA)
Lean
Lean season
season*Annual income = annual cash income + value of own production - non-food expenditure. The CotD monthly costs have been converted into annual
amounts for this comparison. The annual income is 258,287 MWK for SHI and MWK for PHA
FIGURE 5: CUMULATIVE COST OF THE DIET VERSUS HEA ANNUAL INCOME*
A) SHIRE HIGHLANDS (SHI) B) LAKE CHILWA - PHALOMBE PLAIN (PHA)
*Annual income = annual cash income + value of own production - non-food expenditure. The CotD monthly costs have been converted into annual
amounts for this comparison.. The annual income is 258,287 MWK for SHI and MWK for PHA
Part 4: Limiting Nutrients
● Table 3 shows the nutrients that drive the cost of the nutritious diet. Consistently through the year, the nutrients
driving the cost of the diet within the household and for all members of the family are pantothenic acid and vitamin
B12.
● Other limiting nutrients such as vitamin A, calcium and iron are also limiting nutrients for specific members of the
household. Several of the limiting nutrients which also vary across the months are vitamin A, folic acid, and vitamin
B6.
TABLE 3: LIMITING NUTRIENTS
A) SHIRE HIGHLANDS (SHI)
Pantothenic Acid Vitamin B12 Vitamin A Calcium Iron Folic Acid B6
Household x x *
Child 12-23 months x x x x * *
Child 7-14 x x * x *
Man 30-59y x x x x
Woman, 30-59y
(lactation 7-12 months) x x x x
B) LAKE CHILWA - PHALOMBE PLAIN (PHA)
Pantothenic Acid Vitamin B12 Vitamin A Calcium Iron Folic Acid B6
Household x x *
Child 12-23 months x x x x * *
Child 7-14 x x * xMan 30-59y x x * x
Woman, 30-59y
(lactation 7-12 months) x x x x
Legend x In all months * in some months
Part 5: Cost of the nutritious diet for women by breastfeeding and pregnancy status
● On average between April 2020 to March 2021, the daily cost of a nutritious diet for a woman is higher in SHI than in
PHA.
● The daily cost of a nutritious diet for a pregnant woman increases by 20% from 399 MWK to 478 MWK in SHI and 22%
from 360 MWK to 439 MWK in PHA livelihood zones when compared to a non-pregnant woman. A woman who is
breastfeeding has the highest cost, 17% and 18% above the cost to meet the nutritional needs of a pregnant woman.
Figure 5 shows the daily cost of a nutritious diet based on a woman’s pregnancy and lactation status.
● Figure 6 shows the daily cost of the diet by pregnancy and breastfeeding practice by month. It follows the same trend
as the overall cost of the diet for the household.
FIGURE 5: AVERAGE DAILY COST OF A NUTRITIOUS DIET (MWK) BETWEEN APRIL 2020 TO MARCH 2021 FOR WOMEN* BY
PREGNANT AND LACTATION STATUS BY LIVELIHOOD ZONE
*Women aged 30-59y, moderately active / lactation trimester average / pregnancy semester averageFIGURE 6: DAILY COST BY MONTH BY BREASTFEEDING PRACTICES
A) SHIRE HIGHLANDS (SHI)
B) LAKE CHILWA - PHALOMBE PLAIN (PHA)
*Women aged 30-59y, moderately active / lactation trimester average / pregnancy semester average
Part 6: Daily cost of the nutritious diet for a child 12-23 months (MWK)
● Another vulnerable group is a breastfed child requiring complementary feeding to meet estimated requirements. On
average, between April 2020 to March 2021, the daily cost of the nutritious diet for a breastfed child 12 -23 months is
58 MWK in SHI and 56 MWK in PHA. Figure 7 shows the monthly trend.
FIGURE 7: AVERAGE DAILY COST OF A NUTRITIOUS DIET (MWK) BETWEEN APRIL 2020 TO MARCH 2021 FOR A BREASTFED CHILD
12-23 MONTHSKEY LEARNINGS AND CONCLUSION
Programme and Policy
1. Key learning 1: The COVID-19 pandemic has increased the cost and reduced the affordability of a nutritious diet for a
very poor family in both the SHI and PHA livelihood zones in Malawi. While specific impacts of COVID-19 restrictions
cannot be distinguished from other factors, the pandemic has had a negative impact on the affordability of a nutritious
diet, particularly in the beginning of 2021. This is despite historically low maize prices. This decrease in affordability o f
nutritious diet may indicate worsening malnutrition and another wave of the COVID-19 infection may further
exacerbate wasting and stunting.
2. Key Learning 2: Livelihood zone level analysis highlights local variations in cost and affordability. SHI and PHA differ
in diet composition, trends in cost, and affordability of the diet. Income also varies between the livelihood zones.
Because only one market was available for the PHA livelihood zone, the absence of a main grain, sorghum, in the
market may have unnecessarily increased the cost of the diet.
3. Key learning 3: Results can be used to inform shock responsive social protection and may be used as an early
warning system for worsening malnutrition. While the actual cost of a nutritious diet may be lower than what has
been calculated by the CotD software, these monthly costs may provide guidance for cash and cash-based
interventions. The fact that cost of a nutritious diet exceeded incomes by over 200% in every month of the year for this
very poor underscore the vulnerability of this group and their need for economic strengthening support even before
the pandemic hit.
Technical and Methods
4. Key learning 4: Monthly cost analysis is feasible on a shortened food list. The monthly costs reveal seasonal variations
as well as highlight monthly variations in the cost, affordability, and composition of the nutritious diet due to the rise
and fall of food item prices. One limitation to the shortened food list is that the total cost of the diet may not be
actually the cheapest available. The limited number of markets monitored in each livelihood zone also meant price
estimates were based on fewer data points.
5. Key learning 5: Monthly income level analysis is not feasible in a context where the majority of the income is
concentrated in certain months. While non-farming incomes are monitored monthly, a large amount of the income is
obtained at the start of the consumption year which is harvest time in agriculture zones making it difficult to allocate
income monthly. Monthly income level analysis may be feasible in an urban setting where household income sources
may not change from month to month.
6. Key Learning 6: To enable regular monthly analysis, modifications to the CotD software to streamline analysis will
need to be made. The current software requires additional analyses and data visualisation to be conducted outside of
the programme. The suggested modifications include increasing the maximum number of seasons to 12 and
streamlining changes to constraints.You can also read


