Modelling Symposium 2020 11 - 12 March 2020 Grand Mercure Hotel Auckland - A very special thanks to our 2020 Sponsors - Water New Zealand
←
→
Page content transcription
If your browser does not render page correctly, please read the page content below
Modelling Symposium
        2020
 11 – 12 March 2020
Grand Mercure Hotel
      Auckland

 A very special thanks to our 2020 Sponsors
Table of Contents
1. Programme
2. Attendees
3. Abstracts
4. Bios
5. Workshop
6. Site Visit
7. AGM
      a. 2019 Minutes
8. Menus
9. WIPA
10. Contact Information
11. Questionnaire and Feedback
Water New Zealand Modelling Symposium
                      11 – 12 March 2020, Grand Mercure Hotel, Rangitoto Room, Auckland

                                                   PROGRAMME

Day One – Wednesday 11 March

 8.30-9.00   Registration / Tea and Coffee
 9.00am      Welcome and Symposium Opening – Nadia Nitsche, Chair, Modelling Group
 9.15am      Keynote Address – Dr Celine Cattoen-Gilbert – NIWA – Flow/Flood Forecasting
 10.00am     Morning Tea – Foyer
 10.30am     Word from one of our sponsors – Hydraulic Analysis Limited
 10.45am     Guest Speaker – The Future of 2D Hydraulic Modelling: presentation of new sub-grid turbulence and
             elevation sampling approaches and impact on result accuracy – Bill Syme – BMT Global
 11.15am     Bridging the gap between Modellers and Decision Makers – Fatima Bashir – DHI
 11.45am     HEC-RAS Modelling: Using 1D and 2D models to model bridges with rapidly changing design processes
             – Courtenay Giles – WSP
 12.15pm     Lunch – Vue Restaurant, Level 13, Grand Mercure
 1.00pm      Three-way coupled stormwater model – Girija Mulay – Stantec
 1.30pm      Development of a city-wide drainage model to assess system performance – Bertrand Salmi – Water
             Technology
 2.00pm      Modelling in infrastructure investment for Sulpher Beach – Hansol Lee & Jackie Zhou – Auckland
             Council
 2.30pm      Making Models work; small investments, big rewards – Brendon Schicker – WSP
 3.00pm      Afternoon Tea – Foyer
             Please move to the front of the building as there will be a bus to transport us to Fluid Labs
 3.15pm      Bus departs for Auckland University Fluid Labs
                 •   Please make sure you have closed in shoes
                 •   Will have nibbles and drinks after the visit
 6.00pm      Bus will depart Auckland University for Grand Mercure
 6.30pm      Dinner – The Conservatory, E1/17 Jellicoe St, North Viaduct, Auckland CBD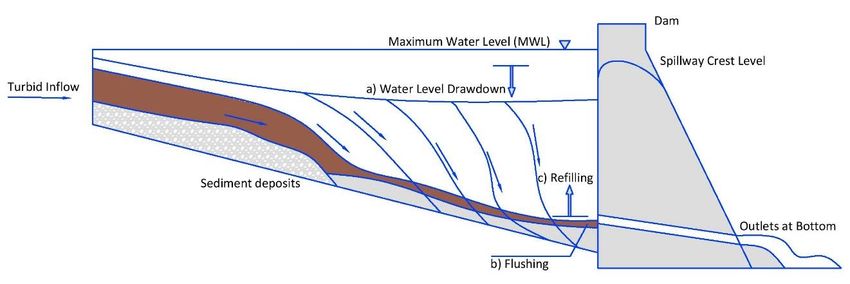
Water New Zealand Modelling Symposium
                     11 – 12 March 2020, Grand Mercure Hotel, Rangitoto Room, Auckland

                                                 PROGRAMME

Day Two – Thursday 12 March

 8.30-9.00am       Tea and Coffee – Foyer
 9.00am            Day 2 Opening comments – Nadia Nitsche, Chair, Modelling Group
 9.05am            Keynote Address – Bertrand Salmi – Water Technology – Banyule Swamp, my neighbour, will
                   you give me a glass of water?
 9.45am            Word from one of our sponsors – JEFF BOOTH
 10.00am           Morning Tea – Foyer
 10.30am           Workshop – Andrew Pollard (BRANZ) and Lesley Smith (Water New Zealand) – Advancing
                   models of residential water-use
 12pm              Complexity in Modelling – Ben Davies – Stantec
 12.30pm           Lunch – Vue Restaurant, Level 13 Grand Mercure
 1.15pm            Modelling Group AGM
 1.30pm            The use of Dynamic Freeboard – Kristin Stokes – Jacobs
 2.00pm            Use of detailed flood models for options analysis – Ivan Kholodov – Wellington Water
 2.30pm            Runoff estimation for an ungauged catchment – the Piha flood hazard modelling – Kevin Fan –
                   Auckland Council
 3.00pm            Afternoon Tea – Foyer
 3.30pm            Word from one of our sponsors – DHI
 3.45pm            Modelling long-term volume retention in a reuse rainwater tank – Jahangir Islam – AECOM New
                   Zealand
 4.15pm            Development and assessment of a reservoir sediment management routine for the soil and
                   wate assessment tool – Jayandra Shrestha – Canterbury University
 4.45pm            Detailed 2D Modelling for Puhoi – Tests on model parameters and software – Jorge Astudillo,
                   Link Zhao – Ewaters New Zealand
 5.15pm            Symposium Closed
Water New Zealand Modelling Group Symposium
      11 – 12 March 2020, Grand Mercure Hotel, Auckland

                         ATTENDEES
      ATTENDEE              COMPANY

      Abdulraman Bah        MAFFS
      Andrew Sherson        Stantec New Zealand
      Ben Davies            Stantec New Zealand
      Bertrand Salmi        Water Technology Pty Ltd
      Bill Syme             BMT Global
      Brendon Schicker      WSP New Zealand
      Brian Robinson        Hydraulic Analysis Ltd
      Britta Jensen         Hydraulic Analysis Ltd
      Catherine Dagan       Hydraulic Analysis Ltd
      Cheryl Bai            Auckland Council
      Courtenay Giles       WSP New Zealand
      Elliot Egan           Hydraulic Analysis Ltd
      Emma Rudge            Riley Consultants Ltd
      Eng Lim               Palmerston North City Council
      Fatima Bashir         DHI Water & Environment Ltd
      Gareth Lynch          Riley Consultants Ltd
      Girija Mulay          Stantec New Zealand
      Habib Ahsan           Riley Consultants Ltd
      Hansol Lee            Auckland Council
Water New Zealand Modelling Group Symposium
      11 – 12 March 2020, Grand Mercure Hotel, Auckland

                            ATTENDEES
      ATTENDEE               COMPANY
      Ivan Kholodov          Wellington Water ltd
      Jackie Zhou            Auckland Council
      Jahangir Islam         AECOM New Zealand Ltd
      James Mogridge         Tonkin + Taylor
      Jasmine Kang           Tonkin + Taylor
      Jayandra Shrestha      University of Canterbury
      Jeff Booth             Jeff Booth Consulting
      Jennyl Estil           Aurecon
      Joong Lee              Hamilton City Council
      Jorge Astudillo        Ewaters NZ
      Kelsey Beckett         Tonkin + Taylor
      Kerrie Ann Kirkwood    DHI Water & Environment Ltd
      Kevin Fan              Auckland Council
      Kirsten Henden         Awa Environmental
      Kristin Stokes         Jacobs New Zealand Ltd
      Link Zhao              Ewaters NZ
      Mark Burch             Activated Carbon NZ Ltd
      Martin Young           SUEZ Australia & New Zealand
      Michelle Mak           Hydraulic Analysis Ltd
      Nadia Nitsche          Wellington Water Ltd
      Nick Caulton           GHD Ltd
      Rebecca Ellmers        Hydraulic Analysis Ltd
      Rene van Lierop        Hydraulic Analysis Ltd
      Richard Brunton        Tonkin + Taylor
Water New Zealand Modelling Group Symposium
      11 – 12 March 2020, Grand Mercure Hotel, Auckland

                               ATTENDEES

      ATTENDEE                  COMPANY
      Saurav Suniara            Horowhenua District Council
      Suyash Joshi              Stantec New Zealand
      Sarah Basheer             Tonkin + Taylor
      Thomas Jamieson-Lucy      Riely Consultants Ltd
      Katrina Guy               Water New Zealand
      Renee Butler              Water New Zealand
      Lesley Smith              Water New Zealand
      Ciline Cattoen-Gilbert    NIWA
      Andrew Pollard            BRANZ
Water New Zealand Modelling Symposium
11 – 12 March 2020, Grand Mercure Hotel, Auckland

             Abstracts

  A very special thank you to our 2020 Sponsors
Wednesday 11 March
1. The Future of 2D hydraulic Modelling: Presentation of new sub-grid turbulence and elevation sampling
approaches and impact on result accuracy – Bill Syme – BMT Global
• Wednesday 11 March @ 10.45am
2. Bridging the gap between Modellers and Decision Makers – Fatima Bashir – DHI
• Wednesday 11 March @ 11.15am
3. HEC-RAS Modelling: using 1D and 2D models to model bridges with rapidly changing design process – Courtenay
Giles – WSP
• Wednesday 11 March @ 11.45am
4. Three-way coupled stormwater model – Girija Mulay – Stantec
• Wednesday 11 March @ 1.00pm
5. Development of a city-wide drainage model to assess system performance – Bertrand Salmi – Water Technology
• Wednesday 11 March @ 1.30pm
6. Modelling in infrastructure investment for Sulpher Beach – Hansol Lee & Jackie Lee – Auckland Council
• Wednesday 11 March @ 2.00pm
7. Making models work; small investments, big rewards – Brendon Schicker – WSP
• Wednesday 11 March @ 2.30pm
Thursday 12 March
8. Banyule Swamp, my neighbour, will you give me a glass of water? Bertrand Salmi – Water Technology
• Thursday 12 March @ 9.05am
9. Complexity in Modelling – Ben Davies – Stantec
• Thursday 12 March @ 12.00pm
10. The use of Dynamic Freeboard – Kristin Stokes – Jacobs
• Thursday 12 March @ 1.30pm
11. Runoff estimation for an ungauged catchment – the Piha flood hazard modelling – Kevin Fan – Auckland Council
• Thursday 12 March @ 2.30pm
12. Modelling long-term volume retention in a reuse rainwater tank – Jahangir Islam – AECOM New Zealand
• Thursday 12 March @ 3.45pm
13. Development and assessment of a reservoir sediment management routine for the soil and water assessment
tool – Jayandra Shrestha – Canterbury University
• Thursday 12 March @ 4.15pm
14. Detailed 2D Modelling for Puhoi – Tests on model parameters and software – Jorge Astudillo, Zhao Link –
Ewaters New Zealand
• Thursday 12 March @ 4.45pm1. The Future of 2D Hydraulic Modelling: Presentation of New Sub-Grid Turbulence and Elevation Sampling Approaches and Impact on Result Accuracy Bill Syme1 (Presenter), Dr Greg Collecutt1 1BMT Two major enhancements in 2D hydraulic modelling that will change industry practices are presented in a non- technical manner through benchmark tests and real-world applications. Mesh-Size Insensitive 2D Turbulence Solution Turbulence within rivers plays a significant role in determining the mean flow velocity field and is integral to the overall energy loss mechanism. Unlike floodplains where depths are low and bed friction high, head-loss predictions for rivers can be sensitive to the treatment of turbulent eddy viscosity. With the continued advance of computational hardware, rivers are now frequently modelled in 2D using the depth averaged Navier-Stokes equations also known as the Shallow Water Equations (SWE). With this trend, some treatments of turbulent eddy viscosity can lead to mesh size result dependency and significant errors in the prediction of inundation levels on the surrounding floodplains. The representation of sub-grid-scale turbulence (often referred to as eddy viscosity) has been an increasingly concerning issue as 2D element sizes become smaller and smaller. The traditional Smagorinsky and Constant eddy viscosity approaches can be highly dependent on element size and worse yet fail when the 2D element resolution is reduced less than the water depth. 2D solvers are increasingly being asked to model at smaller and smaller element sizes. Because of this, and importantly for models with varying element size (flexible meshes and quadtree grids), a mesh-size insensitive sub-grid-scale turbulence approach is needed. The benchmarking of a new approach is presented that allows modellers to vary cell size downwards across a grid or mesh without loss of accuracy. As a result, engineers and scientists can now confidently model at all scales using the same turbulence parameters. Sub-Grid Elevation Sampling 2D SWE solvers typically store one elevation for the cell’s storage and sometimes one elevation for each cell face. Investigations were made into enhancing the definition of a 2D cell’s ground elevation data using a sub- grid elevation sampling method to better capture and use topography data at a finer scale than the mesh resolution. Benchmarking has identified many benefits associated with the sub-grid elevation sampling approach. Sub-cell low flow paths are better represented, significantly improving the performance of whole of catchment direct rainfall 2D models. Also, disturbed flow fields and spurious additional head losses that can traditionally occur along a “saw-tooth” regular grid wet-dry boundary completely disappear. Results show that a deep-sided
channel (such as a concrete lined stormwater drain) can now be accurately modelled using a coarse regular
grid of any orientation with as few as one or two 2D cells covering the width of the drain. This finding
potentially removes the need to model these channels in 1D or having to construct a time-consuming well-
designed flexible mesh along the channel.
Summary
The ability to use a variable cell-size regular grid mesh with a cell size insensitive turbulence scheme,
combined with sub-grid elevation sampling are presented. Collectively these major modelling enhancements
result in significant accuracy improvements proving to be the next major advancement in 2D hydraulic
modelling and potentially redefining industry practices.
NOTES:
2. Bridging the gap between modellers and decision makers
Fatima Bashir – DHI Group

Hydraulic models have been used as efficient analytical and decision-making tools for several decades. If
utilised well, they can be effective management tools, especially for urban networks. However, in most
utilities there is a clear disparity between those using the models and decision makers, resulting in models not
being fully utilised by stakeholders i.e. planners, managers, operation staff and field personnel.
What are the issues?
Traditional hydraulic modelling is a specialized skill requiring significant investment in terms of time and
money. Therefore, most water utilities rely on modelling experts (often external consultants) to provide
operational assessments of their urban networks. For long term planning and scenario assessments the flow
of information between those with the modelling and software knowledge to those who make decisions
works well. However, the knowledge is generally retained only by the specific people involved in the study
with associated reports and maps then buried in a pile of electronic data.
Decisions that require specific information quickly are often not able to take advantage of information from
modelling studies. Therefore, there is a general need in the industry for different types of decision makers to
quickly and easily access simple modelling related information without requiring technical modelling
knowledge.
How do we bridge the gap?
To address these needs, there are several user-friendly web applications and decision support systems, which
allow water utilities to access relevant information to make faster and more informed decisions, radically
improving the way they manage their daily operations and long-term plans. There is no need to install
specialized software, information can be collated and targeted to specific needs and is easily accessible.
Examples of how some applications are used to bridge the gap and utilize hydraulic models and the
information collected to its maximum capabilities are presented including:

       •   WaterNet Advisor – An online application accessible from any electronic device, accesses complex
           modelling information while presenting it in a targeted easy to use manner, getting immediate
           answers. The application is aimed at field operators, planners and decision makers to access
           information and run scenarios to understand their system behavior.

       •   Future City Flows (FCF) – An innovative online solution for city planners, wastewater operators and
           decision makers to reduce flooding, discharge of untreated WW into the environment and
           wastewater treatment plant costs. It is an information and decision support system that is
applicable in small and large cities and provides an effective tool for both short-term system optimization and long-term prevention. The system works by collecting real time data, running scenario modelling to strategically plan for long term preventions, using cost v.s. benefits analysis. FCF been tested in water utilities in Sweden with the largest being the city of Gothenburg, where FCF is currently being implemented in Real time mode to control and optimize the network in a sustainable manner. Pilot projects are currently in place in NZ and Australia.
NOTES:
3. HEC-RAS Modelling: Using 1D and 2D models to model bridges with rapidly changing design processes
Courtenay Giles – WSP

Large roading projects often have an impact on rivers and streams. In order to assess the scale of these
impacts hydraulic models are built. Due to the diverse requirements of these projects often one model is not
sufficient for answering all of the design and consenting questions, however it is not efficient to have multiple
models to interrogate in short timeframes. This presentation will summarise the investigations to choose a
suitable streamlined process, comparing one-dimensional (1D) and two-dimensional (2D) approaches, and
providing confidence in the results without excess analysis in short timeframes.
It is well known that different modelling approaches are better suited to answering the different complex
hydraulic and flood risk questions. The initial questions in this project focused on design levels which later
switched to flood hazard and potential scour. Other considerations were runtime and ease of model
manipulation for rapidly changing designs.
A 1D HEC-RAS model of a stream was built to assess the impact building a bridge would have on the water
depths in the channel. This model was based off a series of cross-sections derived from LiDAR data and the
proposed bridge was added into the model using the bridge feature in HEC-RAS.
Knowing the 1D model would likely not provide enough detail of the flood hazard in the floodplain and
address future consent requirements a 2D HEC-RAS model was also built. The terrain was manipulated to
include the bridge alignment based off design drawings in the 2D model.
The models were run with the same design flows and the results were compared to see if altering the type of
model resulted in significant changes to the results obtained. The 2D model provides a better representation
of the flood extent that is likely to occur in the flood plain as the 1D model only shows flooding results to the
extent of the cross-sections and no further. Terrain manipulation allowed for a more representative bridge as
the abutment shape and embankments could also be included. While actual levels varied, the differences in
water level were comparable and roughly followed the same trend for both models.
The 1D model only returns a water level for each cross-section in the model, so these results were less
detailed. However overall, the ease with which a 1D model can be made and the significantly faster running
time make this a more appealing method of testing multiple options or changing design throughout the
process. Having recognised the requirement for a 2D model early in the process meant that the final preferred
designs could be then added to the 2D model easily to confirm consent requirements and provide additional
detail for the areas that mattered such as velocity close to piers and abutments. It is impossible to have the
perfect model, but this presentation will cover the benefits and challenges of both models and how to pick the
right modelling approach based on the project.
Figure 1: 1D model results for 100-year ARI
Figure 2: 2D model results for 100-year ARI
NOTES:
4. Three-Way Coupled Stormwater Model
Girija Mulay

Councils across New Zealand are seeking a better understanding of their three waters networks, to enable them
to make the best use of their existing assets, and plan for growth and changing environments and develop
operational maintenance strategies. Stantec is currently working on several projects to assist councils achieve
their strategic aims.
This paper will focus on three-way coupled stormwater model build projects in DHI Mike Flood. The objective
of these projects includes the development of stormwater network models, validation, and the use of them to
generate flood hazard maps. These models are a valuable tool but notoriously complex due to varied catchment
hydrology and hydraulic conditions.
We will also review the key challenges of this process and discuss some of the methodologies and innovations
Stantec utilised to streamline the processes, and the lessons learnt along the way. Whilst this paper will be
discussing DHI Mike Flood, some of the lessons learned, and innovations, can be applied to a range of modelling
projects. It will review how other software packages, such as ArcMap, QGIS and FEM, and non-modelling skill
sets, can be utilised to support the modelling process.
NOTES:
5. Development of a City-wide Drainage Model to Assess System Performance
Bertrand Salmi, Celine Marchenay, Water Technology

Melbourne Water (MW) is currently developing system performance assessment tools for their water, sewer
and drainage networks, to enable the completion of a system wide assessment of performance and assist
integrated water planning. With the existence of InfoWorks models for both the potable and sewer networks
built and regularly calibrated over the last decade, MW is aiming to fill in the gaps by developing a one-
dimension (1D) drainage network model in InfoWorks (Innovyze) of the Melbourne metropolitan area and
urban growth.
This project is the first stone to building a living drainage network model to be updated, calibrated over time
and used to assess the performance of the system under current and future scenarios. The first lot of priority
catchments modelled and preliminary assessed over a range of scenarios included the Patterson River, Elster
Creek, Mordialloc Creek, Kananook Creek and the Mornington peninsula. The 1D drainage model includes all
the MW underground drainage trunk mains, open drains, natural waterways and retarding basins within the
catchment extent. It was run for the 5-year ARI design events using the Australian Rainfall and Runoff 1987
including spatial variability in order to identify the deficiencies in the network which is supposed to be design
for and carry the 5-year ARI design storm. The model was verified against the MW 5-year ARI design flow
values available from previous flood studies throughout the catchment. The existing conditions system
performance was then assessed and presented in the form of thematic maps of pipe surcharges and maximum
flow against pipe full capacity based on the Manning’s equation. The existing conditions system performance
assessment revealed specific hotspots where the drainage network is surcharged causing or not overland
flooding (extent not assessed in this study) under the 5-year ARI. The 1D drainage model was assessed over a
range future scenarios including climate change and increase in population in line with the Victoria in Future 6
million (2031), 8 million (2051) and 10 million (2061) predictions to assess the needs for future infrastructure
upgrade.
NOTES:
6. Modelling in Infrastructure Investment for Sulphur Beach
Hansol Lee (Auckland Council), Jackie Zhou (Auckland Council)
Sulphur Beach is a low-lying area within the Waiurutoa Stormwater Catchment, located at Northcote Point, on
the northern side of the Harbour Bridge in Auckland. The area is bounded by Belle Vue Avenue to the North,
State Highway 1 to the East, and Richmond Avenue to the West covering about 50 hectares and 290
properties. The edges of Sulphur Beach was developed prior to the reclamation of the Sulphur Beach
foreshore for the Northern Motorway (State Highway 1). The Sulphur Beach area experiences both pluvial
flooding as well as coastal inundation from the Waitemata Harbour during extremely high tides or a tidal surge
in conjunction with moderately high tides. Approximately 24 habitable buildings are predicted to flood in the
100 year ARI storm event under Maximum Probable Development (MPD) with Climate Change (CC) scenario
and 2 properties are subject to regular coastal inundation at least 3-4 time per year without wave effects. Both
pluvial flooding and coastal inundation are expected to worsen with the effects of climate change.
Since 2009, a series of studies have been conducted to predict the flood risks and to develop possible flood
mitigation options for Sulphur Beach. Modelling has always been a significant component in each of the
studies; the first catchment model was completed in 2009 using MOUSE software (version 2005), the next
model in 2012 using Mike Urban (Version 2011) and the latest model built in 2016 using Infoworks ICM
(Version 7.5). The models have progressed from an all 1D model to a fully coupled 1D-2D model.
This presentation focuses on how the introduction of modelling and evolvement of modelling methodologies
has helped catchment planning and infrastructure investment decision making in Sulphur Beach. Different
types of models over the years and how each model has provided value at the time will be discussed in the
presentation. The limitations of each model in each stage will be also discussed.
The presentation also focuses on how the latest 1D-2D coupled model was utilised to incorporate sufficient
detail that allows prediction of flood risks and effects of infrastructure upgrades more reliably compared to
previous models. By doing complex modelling and scenarios tests on various tidal boundary and rainfall (joint
probability approach), the issues and project benefits were quantified to support a solid business case that it
will protect the local community as well as meet the best interest of wider communities and rate payers.
Lastly the presentation outlines the implemented physical work at Sulphur Beach to mitigate coastal
inundation based on the modelling study, currently performing to be effective. Further modelling works are
currently underway for the mitigation of pluvial flooding.
NOTES:
7. MAKING MODELS WORK: SMALL INVESTMENTS, BIG REWARDS
B. Schicker, M. Groves, C. Mills and L. Foster (WSP)
Increased computing power has resulted in computer models able to analyze large and complex networks in
more ways than ever before. This has enabled better understanding of the constraints and issues present in
the system, trialing multiple options and quantifying their effects, and prioritizing capital and operational
investment.
Many councils throughout New Zealand have or are in the process of developing their own models for their
three waters networks. This provides significant opportunity for making the most out of the available funding
for projects that can effectively capitalize on these models. Some projects are clear candidates for this, such as
planned capital works, as well as others which are less obvious; for example, temporary works design.
The ability to influence the cost of a project is highest in the earliest stages of a project. To optimize efficient
investment of available funding, models need to be incorporated in the planning and conceptual design stage
and updated with appropriate data as the project progresses. Investing in good quality data, such as level
surveys and flow monitoring, to increase confidence should be considered by their potential benefits. This can
highlight whether the project needs to proceed, if the scope can be reduced, or if the current scope is
insufficient.
Use of a model allows increased certainty that the proposed solution is resolving the correct problem, or if
there are other factors or constraints present that have not been accounted for and need to be addressed.
Valuing the model as a central decision-making tool ensures that the model is used frequently and effectively
and does not sit idle on a metaphorical shelf for years never achieving its full potential.
The presentation covers both stormwater and wastewater projects that WSP have undertaken where the
model (sometimes existing) has been used to provide the client with a significant return on their initial
investment. In many of the examples, some of which would not be immediately obvious, the benefits realized
from the model more than offset the outlay of developing the model in a single project. This presentation
aims to highlight the ways in which models can be effective tools to efficiently prioritize available funding
streams, especially when they form a small investment cost relative to the intended capital works they will
support.
NOTES:
8. Banyule Swamp, my neighbour, will you give me a glass of water?
Bertrand Salmi, Water Technology

The Banyule Billabong has been identified as one of the priority billabongs within the Yarra catchment
currently suffering the impacts from flow regulation, urbanization and changing climate. Previous studies
concluded that the frequency and duration of inundation is insufficient to protect the billabong ecological
health, prompting Melbourne Water and Banyule City Council to conduct a successful watering trial in 2016
with help from Victorian Environmental Water Holder. Water was pumped from the Yarra River into the
billabong to protect its marsh and meadow zones.
Council and Melbourne Water are now looking to develop a long-term solution. Previous studies identified
that excess water from Banyule Swamp – located north of the billabong – may be re-directed towards Banyule
Billabong, to allow more frequent inundations of the billabong. The main concerns around this option are
centred around timing of the water delivery, potential impact on Banyule Swamp and quality of the water,
which may be high in nutrients.
The aim of this study is to understand possible interaction between existing water regime, water quality and
vegetation in the Banyule Swamp to develop a long-term solution to both improve the ecological health of the
Banyule Billabong and encourage wader habitat in Banyule Swamp, as Lathams Snipe visits the site. A
monitoring program was thus invited to gain understanding of the water quality and level fluctuations in
Banyule Swamp.
Preliminary catchment analysis identified the main sources of water to the Swamp and bathymetric
characteristics of the Swamp. The results suggest that levels may fluctuate significantly during prolonged
drought period. This will need to be considered when considering Banyule Swamp as a potential source of
water for Banyule Billabong.
Hydraulic modelling was undertaken to identify key overland flow paths and estimate the trigger pints above
which Banyule Swamp received overland flows from adjacent creeks. This ultimately informed the water
balance analysis – validated against data from the monitoring program – used to understand the hydrological
regime of Banyule Swamp and its suitability as a back-up source of Banyule Billabong.
NOTES:
9. COMPLEXITY IN MODELLING
Ben Davies, Stantec New Zealand

More and more these days, we find that the wealth of data becoming available is overwhelming. Big data is
here, and we are encouraged at every turn to make use of every byte.
But there is a balance between model accuracy and model complexity. Although an accurate model is good,
the law of unintended consequences warns that an intervention in a complex system tends to create
unanticipated and often undesirable outcomes.
Modelling depends on data, but more importantly it depends on assumptions. You can add data to make the
model a more accurate representation of the actual system, but every time we do this, we need to make
assumptions about the new data. And every new assumption is a chink in the armour, a hole where a fatal
error can creep in.
An example is property data – there are more and more accurate data sets across entire cities on buildings,
(floor area, number of floors, number of bedrooms) and how the property is used (not just domestic or
commercial, now we see if it is healthcare, fast fee, offices).
In water supply modelling, this data can be used to add detail into the model. We can provide demand
breakdowns by customer type, set up different domestic demands based on number of bedrooms in each
house, apply commercial patters based on the type of business…we can do this and more.
But there are assumptions in every one of these details. E.g., we might assume every office building uses
water between 8am and 6pm only. Or we might assume people in a 5-bed house use as much water per
person as people in a 3-bed house. Or we might assume they use less. Either way, we must make an
assumption.
Often there is no way to test these assumptions. In water networks, the only test we really have for anything
is calibration, and over and over when we add this type of sophisticated detail into a model, we usually find
three things:

   •   The assumptions often result in a conflict with field data.
   •   The complexity of the model is increased to the point where obvious errors can be harder to recognise.
   •   When we finally find a way to shoehorn the assumptions into the model, we find they make absolutely
       no difference to the calibration.
Water networks are invisible. The only evidence we really have that anything is correct is calibration and
complicating our models with additional details with little to no evidence is a recipe for disaster.
In this paper will outline other examples we have found of detrimental complexity and set out some rules of thumb which I have fund useful to decide where we should draw the line between accuracy and complexity in our models.
NOTES:
10. THE USE OF DYNAMIC FREEBOARD
Kristin Stokes (Jacobs NZ Ltd), Ben Fountain, Nadia Nitsche (Wellington Water)
Flood maps are developed for a range of uses, including high-level hazard identification, catchment planning,
infrastructure planning and District Plan hazards management.
Hazards, such as blocked culverts, sediment build up and wave generation that are known to occur during a
flood are difficult to include in the base design models that determine the Flood Maps. It is important in the
management of flood risks that these hazards are also represented in the maps. The application of freeboard
is added to the maps to cover such hazards. Often when these additional hazards are not understood, a
standard 500mm is added to the final flood maps as per the Building Code.
In the recent flood mapping programme that Wellington Water are undertaking, a better understanding of the
freeboard was preferred. In order to quantify some of the additional hazards to flooding, sensitivity runs were
carried out using the verified hydraulic models. The sensitivity runs varied depending on the catchment but
typically include testing the sensitivity of the model results to inlet blockages, culvert blockages, variation in
the design rainfall event, increased roughness or altered tailwater/sea level assumptions. The results of the
sensitivity runs are used to determine the appropriate freeboard depths to represent the additional hazard.
Once the depths were understood – a dynamic freeboard model run was undertaken to determine the final
flood hazard depth. Dynamic freeboard uses the maximum depth plus the adopted freeboard as an initial
condition for the dynamic freeboard run. The model is run for a short time period, typically 5 minutes, and the
maximum depth results from the run provide the final flood hazard depth layer used for recommended
building levels. A process was developed which included GIS processing to dissolve adjacent elements with the
same initial condition water level. This processing reduced the total number of initial condition polygons while
ensuring there are no ‘donut’ or multipart features. The process also included modifying the hydraulic model
to remove 1D elements as a 2D simulation was found to be more stable and produced consistent and reliable
results across a range of models.
This paper discusses the methodology used to determine the dynamic freeboard applied. The method is based
on assessing the sensitivity of modelled flood depths to incidents such as inlet blockage that are likely to occur
in a particular flood but the locations and magnitudes of these occurrences will vary with each event.
NOTES:
11. Use of detailed flood models for options analysis
Ivan Kholodov – Wellington Water

Large flooding events causing socially unacceptable loss and damage to private and public spaces appear to
become a regular occurrence. This, as well as greater public awareness about climate change effect of
exacerbating flood risks, puts pressure on regional and district authorities to better understand and manage
these risks.
Wellington Region due to its unique location and terrain is one of the most exposed regions of New Zealand to
floods. The impact of flooding becomes more prominent as the region has experienced particularly repaid
economic and housing developments over the last decade. Furthermore, several low laying residential areas
are exposed to the additional risk of sea level rise.
In the past, the provision of drainage to manage runoff was fragmented and provided to meet the needs of
individual parcels of land development. The new approach for providing of drainage infrastructure is to
consider catchments holistically where problem areas across the region identified and prioritized and
appropriate solutions to address highest priority problems are selected.
To meet these challenges, Wellington Water Ltd (WWL) on behalf of its stakeholder councils is working on a
programme to model flooding in all urban areas within Wellington region. To adequately represent flood risks
at individual property level and overland flowpaths, WWL decided to model with a very detailed mesh and
incorporate all network components including sumps. Such high detail makes simulation runs very long.
While for flood mapping long simulation runs are not a problem as flood mapping is not done on regular basis,
for master planning and optioneering purposes, long runs pose significant challenge in terms of programme
delivery and project budgets.
The challenge for WWL is how to use detailed models in an efficient way for planning purposes without
impacting the programme. Author’s previous experience in using water supply and wastewater models to do
optioneering and master planning by running multiple iterations to arrive at optimal result, appear to be
inappropriate for the highly detailed stormwater models due to simulation time requirements making a purely
iterative approach impractical. In order to provide better efficiency without compromising the detail, several
methods were trialed to optimize the optioneering process.
Presented in this paper are the methods trialled to optimize the use of WWL detailed flood models so that
useful, high level data, informing infrastructure capacity and priority requirements, is obtained within practical
period.
NOTES:
12. Runoff Estimation for An Ungauged Catchment – The Piha Flood Hazard Modelling
Kevin Fan (Auckland Council), Nick Brown (Auckland Council)

In February 2018, Piha has experienced torrential rain and significant flooding, leaving the local community
devastated and gaining heavy political attention. In response to the rain event, Auckland Council has since out
detailed flood investigation and remedial optioneering studies to develop a better flood management system
for Piha. Flood hazard modelling has played a vital role as part of the investigation to better understand the
flooding risks and testing potential remedial options.
Given the catchment characteristics and how flooding has progressed and affected Piha, it was initially
thought that a 2D model with high mesh resolution was best suited to replicate the event. However, as the
Piha Stream Catchment had no long-term flow gauge, it is challenging to prove that the estimations of runoff
volume are accurate. In order to gain confidence in the flood model and in the best interest of Auckland
Council, various method has been tested for estimating runoff volume and flows. This presentation will focus
on describing the various methods used for estimating runoff volume and their effects on the ungauged Piha
Stream Catchment.
The techniques are demonstrated by using different modelling methods (direct rainfall method vs traditional
modelling techniques); different spatial and seasonal variations of curve number (CN); different sub
catchment loading methods to assess the effects of peak flows, volumes and lag times and then compared
with the known flooding records.
The study demonstrated how modelling methodology and the selection of hydrological parameters affects the
results. The study has also revealed potential seasonal variations in the catchment and discovered how runoff
is sensitive to some parameters that may otherwise be overlooked.
Some finding of this study were found interesting and unique compared to other catchments in the Auckland
Region. For example, the modelled peak flow rates were found significantly higher than results from TP108
graphical method in Piha, due to its distinctive catchment topographical characteristics.
NOTES:
13. MODELLING LONG-TERM VOLUME RETENTION IN A REUSE RAINWATER TANK
Jahangir Islam (AECOM New Zealand)

Auckland faces significant regional conveyance and treatment capacity issues and the extent of combined
sewer overflows (CSOs) from the city’s combined sewer system. Rainwater reuse tanks could be effective in
reducing CSO’s by rerouting stormwater currently directly entering the combined sewer network. The use of
domestic rainwater tanks in urban areas could provide considerable reductions in potable mains water
demand and roof stormwater runoff.
The use of reuse rainwater tanks for the supply of non-potable water in urban areas was found to have two
substantial water saving benefits. First, when rainwater tank is used for toilet flushing, laundry and outdoor
water uses, tank water is constantly being drawn down. As a result most of roof runoff from small storm
events is captured by the tank which results in considerable reductions in stormwater runoff. Second, as toilet
flushing, laundry and outdoor water are sourced from the rainwater tank, the mains water demand and CSO’s
can be considerably reduced. The uptake of rainwater tanks for non-potable uses provides resilience to the
overall domestic water supply system and could offset new water sources being required thus offsetting
capital investment.
A continuous simulation modelling investigation has been carried out to undertake a quantitative
performance assessment of rainwater tanks in terms of reductions in frequency, magnitude, and volume of
runoff flows downstream resulting in reduced stormwater runoff, reduced volume placed upon CSOs and
potable mains water volume savings. The model results provide relationships between the roof runoff peak
flow and volume reductions, roof areas and rainwater tank sizes.
MIKE URBAN modelling software was used for the continuous simulation modelling investigation. The MOUSE
Model B (Kinematic Wave approach) hydrological model was used to generate continuous stormwater flows
from the impervious roof surfaces using 10 years of continuous 5-minute interval rainfall data from the Wairau
rainfall gauge.
Typical domestic rainwater tanks in urban residential areas with sizes ranging from 2000 to 4000 litres were
used for continuous simulation modelling investigation. Typical urban household roof areas ranging from 100
to 200 m2 connected to the rainwater tanks were considered to capture roof runoff by the tank for non-
potable water use i.e. toilet flushing, laundry and outdoor uses.
Long-term continuous simulation modelling demonstrates that the use of reuse rainwater tanks for the supply
of non-potable water in urban areas has been found to be effective at controlling frequent small storm flows
and could provide substantial mains water saving benefits and reduced CSO operation in combined
stormwater drainage areas. This analysis provides annual average roof runoff and potable water volume
reduction due to use of reuse rainwater tanks for a typical household.
Further modelling investigations would be undertaken on a catchment wide in order to quantify better
performance assessment of reuse rainwater tanks which then could provide a basis for designing rainwater
tank devices to meet targeted reductions in mains water demand, CSOs and stormwater runoff to achieve
improved ecological outcomes in freshwater and receiving water systems.
NOTES:
14. Development and assessment of a reservoir sediment management routine (ResSMan) for the Soil and
    Water Assessment Tool (SWAT)
Shrestha, J.P., Pahlow, M., Cochrane, T.A.,
University of Canterbury

Aims
Sedimentation causes the reduction of significant storage volume of a reservoir, loss of hydropower generation
and downstream impacts. The impacts of climate change and land use change on runoff and sediment yield will
further affect the sediment deposition in reservoirs and hydropower generation. Therefore, a single simulation
model with capabilities to simulate hydrological processes, sediment management techniques and hydropower
production at a river basin level is needed. Thus, the main objectives of this study is to develop a full Reservoir
Sediment Management routine (ResSMan) integrated into the physically based Soil and Water Assessment Tool
(SWAT) (Arnold et al., 1998).
Method
The ResSMan routine replaces the existing simplified reservoir routine of the SWAT model. The new routine has
capabilities to predict the accumulation of trapped sediment, its impacts on the storage capacity of a reservoir,
and hydropower generation under user-specified operation policies. Furthermore, it allows for simulating the
removal of sediment by flushing (by passing water and sediment through flush gates located at the low level of
a dam) and sluicing (passing sediment before suspended sediment solids settle in the reservoir). The process of
flushing in the ResSMan routine comprises three phases: drawdown of water surface level, removal of sediment
by flushing through gates at the base of the dam, and refilling the reservoir (Figure 1).

Figure 3: Flushing process to remove reservoir sediment deposits (a) water level drawdown, (b) flushing, (c) refilling reservoir.
The routine assumes that sediment deposits uniformly within the reservoir cross section and that deposited
sediment can be removed only when the flushing channel attains its long term capacity ratio (LTCR). LTCR is the
ratio of the storage capacity of a reservoir that can be sustained due to flushing in the long term, to the original
capacity of a reservoir. Similarly, the drawdown for sluicing initiates either on the user-specified initiation date
of drawdown, or when the criterion of minimum reservoir inflow is met. Once the drawdown is started, the
routine will try to achieve and keep the reservoir water level at target sluicing level, thereby releasing water
through the low level outlets. Hence, opening the low level gates during sluicing allows the sediment-laden flood
to pass at high velocity, and closing the gates refills the reservoir after sluicing. The user inputs required for the
routine are i) volume-area-elevation curve, ii) hydropower plant characteristics like maximum/minimum
operating level, tailwater level, plant efficiency, design flow of a plant and installed capacity, iii) rule curves, iv)
outlet capacity curves, v) flushing specification data and vi) sluicing specification data.
A case study application of the ResSMan routine was carried out for the Nam Kong 3 reservoir with a catchment
area of 646 km2, situated in the Sekong River basin in Lao PDR. The simulation of flushing and sluicing was carried
yearly for specified dates from 2000 to 2005. The SedSim model, (Wild & Loucks, 2012) a one-dimensional
deterministic daily time step simulation model to simulate flow, sediment, hydropower production and various
reservoir sediment management techniques (Wild et al., 2015), was used to evaluate of the performance of the
developed routine.
Results
The performance of the ResSMan routine was assessed for the Nam Kong 3 case for the time period 2000-2005
by comparing with results obtained from the SedSim model. The ResSMan routine and SedSim model output
were closely correlated for sediment outflow for both flushing (Figure 2) and sluicing (Figure 3). The coefficient
of determination R2 was 0.99 in both cases.
10000
1000
Sediment outflow (Ton)
100
10
1
0.1
ResSMan Routine SedSim Model
0.01
1995 1996 1997 1998 1999 2000
Figure 2: Comparison of the ResSMan routine with the SedSim Model for sediment outflow from the reservoir due to flushing.1000
Sediment outflow (Ton)
100
10
1
0.1
ResSMan Routine SedSim Model
0.01
1995 1996 1997 1998 1999 2000
Figure 3: Comparison of the ResSMan routine with the SedSim Model for sediment outflow from the reservoir
due to sluicing.
The ResSMan SWAT routine will useful to assess and manage reservoir sedimentation under different climate
change and land use change scenarios.
References
Arnold, JG, Srinivasan, R, Muttiah, RS & Williams, JR 1998, 'Large area hydrologic modeling and assessment part
I: model development', JAWRA Journal of the American Water Resources Association, vol. 34, no. 1, pp.
73-89.
Wild, T & Loucks, D 2012, 'SedSim model: a simulation model for the preliminary screening of sediment transport
and management in river basins, version 3.0: documentation and users manual', Department of Civil and
Environmental Engineering, Cornell University, Ithaca, NY USA
Wild, TB, Loucks, DP, Annandale, GW & Kaini, P 2015, 'Maintaining sediment flows through hydropower dams
in the Mekong River Basin', Journal of Water Resources Planning and Management, vol. 142, no. 1, p.
05015004.NOTES:
15. Detailed 2D Modelling for Puhoi – Tests on Model Parameters and Software
Jorge Astudillo, Link Zhao (Ewaters New Zealand Limited)

Computer power, data capturing technology and modelling software continues to develop rapidly over the
years, enabling new ways of modelling that is often data hungry. Whilst it shapes positive changes to the
modelling industry, it also brings challenges when deciding what modelling tools to use and how to maximise
the use of data and computer power. Despite the exciting improvements and convincing visuals from the
latest technology, it is still important to be skeptical and ask how good the models really are.
Rain-on-cell type of models are proven to be an effective tool for rapid flood assessment, especially in rural
areas, for its simplicity and quick turn over time comparing to traditional models. The downside of these
models is that they are often too coarse for the accuracies required when describing local flood hazards.
However, the recent 2016 LiDAR data in the Auckland Region makes it possible to implement 2D models with
high mesh resolution that captures most relevant hydraulic features without significant manual inputs. This
allows faster model build and better details for larger rural watersheds where high resolution 2D flood
modelling of this scale wasn’t possible.
The presentation uses the Puhoi Catchment (58km2) in the Auckland Region as a case study, discussing how
improvements have been made to a 2D model, using a range of tools and processes. In addition to the
improvements made, confidence was gained in the model by performing a series of sensitivity analysis,
assessing various hydraulic and hydrological parameters. Aspects such the river roughness, tidal zone
features, low flow channel, mesh resolution, river storage, among others, have shown to be important for the
quality of the final model outputs.
The Puhoi Catchment has also been used to assess the performance of various modelling software, in the aim
of understanding potential software induced uncertainties. Tests were carried out using simplified but
realistic model parameters and an approach that considers rain-on-cell models with high 2D resolution, using
the same basic assumptions and data inputs.
The presentation will focus on the outputs and comparisons from various tests, and how each parameter,
approach or software affects the model results. At the end of the day, there will be inherent differences from
the various modelling approaches, from the numerical engines to the selection of parameters.
NOTES:
Water New Zealand Modelling Symposium
11 – 12 March 2020, Grand Mercure Hotel, Auckland

                    Bios

    A very special thanks to our 2020 sponsors
1. Dr Celine Catteon-Gilbert, NIWA 2. Bill Syme, BMT Global 3. Fatima Bashir, DHI 4. Courtenay Giles, WSP 5. Girija Mulay, Stantec 6. Bertrand Salmi, Water Technology 7. Hansol Lee, Auckland Council 8. Jackie Zhou, Auckland Council 9. Brendon Schicker, WSP 10. Ben Davies, Stantec 11. Kristin Stokes, Jacobs 12. Ivan Kholodov, Wellington Water 13. Kevin Fan, Auckland Council 14. Jahangir Islam, AECOM New Zealand 15. Jayandra Shrestha, Canterbury University 16. Jorge Astudillo, Ewaters New Zealand 17. Link Zhao, Ewaters New Zealand
Dr Celine Catteon-Gilbert, NIWA

Dr. Céline Cattoën-Gilbert will be presenting a keynote address for the Water New Zealand Modelling Group Symposium
on shaping a nationwide approach for river flow and flood forecasting. Céline is a hydrological forecasting scientist at
NIWA, a principal investigator of a 2017 Natural Hazards Research Platform fund for “Enhanced probabilistic flood
forecasting”, and since 2016, the leader of “forecasting floods and hazards”, a NIWA strategic science investment fund.
In 2017, she obtained a NIWA Excellence Awards for Early Career Science runner-up. Céline leads a team of forecasters,
hydrological modellers, research software engineers and GIS specialists in developing a flow forecasting model for New
Zealand. With an engineering degree in applied mathematics, Ph.D. in theoretical physics and experience as a High-
Performance Computing support consultant (NeSI) before joining NIWA, she has a passion and a drive for
interdisciplinary research. She enjoys developing an active role in the international ensemble flow forecasting research
community by getting involved in science and session committees at international conferences.

Céline is delighted to present her and her team’s exciting work on the NZ river flow forecast research project producing
an hourly forecast for the next 48 hours, for nearly 60,000 rivers across New Zealand1. She will discuss advances and
challenges in water forecasting from global to local scales, from quantifying uncertainties using ensembles to forecast
communication for decision-making.

1
    https://niwa.co.nz/climate/research-projects/river-flow-forecasting
Bill Syme, BMT Global Bill has 35 years’ experience working on riverine, estuarine and coastal studies, of which most have been in the flood hydraulics field. During this time, he has successfully managed and led a wide range of flood and flood risk management studies in Australia and overseas. The widely used TUFLOW hydrodynamic modelling software was developed by Bill starting in 1989. Today, Bill is BMT’s Software Business Lead, managing TUFLOW Products and associated services. He also continues to provide specialist flood modelling and flood risk management advice and was the Project Manager for the award-winning Brisbane River Flood Study Hydraulic Assessment.
Fatima Bashir, DHI
Urban Water Engineer, DHI New Zealand
An experienced Water Engineer with more than six years of experience within the water
industry. She has worked in a city council as well as in engineering consultancies.
Fatima is skilled in hydraulic modelling, analytics, project management and asset
management. Her recent work includes modelling investigations for urban water networks for
three waters, water demand management assessments, and inflow and infiltration
management.
Fatima is currently based in the Auckland office of DHI NZ.
Courtenay Giles, WSP
Graduate Water Resources Engineer
WSP

Courtenay is a relatively new member of the modelling world. She joined WSP in early 2019
after completing her Natural Resources Engineering degree at the University of Canterbury in
2018. Her honours project was on water quality analysis and stream responses to
urbanisation. This prompted her to pursue water resources as her career path. Since joining
the WSP Water Resources team in the Wellington office she has been fortunate enough to
begin learning and working with software’s such as HEC-RAS, the MIKE suite and TUFLOW. She
is eager to share her findings from the past year of working with modelling software as well as
learn from others in attendance.
Girija Mulay, Stantec
Girija started her professional career as an Associate Civil Engineer in 2011 and joined
Wastewater Network Modelling team at MWH Global ResourceNet India Pvt. Ltd, Pune. She
deliberately set out to gain as much varied experience and made strong background in scope
and cost estimation, planning survey, model build, verification, flood risk assessment, options
development, UID assessment.

She has distinctive experience of modelling SuDS measures such as water butts and permeable
pavements. During her professional career at MWH Global she got awarded and recognised for
her mentorship, improving efficiency of the team by creating methodology documents and
tools, project quality and promoted to Civil Engineer in 2014.

After successful completion of six years Girija joined Mott Macdonald - GDC Mumbai in 2017
and started working as a Senior Engineer – Modelling. The aim was to set a new wastewater
network modelling team at GDC. It has a challenge being as a leader to recruit right people and
assign right job to the team. She is up skilling her leadership by training graduate modeller and
by delivering projects on time, within budget and with quality.

She has worked for UK water industry over the seven years and gained experience of
undertaking various projects PR14&19 Growth studies, PR14 Flooding Enhancement Studies,
Drainage Area Planning, Development Impact Assessment, Developer Services, SUDS, Climate
Change, and Creep modelling, CAP, DG5 Flooding Schemes, Drainage Area Study using
InfoWorks CS, ICM, MapInfo, QGIS software.

She is member of CIWEM now. She has published in refereed journal about her work in genetic
modelling and hydrologic and hydraulic analysis and presented in international conference
World Aqua Congress 2016, New Delhi.

Now she is passionately involved in network modelling projects of NZ water industry joining
Stantec, Wellington by Jan 2019.
You can also read