Minnesota Prescription Drug Price Transparency - REPORT TO THE MINNESOTA LEGISLATURE
←
→
Page content transcription
If your browser does not render page correctly, please read the page content below
Minnesota Prescription Drug Price Transparency
                  REPORT TO THE MINNESOTA LEGISLATURE
                                            February 2023
Minnesota Prescription Drug Price Transparency: Report to the Minnesota Legislature

Minnesota Department of Health
Health Economics Program
PO Box 64882
St. Paul, MN 55164-0882
651-201-4520
health.Rx@state.mn.us
www.health.state.mn.us/healtheconomics

As requested by Minnesota Statute 3.197: This report cost approximately $30,000 to prepare, including staff time.

Upon request, this material will be made available in an alternative format such as large print, Braille, or audio recording.
Printed on recycled paper.
Protecting, Maintaining and Improving the Health of All Minnesotans

Minnesota Senate                                       Minnesota House of Representatives
Health and Human Services Committee                    Health Finance & Policy Committee
       The Honorable Melissa Wiklund, Chair,                  The Honorable Tina Liebling, Chair, 477
       2107 Minnesota Senate Building                         State Office Building
       The Honorable Paul Utke, Ranking Member,               The Honorable Joe Schomacker, Ranking
       2403 Minnesota Senate Building                         Member, 209 State Office Building
Human Services Committee                               Human Services Finance Committee
       The Honorable John Hoffman, Chair, 2111                The Honorable Mohamud Noor, Chair, 379
       Minnesota Senate Building                              State Office Building
       The Honorable Jim Abeler, Ranking                      The Honorable Anne Neu Brindley, Ranking
       Member, 2207 Minnesota Senate Building                 Member, 251 State Office Building
Commerce and Consumer Protection Committee             Human Services Policy Committee
       The Honorable Matt Klein, Chair, 2105                  The Honorable Peter Fischer, Chair, 551
       Minnesota Senate Building                              State Office Building
       The Honorable Gary Dahms, Ranking                      The Honorable Debra Kiel, Ranking
       Member, 2219 Minnesota Senate Building                 Member, 203 State Office Building
                                                       Commerce Finance & Policy Committee
                                                              The Honorable Zack Stephenson, Chair, 449
                                                              State Office Building
                                                              The Honorable Tim O’Driscoll, Ranking
                                                              Member, 237 State Office Building

  February 21, 2023

  To the Honorable Chairs and Ranking Members:

  As directed in Minnesota Statutes, Section 62J.84, the Minnesota Department of Health (MDH) has
  begun implementing the Minnesota Prescription Drug Price Transparency Act (the Act), which
  requires drug manufacturers to report information to MDH on high and quickly increasing drug
  prices and for MDH to publicly publish the reported information. Enclosed is the first required
  legislative report. It represents preliminary analysis of collected data, capturing information
  reported by manufacturers of prescription drugs from the first half of 2022. The report also includes
  early takeaways on the impact of the initiative.
Name of Recipient
Page 2
February 21, 2023
Three key findings from the report include:
Holding health care use constant, the price increases required to be reported in the first four
months of 2022 are likely to impact—at minimum—an estimated 41,000 people living in
Minnesota. As a result, health care spending is estimated to increase—at minimum—by $32
million in 2022.
Nearly a year after the first required data reporting, data quality and compliance with the
statutory reporting requirement are poor. MDH is in the process of addressing data quality
concerns with almost all manufacturers (69 manufacturers for 368 reports). Additionally, MDH is
working to enforce compliance. Approximately half of expected reports have not been
submitted (68 manufacturers for 442 reports).
Minnesota’s legislation has had a positive impact on prescription drug price transparency in the
state. Unfortunately, in its current design, the Act’s impact is limited because:
▪ The focus is on list prices instead of net prices, and therefore does not represent the actual
income manufacturers earn from the sale of their products.
▪ The focus is only on manufacturers rather than the full supply chain. Other downstream
entities—like pharmacy benefit managers, wholesalers, pharmacies, and payers—also
contribute to the final price paid by consumers.
▪ Reporting requirements treat drug pricing as if there is one market functioning under a single
set of practices, which does not reflect the complex factors—such as incentives, economic
environments, and business arrangements—driving pricing and rebate practices.
▪ The Act broadly protects trade secret information, thereby shielding information from public
release.
This report and the publicly available data reported by prescription drug manufacturers will become
available on an MDH website (Prescription Drug Price Transparency Home
www.health.state.mn.us/data/rxtransparency/).
Questions or comments on the report may be directed to Stefan Gildemeister, the State Health
Economist, at (651) 201-4520 or health.Rx@state.mn.us.
Sincerely,
Brooke Cunningham, MD, PhD
Commissioner
PO Box 64975
St. Paul, MN 55164-0975
www.health.state.mn.us
Minnesota Prescription Drug Price Transparency 4Table of Contents
Minnesota Prescription Drug Price Transparency ................................................................................. 1
Executive Summary ............................................................................................................................ 7
Introduction ...................................................................................................................................... 10
Minnesota Prescription Drug Price Transparency Act...................................................................... 11
Overview of Statutory Requirements ........................................................................................... 11
National Context ........................................................................................................................... 14
Implementation of the Act ............................................................................................................... 15
Establishing Reporting Guidance .................................................................................................. 15
Registration & Reporting System .................................................................................................. 16
Data Submission & Review ........................................................................................................... 16
Public Reporting and Analysis ....................................................................................................... 16
Reported Prescription Drugs ............................................................................................................ 18
Overview of Reported Drugs......................................................................................................... 18
Early Results: New Drugs .............................................................................................................. 21
Early Results: Price Increases ........................................................................................................ 22
Data Considerations ...................................................................................................................... 27
Assessing the Effectiveness of the Act ............................................................................................. 29
Early Takeaways ............................................................................................................................ 29
Next Steps ......................................................................................................................................... 32
Conclusion......................................................................................................................................... 34
Appendix A: Minnesota Statutes, Section 62J.84 ............................................................................. 35
Appendix B-1, Data Elements Descriptions: Prescription Drug Price Increase Reporting ............... 40
Minnesota Prescription Drug Price Transparency 5Appendix B-2, Data Elements Descriptions: New Prescription Drug Price Reporting...................... 44 Appendix C: Online Presence of the Minnesota Prescription Drug Price Transparency Act ........... 45 Appendix D: Summary Statistics on Drugs with Expected Price Increase Reports .......................... 46 Minnesota Prescription Drug Price Transparency 6
Executive Summary
In 2020, the Minnesota Legislature passed the Prescription Drug Price Transparency Act or “the Act”
(Minnesota Statutes, Section 62J.84) to increase transparency into the pricing of prescription drugs.
Drug manufacturers are required to report on prices for new drugs and price increases over
specified thresholds (see Table 1). The Act requires submission of several data elements, but the
primary reporting element is the Wholesale Acquisition Cost (WAC), or “list price,” for a 30-day
supply. Requirements for reporting under the Act took effect January 1, 2022.

Overview
MDH identified 798 unique prescription drugs across 137 manufacturers with new drug
introductions or price increases above the threshold in the Act that meet the reporting
requirements on or before June 30th (this reporting period includes pricing event effective dates
between January 1st and May 1st). MDH received about half (368) of the expected reports from 69
manufacturers and is actively seeking compliance for the additional reports not submitted. MDH has
determined that virtually all reports covered in this analysis require clarifications or corrections by
manufacturers. As a result, the analysis reported here should be considered preliminary.

Preliminary Findings
Among new drugs reported to MDH, the median reported list price at market introduction was $6,612.

Among drugs reported to MDH due to a price increase, the median reported list price after the
increase was $1,062. The median reported percent price increase was 7.9%, ranging from 1.5% to
106.0%.

Based on historical data, MDH estimates that the price increases included in this report (January 1st
to May 1st) comprise about 68.0% of all price increases for calendar year 2022. The number of price
increases that would have required price increase reporting under Minnesota thresholds has
steadily declined over the last five years.

Minnesota Prescription Drug Price Transparency                                                    7
Five-Year Median Price Increase Percent with Cumulative Impact
      40%
                                                                                              32.4%
      30%                                                                   24.9%
                                                          19.1%
      20%
                                  12.3%
                    8.0%                                                                       9.0%
      10%                             5.0%                6.0%               5.0%

       0%
                    2018             2019                 2020               2021              2022

                                    Annual Increase               Cumulative Increase

Source: MDH, Health Economics Program summary of data reported under Minnesota’s Prescription Drug Price Transparency Act for
the period of January 1, 2022, to June 30, 2022.

Based on historical data, MDH estimates the price increases requiring reporting from January 1 to
May 1 of 2022 would impact—at a minimum—41,000 people living in Minnesota during 2022 and
would generate an additional $32 million in health care spending in 2022.

As a percentage of gross revenue, on average manufacturers reported 35.8% was spent on direct
costs on of manufacturing, marketing, and distributing, 14.8% on profit, and 6.2% on financial
assistance.

                    Distribution of Preliminary Reported Gross Revenue Among
                                       Price Increase Reports

                      Financial     Net Profit
                     Assistance      14.8%
                        6.2%                                                   Manufacturing Cost
                                                                                    22.4%

                                                 Direct Costs
                                                    35.8%                        Marketing Cost
                                                                                    11.2%

            Other Costs (Not
               Reported)                                                       Distributing Cost
                 43.2%                                                                2.2%

Source: MDH, Health Economics Program analysis for preliminary reported data under Minnesota’s Prescription Drug Price
Transparency Act for the period of January 1, 2022, to June 30, 2022. Note: Other Costs (Not Reported) may include direct costs other
than those of manufacturing, marketing, and distributing the prescripotion drug.

Minnesota Prescription Drug Price Transparency                                                                                 8
Takeaways and Next Steps
While MDH is not yet positioned to offer definitive and final insights into the efficacy of the Act
given the recency of data availability and the need to validate and improve data quality and
completeness, early takeaways from the initiative include:
With the implementation of the Act, transparency in pharmaceutical pricing in Minnesota has
distinctly increased.
To meaningfully impact affordability and sustainability of prescription drug prices, transparency
needs to be expanded and paired with stronger oversight and regulation of pricing practices.
Transparency laws across the nation may have affected patterns of price increases by
manufacturers.
MDH is expanding its analytic use and dissemination of reported data as it improves the quality of
the data—including by considering other data on prescription drugs collected in Minnesota and by
programs in other states and the federal government. As part of these activities, MDH will continue
incrementally expanding the data available on the price transparency website as interactive
dashboards (Prescription Drug Price Transparency Home;
www.health.state.mn.us/data/rxtransparency/).
Minnesota Prescription Drug Price Transparency 9Introduction For many people living in Minnesota, drug therapy is a critical component of health care and well- being.1 Prescription drugs provide many patients with life-saving treatment and improvements in quality-of-life. Yet, many people living in Minnesota face affordability challenges due to high and increasing prescription drug prices 2 and changes in health insurance benefit designs. There is considerable evidence that racial and ethnic minority populations disproportionately experience access barriers to novel and high-cost medications, lower-cost generic therapies, certain emergency use therapies, and preventive or critical care therapies. 3 Prescription drug prices have been shown to cause patients to forego or reduce treatment; and prescription drug prices, as a component of overall out-of-pocket spending, affect the ability of people living in Minnesota to pay their health care bills. 4 Not only are there increasing numbers of people living in Minnesota struggling to afford their medications, 5 but trends in prescription drug prices also place pressure on public and private payers, as well as employers. 6 In response, the Minnesota Legislature passed the Prescription Drug Price Transparency Act or “the Act” (see Appendix A) in 2020 to increase transparency into the pricing of prescription drugs and 1In 2013, the most recent year for which a more in-depth analysis was conducted most insured Minnesotans (about 3.2 million or 68.4 percent) filled one or more prescriptions at a pharmacy. This represents nearly 56 million filled pharmacy prescriptions for Minnesota residents that year. (MDH/Health Economics Program and PRIME Institute/Data IQ analysis of Minnesota All Payer Claims Database, 2016; MDH/Health Economics Program (2016) Pharmaceutical Spending and Use in Minnesota: 2009 to 2013, Issue Brief. Pharmaceutical Spending and Use in Minnesota: 2009 - 2013 (www.health.state.mn.us/data/apcd/docs/RxIssueBrief1Proof20161102.pdf); MDH/Health Economics Program and PRIME Institute/Data IQ analysis of Minnesota All Payer Claims Database, 2019.) 2 For example, see 46brooklyn (2021). The Rise of the Drug Mix Empire (https://www.46brooklyn.com/research/2020/12/15/the- increasing-irrelevance-of-brand-drug-price-increases). 3Essien UR; Dusetzina SB; and WF Gellad. A Policy Prescription for Reducing Health Disparities—Achieving Pharmacoequity; JAMA. 2021;326(18) 4In 2021, 5.7 percent of Minnesotans reported not filling a prescription in a 12-month period due to costs. (MDH/Health Economics Program analysis of the Minnesota Health Access Survey. In 2013, about 135,000 insured Minnesotans paid more than $1,000 in out- of-pocket prescription drug pharmacy costs, with 1,835 Medicare beneficiaries and 1,075 commercially insured Minnesotans having paid $5,000 or more out of pocket. 5In 2021, 5.7 percent of Minnesotans reported not filling a prescription in a 12-month period due to costs. (MDH/Health Economics Program analysis of the Minnesota Health Access Survey. In 2013, about 135,000 insured Minnesotans paid more than $1,000 in out- of-pocket prescription drug pharmacy costs, with 1,835 Medicare beneficiaries and 1,075 commercially insured Minnesotans having paid $5,000 or more out of pocket. 6 In 2020, Minnesota spending on retail prescription drugs (less prescription drug rebates) totaled over $5.9 billion, or 9.8 percent of all health care spending in Minnesota. If one includes estimates of spending on prescription drugs administered in medical settings, like hospitals, infusion centers, and nursling homes, prescription drug spending in Minnesota in 2020 likely reached as high as $10.2 billion and accounted for 17.0 percent of total spending. (MDH/Health Economics Program (unpublished), “Minnesota Health Care Spending: 2020 Estimates and Ten-Year Projections; Minnesota Department of Health, Health Economics Program, MN APCD Issue Brief: Pharmaceutical Spending and Use in Minnesota: 2009-2013. November 2016. Pharmaceutical Spending and Use in Minnesota: 2009-2013 (https://www.health.state.mn.us/data/apcd/docs/RxIssueBrief1Proof20161102.pdf). Minnesota Prescription Drug Price Transparency 10
inform future policy through an improved understanding of factors driving prescription drug prices.
The Act directs the Minnesota Department of Health (MDH) to develop a system for collecting data
from pharmaceutical manufacturers and publicly reporting these data. The Act also requires MDH to
annually submit a report to the legislature containing a synthesis of the data and assessment of the
impact of the Act.
This is the first legislative report prepared by MDH. It contains:
An overview of the Act.
An update of MDH’s implementation of the Act, including a summary of submitted information
and preliminary analyses of reported data.
A preliminary discussion of the effectiveness of the Act.
This report covers the reporting period from January 1, 2022 7 to June 30, 2022.
Minnesota Prescription Drug Price Transparency Act
Overview of Statutory Requirements
The Act has three core requirements:
1. Reporting: Drug manufacturers must report to MDH a set of specified data elements when a
drug’s price meets the criteria for reporting. Broadly, reporting is required for higher priced new
drugs and certain price increases.
2. Public Posting: MDH must publicly post data reported by manufacturers.
3. Assessing Impact: MDH must assess the Act’s effectiveness in addressing the three primary
statutory goals:
a) Promoting transparency in pharmaceutical pricing for the state and other payers.
b) Enhancing the understanding of pharmaceutical spending trends.
c) Assisting the state and other payers in the management of pharmaceutical costs.
Manufacturer reporting takes place throughout the year and is governed by defined triggering
events associated with the introduction of new drugs 8 and price increases. Table 1 summarizes the
7 Under the law, manufacturers have a 60 days after a triggering event (a qualifying price increase or introduction at a qualifying price
level) for reporting and the submission of data. MDH received the first submission on March 1, 2022 for a triggering event date of
January 1, 2022.
8Minnesota Statutes 62J.84 criteria for reporting new drugs is defined in reference to the Centers for Medicare and Medicaid
Services’ tier threshold for specialty drugs, which was $830 in 2022. Centers for Medicare and Medicaid Services. (February 3, 2022).
Contract Year 2023 Final Part D Bidding Instructions (https://www.cms.gov/files/document/2023partdbiddinginstructions.pdf).
Minnesota Prescription Drug Price Transparency 11main criteria for when reporting is required. 9 Requirements for reporting under the Act took effect
January 1, 2022, and manufacturers have 60-days after a triggering event to submit reports. For
example, drugs with triggering events on January 1, 2022 must be reported by March 2, 2022. The
price metric identified in the Act is the Wholesale Acquisition Cost (WAC), 10 which is defined in
federal law, and is a manufacturer’s list price.
Table 1: Triggering Events for Prescription Drug Reporting
Trigger
Type Drug Type Price Minimum Criteria
Greater than or equal to 10%
Price increase in WAC over previous 12
Brand 11 Greater than or equal to $100 WAC
Increase months or 16% over previous 24
months
Greater than or equal to 50%
Price
Generic 12 Greater than or equal to $100 WAC increase in WAC over previous 12
Increase
months
Price at
Market Brand Greater than $830 WAC in 2022 Introduction for sale
Entry
Price at Greater than $830 WAC in 2022
Generic and
Market and is not at least 15% lower than Introduction for sale
Biosimilar
Entry the referenced brand name drug
9For more detail on the triggers and criteria for reporting, see the Submission Requirements section of MDH’s Form and Manner for
Prescription Drug Price Data Sets guidance at: Form and Manner for Prescription Drug Price Data Sets, Feb. 2022
(https://www.health.state.mn.us/data/rxtransparency/docs/rxformmanner022322.pdf) .
10Wholesale acquisition cost is defined in United States Code, title 42, section 1395w-3a(c)(6)(B) as “the manufacturer’s list price for
a prescription drug to wholesalers or direct purchasers in the United States, not including prompt pay or other discounts, rebates or
reductions in price.”
11Brand name drug is defined in Minnesota Statutes 62J.84, subdivision 2(c) as “an original, new drug application approved under
United States Code, title 21, section 355(c), except for a generic drug as defined under Code of Federal Regulations, title 42, section
447.502; or a biologics license application approved under the United States Code, title 45,section 262(a)(c).
12Generic drug is defined in Minnesota Statutes as “a drug that is marketed or distributed pursuant to: an abbreviated new drug
application approved under United States Code, title 21, section 355(j); an authorized generic as defined under Code of Federal
Regulations, title 45, section 447.502, or a drug that entered the market the year before 1962 and was not originally marketed under
a new drug application.”
Minnesota Prescription Drug Price Transparency 12Manufacturers are required to submit a range of data elements for each drug with a triggering
event. Table 2 summarizes the data elements by data type (see Appendix B-1 and B-2).
Manufacturers may identify certain information as trade secret and as non-public. They must
provide a rationale for this designation. When MDH withholds non-public data from publication
because they are protected by trade secret laws or other data practices provisions, MDH must
describe the nature of information withheld and the basis for withholding the information.
Table 2: Required Data Elements
Data Type Data Elements
Administrative Descriptive Drug Information
Information Manufacturer Information
Acquisition Information (company, date, price)*
Pricing History and Net Increase Percent (current and previous five years)
Cost Drivers Factors Contributing to Increase
Direct Costs (manufacturing, marketing, distribution)
Sales Revenue and Net Profit
WAC at Acquisition and Prior Year* (WAC at Introduction**)
Year Introduced to Market and WAC at Introduction*
WAC Price – Previous Five Years*
Industry Financial Assistance Provided to Patient Programs
Relationships and Pay for Delay Agreements
Market Context Patent Expiration Date
Ten Highest Foreign Prices (brand only)
Breakthrough Therapy Designation/Priority Review (Y/N)**
*Data element that is required for drugs acquired by a manufacturer within 12 months of triggering a price increase report.
**Data element required only for new drugs.
The Act also provides that a manufacturer may be subject to a civil penalty not to exceed $10,000
per day of violation for failure to submit timely reports, failure to provide required information, or
providing inaccurate or incomplete information.
Minnesota Prescription Drug Price Transparency 13National Context
With the adoption of the Act, Minnesota joined 17 other states that had passed drug price
transparency laws and has been followed by three additional states passing transparency
legislation. 13 Minnesota’s law differs in some important ways from those in other states:
Collection of trade secret information and evaluation of trade secret assertions. Minnesota’s
law—like many state prescription drug price transparency initiatives—requires reporting of data
elements regardless of trade secret status. However, Minnesota is among the few states that
require manufacturers justify the reason for their position that data are trade secret and
evaluate manufacturer justifications, disclosing them if no legal basis is found.
Volume of detailed information. State transparency initiatives vary by what types of
information, and at what level of specificity or aggregation are required. In Minnesota,
manufacturers are required to report data at the drug product level. This means reporting
occurs at a national drug code level 14 for all unique combinations of drug name, dosage,
strength, and package size. In addition, required data include administrative information, pricing
history, cost drivers, industry relationships, and market context.
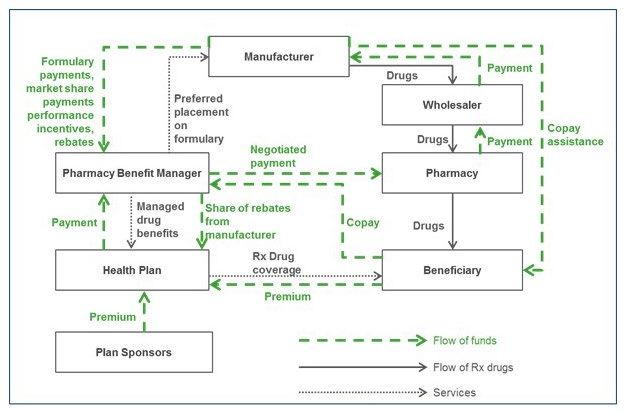
Reporting only from manufacturers and focus on list prices. Minnesota’s reporting requirement
is limited to manufacturers of prescription drugs and the price they set for drugs, which is the
WAC or the list price. Other states also collect data from other entities throughout the
prescription drug supply chain, including pharmacy benefit managers (PBMs), wholesalers,
pharmacies, and health plans. Reporting in other states also aims to collect data on net prices
and net expenditures, thereby helping to illustrate the flow of funds through the supply chain
and understanding the economic forces shaping pricing.
Continuous data reporting. While the transparency initiatives in many other states require
annual reporting, the Act in Minnesota requires manufacturers report to MDH on an ongoing
basis within 60 days of a triggering event. Under this design, manufacturers’ price changes may
trigger reporting at any point and possibly multiple times in a calendar year.
13National Academy of State Health Policy. “2022 State Legislative Action to Lower Pharmaceutical Costs.” NASHP - 2022 State
Legislative Action to Lower Pharmaceutical Costs (https://www.nashp.org/rx-legislative-tracker/).
14 The National Drug Code (NDC) is a unique, three-segment number assignment by the FDA and used as a universal identifier for
individual drug products in the United States. The first set of numbers identifies the labeler, such as the drug manufacturer,
repackager, or distributer. The second set is the product code, which details the drug strength, dosage form and formulation, and the
last set identifies the package size and type. U.S. FDA - National Drug Code Directory (https://www.fda.gov/drugs/drug-approvals-
and-databases/national-drug-code-directory).
Minnesota Prescription Drug Price Transparency 14Implementation of the Act
MDH approached implementation of the Act with the goal to balance efficiency in data collection
with ensuring that collected data would be timely and of high-quality. To that end, MDH consulted
with industry representatives, communicated through GovDelivery announcements and state
register notices, and sought feedback from stakeholders. MDH also established a website to host
real-time information throughout the implementation process (Prescription Drug Price
Transparency Home (www.health.state.mn.us/data/rxtransparency/); see Appendix C). This website
will also be the location where MDH hosts data for public reporting.
MDH drew on the expertise of state officials engaged in prescription drug policy and prescription
drug price transparency initiatives in other states, subject matter experts, and the National Academy
for State Health Policy (NASHP). Figure 1 provides an overview of four distinct milestones of
implementation of the Act.
Figure 1: Implementation Milestones of the Act
Establishing Reporting Data Submission &
Guidance & System Review
(Apr - Dec 2021) (Mar 2022 - ongoing)
Registration & Reporting Public Reporting &
System Goes Live Analysis
(Jan - Feb 2022) May 2022 - ongoing
Establishing Reporting Guidance
MDH sought to ensure that data reporting requirements were sufficiently rooted in industry
practices by contracting with subject matter experts at Ten2Eleven Business Solutions, LLC, a firm
that provides business technology solutions in the prescription drug space. To develop the reporting
guidance, MDH held two public meetings between June and November 2021, at which MDH
solicited manufacturer input. The final reporting guidance—which incorporated feedback from
manufacturers, their trade associations, and other stakeholders—was released in December of
2021.
Minnesota Prescription Drug Price Transparency 15Registration & Reporting System
MDH developed an online reporting system for manufacturers to submit required information easily
and securely. MDH held a training on the registration portal, responded to questions from
manufacturers, and prepared online materials to assist manufacturers in their reporting. 15
Data Submission & Review
Following the statutory reporting timeframes, MDH received its first data submissions in March
2022 for new drug introductions and price increases with triggering events on or after January 1,
2022. MDH staff has reviewed the initially reported data to assess compliance with the Act and
reporting accuracy. A detailed analysis of the scope of reporting and state of quality of the data is
reported in the section titled Reported Prescription Drugs. MDH is actively working with
manufacturers to address the identified concerns and questions with compliance and data quality.
Public Reporting and Analysis
MDH’s initial public posting of reported data will be iterative. MDH has prepared interactive displays
that present drug-level data and aggregate trends—we refer to them as data dashboards. MDH
anticipates releasing the following seven dashboards over time. They are accessible under the
following URL: https://www.health.state.mn.us/data/rxtransparency/
Reporting Snapshot – Descriptive tables of the volume and types of data reported to MDH, use
and spending context for the reported drugs, and an overview of the review and public posting
status of reported data.
Price Increase: Five Year Price Analysis – Data on average current and cumulative price change
percent over the most recent five years.
Price Increase: Comparative Price Analysis – Data comparing the 5-year cumulative price
change for a drug product with the cumulative mean price change of equivalent products.
Price Increase: Reported Revenues, Costs, and Profits – Data on direct costs, revenues, and
profits of drug products.
Price Increase: Drug Report – List of drugs reported for price increases above statutory
thresholds and all data elements that may be publicly posted.
New-to-market: Drug Report – List of new-to-market drugs with prices above statutory
thresholds and all data elements that may be publicly posted.
15 Materials that manufacturers can consult in the process of submitting the required information is available online: Prescription Drug
Price Transparency: Information for Reporting Entities (www.health.state.mn.us/data/rxtransparency/rptgentities.html)
Minnesota Prescription Drug Price Transparency 16 Acquired Product Price Impact Analysis – Information about acquired drugs. Additionally, MDH will make downloadable files available online of all reported data that may be made public. These dashboards and downloadable files will be updated on a rolling basis following the completion of reviews for compliance and accuracy, and remediation by manufacturers. Minnesota Prescription Drug Price Transparency 17
Reported Prescription Drugs
This section provides a preliminary summary of prescription drug prices reported to the department
from manufacturers on or before June 30th, 2022. The data received are incomplete, inconsistent,
and a significant portion remain unverified. As noted, MDH is in the process of verifying and
reviewing data and is following up with virtually all manufacturers where the quality of data appears
suspect or inconsistent with requirements. Additionally, MDH is pursuing compliance checks for
manufacturers with incomplete or nonexistent/absent reporting. Therefore, due to data quality and
quantity concerns, the summary and analysis presented in this report is preliminary. MDH believes
despite the preliminary nature of the data, they lend themselves to exploring high-level takeaways.

To support our analysis and identify what reporting is expected, MDH benefited from a range of
reference data—including Wolters Kluwer Medi-Span, 16 FDA National Drug Code Directory, 17 and
FDA Purple Book. 18 This information provides MDH the ability to analyze market attributes and
pricing trends related to all drugs for which the department expects manufacturer reporting.
Appendix D provides a summary of these reference data. Throughout this section, MDH presents
the preliminary and unrefined reported data—submitted by manufacturers to MDH—in relation to
the data on expected reports and statistics based on reference data on all drugs for which MDH
expected to receive a report.

Overview of Reported Drugs
Manufacturers of drugs that met the triggering event criteria defined in the Act–either a new drug
or a price increase–between January 1 and May 1 of 2022 were required to report on or before June
30, 2022.19 Historical data indicate that the pricing events targeted by the Act happen earlier in the
year with 68.0% of all price increases within a typical calendar year occurring within these first four
months. As such, the reporting period for this report likely covers most drug reports for the year. 20,

16Additional information about Medi-Span is available at: Medi-Span: Drug Data Solutions for Healthcare
(https://www.wolterskluwer.com/en/solutions/medi-span).
17U.S. Federal Food and Drug Administration. National Drug Code Directory. Available at: U.S. FDA - National Drug Code Directory
(https://www.fda.gov/drugs/drug-approvals-and-databases/national-drug-code-directory).
18U.S. Federal Food and Drug Administration. Purple Book: Database of Licensed Biological Products. U.S. FDA - Purple Book:
Database of Licensed Biological Products (https://purplebooksearch.fda.gov/downloads).
19 This lag is due to the 60 days manufacturers are allowed to submit data after a triggering event. This report includes all data
submissions from January 1 to June 30, 2022 and may include some drugs with triggering events after May 1, 2022 that were
submitted before June 30th.
20MDH conducted this analysis using reference data from Walters Kluwer’s Medi-Span data for the years 2019 to 2021. Additional
information about Medi-Span is available at: Medi-Span: Drug Data Solutions for Healthcare
(https://www.wolterskluwer.com/en/solutions/medi-span).

Minnesota Prescription Drug Price Transparency                                                                                       18
Using reference data, MDH identified 810 triggering events—either new drug introductions or price
increases—for 798 unique prescription drugs across 137 manufacturers that were statutorily
required to report on or before June 30.21 As shown in Table 3, MDH received 368 reports from 69
manufacturers—or 45.4% of expected reports from 50.4% of the manufacturers. (MDH received an
additional 108 reports, 21 for new drugs and 87 for price increases, for the same period that were
not statutorily required; these reports are included in the analysis in this section.)

                       Table 3: Expected Reports and Required Reports Received
                                                                                     Required and            Percentage
                               Measure                              Expected           Received               Received
          New Prescription Drug Reports                                112                 43                   38.4%
          Prescription Drug Price Increase Reports                     698                 325                  46.6%
          Total                                                        810                 368                  45.4%
Source: MDH, Health Economics Program summary of preliminary data expected and reported under Minnesota’s Prescription Drug
Price Transparency Act for the period of January 1, 2022, to June 30, 2022. Note: reports not statutorially required are not presented
in this table.

New drug introductions and price increases occurred across a wide range of therapeutic classes.22
The ten therapeutic classes with the highest number of reports by report type are included in Table
4 and Table 5.

21   Some of these drugs had more than one price increase during this timeframe that triggered required reporting.
22U.S. Federal Food and Drug Administration. USP Therapeutic Categories Model Guidelines. March 28, 2018. Available at: USP
Therapeutic Categories Model Guidelines (https://www.fda.gov/regulatory-information/fdaaa-implementation-chart/usp-
therapeutic-categories-model-guidelines).

Minnesota Prescription Drug Price Transparency                                                                                   19
Table 4: Top 10 Therapeutic Classes Associated with
New Prescription Drug Price Reports
Percent of Reports
Therapeutic Class Number of Reports
Received
Antineoplastics and Adjunctive Therapies 17 26.5%
Hematological Agents – Misc. 8 12.5%
Endocrine and Metabolic Agents – Misc. 5 7.8%
Dermatologicals 5 7.8%
Cardiovascular Agents – Misc. 4 6.3%
Analgesics – Anti-Inflammatory 3 4.7%
Anti-Infective Agents – Misc. 2 3.1%
Antihistamines/Nasal Agents/Cough and
Cold/Respiratory/Misc. – Antiasthmatic and 2 3.1%
Bronchodilator Agents
Diagnostic Products 2 3.1%
Hematological Agents – Hematopoietic Agents 2 3.1%
Subtotal 50 78.0%
Source: MDH, Health Economics Program summary of preliminary data expected and/or reported under Minnesota’s Prescription
Drug Price Transparency Act for the period of January 1, 2022, to June 30, 2022.
Minnesota Prescription Drug Price Transparency 20Table 5: Top 10 Therapeutic Classes Associated with
Prescription Drug Price Increase Reports
Percent of Reports
Therapeutic Class Number of Reports
Received
Antineoplastics and Adjunctive Therapies 47 11.4%
Endocrine and Metabolic Agents – Antidiabetics 30 7.3%
Ophthalmic Agents 23 5.6%
Passive Immunizing and Treatment Agents 19 4.6%
Cardiovascular Agents – Antihypertensives 17 4.1%
Analgesics – Opioid 16 3.9%
Dermatologicals 15 3.6%
Anti-Infective Agents – Antivirals 14 3.4%
Nutritional Products – Minerals and Electrolytes 14 3.4%
Endocrine and Metabolic Agents – Misc. 13 3.2%
Subtotal 208 50.5%
Source: MDH, Health Economics Program summary of preliminary data expected and/or reported under Minnesota’s Prescription
Drug Price Transparency Act for the period of January 1, 2022, to June 30, 2022.
Early Results: New Drugs
Using reference data, MDH identified 112 new drugs that required reporting during the first half of
2022 following their introduction to market at prices that exceeded $830, the 2022 threshold. Of
these, 81 were brand drugs and 31 were generic drugs. MDH received 38.4% of these expected
reports by June 30, 2022. MDH identified an additional 44 generic drugs were introduced for sale at
prices greater than $830 but were not required to report because their drug products were
introduced at a discount from the reference brand drug product of greater than 15%, or a reference
brand drug was not on the market.
The median reported list price at market introduction was $6,612.50 with half of all introductions
priced between $3,184.59 and $15,396.47. Manufacturers reported existing patent protection for
64.1% of the submitted new drug reports. Patent protection means that the period during which a
manufacturer enjoys market exclusivity where competitor drugs are delayed or cannot be brought
to market has not ended. Among these, 28 were reported as having received priority review from
the Food and Drug Administration (FDA), and of these, 16 were also indicated as having
breakthrough therapy designation. Priority review and breakthrough therapy designation are FDA
Minnesota Prescription Drug Price Transparency 21approval processes that seek to reduce the development and review time for drugs that may
provide a substantial improvement over existing treatment options.
Manufacturers reported information on direct costs attributed to manufacturing, marketing, and
distributing. 23 Table 6 aggregates the average reported direct cost values for each category across
new drug introductions. The Act requires collection of these three categories, but the manufacturer
is not required to report other direct costs; so, the data represented likely captures only a portion of
a manufacturer’s total direct costs.24 The cost of manufacturing and distribution each accounted for
nearly half of the reported direct costs and marketing accounted for 6.3% of these costs. This data
was inconsistently reported and, again, MDH is in the process of addressing many errors; so, the
information presented is not final.
Table 6: Summary of Reported Direct Cost Information for New Drugs
Reported Average Percent of Total
Direct Cost Reported Value
(in mill $)
Manufacturing $127.0 49.0%
Marketing $16.4 6.3%
Distribution $115.6 44.6%
Total $259.0 100.0%
Source: MDH, Health Economics Program summary of preliminary data expected and/or reported under Minnesota’s Prescription
Drug Price Transparency Act for new prescription drugs for the period of January 1, 2022, to June 30, 2022.
Early Results: Price Increases
MDH identified 698 triggering events for 686 unique drugs that were on the market that required
reporting during the first half of 2022 due to exceeding the price and percentage increase criteria
established by the Act.25 MDH estimates that a minimum of 41,000 people living in Minnesota
would be impacted by these price increases based on prescribing patterns from the first six months
of 2021,26 and estimates these increases will raise health care spending, at a minimum, by $32
million in Minnesota in 2022.
Of the 698 expected price increase reports, only nine were for generic drugs. This disparity partially
stems from the difference in reporting criteria in the Act between brand drugs and generic drugs:
23In some instances, manufacturers reported the same value for direct costs across multiple items with the same generic ingredient.
For this analysis, MDH assumed these values represent total direct cost amounts distributed evenly rather than duplicate values.
24 Direct costs collected by MDH do not include research and development costs.
25 Some of these drugs had more than one price increase during this timeframe that triggered required reporting.
26 MDH reviewed pharmacy claims data collected in its Minnesota All Payer Claims Database (MN APCD) for claims incurred during
the first six months of 2021 that relate to the drug products qualified as a triggering event for price increase reporting.
Minnesota Prescription Drug Price Transparency 22brand drugs must be reported for a price increase of 10% or more over a 12-month period or 16% or
more over a 24-month period. Generic drugs that generally have lower prices in the first place need
only be reported for a price increase of 50% or more during a 12-month period. If the reporting
criteria were the same for generic drugs as they are for brand name drugs, an additional 127
generics drugs would have been required to be reported.27
The median list price after price increase for drugs reported to MDH was $1,062.35, with half of the
prices between $349.90 and $3,354.12. Figure 2 provides data for all drugs for which reports should
have been submitted. As expected, the range in the prices varied more greatly for brand name drugs
compared to generics.
Figure 2: Median and Interquartile Range of List Prices for Expected Price Increase
Drugs
$5,000
$4,500
$4,000
Median List Prices
$3,500
$3,000
$2,500
$2,000
$1,500
$1,000 $950.80 $932.56
$500
$320.85
$0
Brand Generic All
Source: MDH, Health Economics Program analysis of Medi-Span reference data from Wolters Kluwer’s Medi-Span Suite of electronic
drug data files on expected for price increase reporting for the period of January 1, 2022, to June 30, 2022. Additional information
about Medi-Span is available at: Medi-Span: Drug Data Solutions for Healthcare (https://www.wolterskluwer.com/en/solutions/medi-
span).
Manufacturers reported that 143 of the drugs reported for their price increase retained patent
protection.
Price increases for drugs that are the subject of this initial reporting under the Act tend to occur on
regular schedules. As shown in Figure 3, this means that price increases build up over time just like
compound interest. The median cumulative increase reported by manufactures over the five-year
period preceding the current increase, therefore preceding the time the Act was in force, was
27 If statutory pricing criteria were the same for brand and generic drugs, 18.9 percent of brand drugs and 17.1 percent of generic
drugs with a price increase of any amount during the review period would have required reporting.
Minnesota Prescription Drug Price Transparency 2332.4%. Figure 3 shows aggregated preliminary data; once data are validated and corrected, MDH
will be able to report these trends for specific drugs (National Drug Code or “NDC”), drug families,
and for therapeutic classes.
Figure 3: Five-Year Median Price Increase Percent with Cumulative Impact
40%
32.4%
30% 24.9%
20% 19.1% Annual Increase
8.0% 12.3% 9.0%
10% 5.0% 6.0% 5.0% Cumulative Increase
0%
2018 2019 2020 2021 2022
Source: MDH, Health Economics Program summary of preliminary data reported under Minnesota’s Prescription Drug Price
Transparency Act for the period of January 1, 2022, to June 30, 2022.
For illustration, Figure 4 presents a review of reference data that shows the number of price
increase events over the previous five years that would have met the Act’s requirements for
reporting. Note that this is solely for reference as the reporting requirement was not in force in
Minnesota until 2022. The number of significant price increases, as defined by the Act, has steadily
declined. Several factors may have influenced this change in pricing dynamics, including:
Increased competition resulting from a significant number of blockbuster drugs becoming
generically available between 2010 and 2020.28
Implementation of price transparency laws requiring manufacturer reporting of significant price.
Operational and financial decisions influenced by the COVID-19 pandemic in 2020 and 2021.
Figure 4: Estimated Number of Price Increase Events that Would Have Met
Minnesota’s Reporting Thresholds for the Five Years Prior to Implementation
3,000 2,800
2,323
2,000 1,303
1,027
757
1,000
0
2017 2018 2019 2020 2021
28 DeRuiter, Jack, and Holston, Pamela L. “Drug Patent Expirations and the ‘Patent Cliff.’” Published June 20, 2012. U.S. Pharmacist.
U.S. Pharmacist - Drug Patent Expirations and the "Patent Cliff" (https://www.uspharmacist.com/article/drug-patent-expirations-and-
the-patent-cliff).
Minnesota Prescription Drug Price Transparency 24Source: MDH, Health Economics Program analysis of Medi-Span reference data from Wolters Kluwer’s Medi-Span Suite of electronic
drug data files. Additional information about Medi-Span is available at: Medi-Span: Drug Data Solutions for Healthcare
(https://www.wolterskluwer.com/en/solutions/medi-span).
As part of the Act’s requirements, manufacturers reported the top ten foreign prices for 21% of
reported drugs. 29 MDH is following up with manufacturers to ensure that drug-specific reporting on
international prices is complete, accurate, and posted publicly; at this point these data have
significant gaps and several manufacturers are claiming trade secret protection over these data.
Analyzing data as submitted, MDH finds U.S. list prices overall exceed the reported international
prices by substantial amounts. Although U.S. prices for a few reported drugs are below international
list prices, U.S. prices on average are nearly three times larger than their international
counterparts. 30
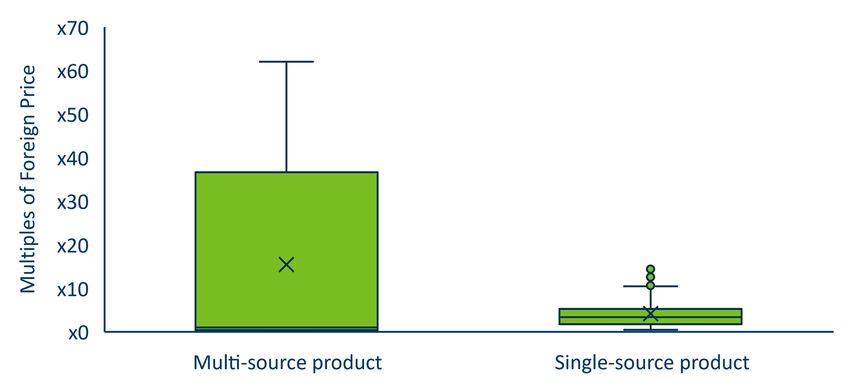
As shown in Figure 5 (which distinguishes between single-source 31 and multi-source drugs 32) the
U.S. list prices for most drugs significantly exceed international prices, sometimes 60-times larger.
Price differences in foreign countries for single source brand drug products were less significant,
suggesting that brand drug prices for multisource drug products may recognize more rapid price
reductions as generic products are introduced to the market in foreign countries.
Figure 5: U.S. WAC as a Multiple of the Foreign Price: Full Range, Interquartile Range
and Median for Price Increase Drugs
29 Some manufacturers have indicated that they have not reported prices in other countries because drugs are not being sold in
equivalent package sizes. MDH has communicated to manufacturers that they must estimate respective prices in these
circumstances.
30 The median percentage that WAC was reported priced above foreign prices was 260.6 percent during the previous calendar year.
31Single-source drugs are drugs that do not face competition from generic drugs rated as therapeutically equivalent under the Food
and Drug Administration.
32Multi-source drugs are drugs for which there Is at least one other drug product that is rated as therapeutically equivalent by the
Food and Drug Administration and is sold or marketed in the United States.
Minnesota Prescription Drug Price Transparency 25Source: MDH, Health Economics Program analysis for preliminary reported data under Minnesota’s Prescription Drug Price
Transparency Act for the period of January 1, 2022, to June 30, 2022.
One benefit of increasing prescription drug transparency is to better understand how price increases
are related to the direct costs manufacturers experience and the revenue and profits the drugs
generate. Manufacturers that provided data across all revenue, cost, and profit data elements,
reported that average reported direct costs (manufacturing, marketing, and distribution) accounted
for 35.8% of gross revenue and the average profit margin amounted to 14.8%, as shown in Figure 6.
Only 6.2% of gross revenue for reported drugs was devoted to financial assistance. 33
Figure 6: Distribution of Preliminary Reported Gross Revenue Among
Price Increase Reports
Net Profit
Financial Assistance 14.8%
6.2%
Manufacturing Cost
22.4%
Reported Direct Costs
35.8% Marketing Cost
11.2%
Other Costs (Not
Distributing Cost
Reported)
2.2%
43.2%
Source: MDH, Health Economics Program analysis for preliminary reported data under Minnesota’s Prescription Drug Price
Transparency Act for the period of January 1, 2022, to June 30, 2022. Note: Other Costs (Not Reported) may include direct costs other
than those of manufacturing, marketing, and distributing the prescripotion drug.
Manufacturers are required to submit narratives describing the factors contributing to the price
increase, from which Minnesota expected to learn about what dynamics drive price increases and
how they differ across products, manufacturers, drug classes, and drug characteristics. From the
relatively brief and universal narrative descriptions submitted by manufacturers, MDH noted the
following preliminary trends:
Each manufacturer provided essentially the same justification language for all their reported
drug products, rather than identifying drug-specific factors.
33Other Costs (Not Reported) represents the difference between reported gross revenue reduced by direct costs and financial
assistance and the value reported as net profit.
Minnesota Prescription Drug Price Transparency 26 Many manufacturers referred to “costs and market dynamics” and “patient value” as key factors
without indicating what that meant specifically.
Some manufacturers referenced “marketing and distribution costs” as reasons for price
increases—ؙagain without noting what underlying factors drove changes in these direct costs and
ultimately drove price increases.
Some manufacturers noted that drug prices as reported are needed to finance operations
related to innovation, oversight, and patient access.
Data Considerations
As noted in the introduction to this section, the analysis reported here should be considered
preliminary because of concerns about the quality and completeness of the data. Users of these
data should be aware of the following considerations:
The reported data contain suspected inaccuracies and are incomplete. MDH has determined that
virtually all reports covered in this analysis require clarifications or corrections by manufacturers.
Common reasons include that:
Reported data do not match reference data.
Data were reported at an aggregated level rather than an NDC-specific level.
Required data fields were not completed.
Reports did not adhere to reporting requirements.
MDH is assessing these data on an ongoing basis and is following-up with manufacturers to address
these issues.
The narrative descriptions of factors contributing to price increases often lacked meaningful, drug-
specific information. Our understanding of the intent of this requirement was to better understand
the factors responsible for price increases—such as manufacturing capacity, input price trends,
formulary design considerations, or product competition. However, information submitted by
manufacturers lacked significant detail or specificity that would generate meaningful and actionable
insights. Furthermore, manufacturers frequently reported the same written narrative description of
factors contributing to price increases regardless of the magnitude of a price increase or the drug
product. Without drug-specific information, this data element holds little utility in understanding
the distinct factors behind drug prices and their market environments. The narrative descriptions of
the factors contributing to price increases suggested that manufacturers set list prices based on
several other factors in addition to costs.
Many data elements reported to MDH were designated as not public and/or trade secret by
manufacturers, which may prevent these data from being publicly reported. Not public and/or
trade secret designations must be accompanied by written statements from the manufacturer that
Minnesota Prescription Drug Price Transparency 27substantiate the assertions by showing that each designated data element is supported by law as not public data or by citing applicable federal or state law and relevant legal authority. MDH must review these assertions to determine whether elements should be withheld from publication. Virtually all (90%) of submitted reports included at least one data element designated by manufacturers as not public and/or trade secret. The data elements with the highest share of not public designation were those that contained financial information, including: Gross revenue and net profit. Direct costs incurred (manufacturing, distributing, and marketing). The estimated amount of financial assistance provided. Many not-public assertions declare that disclosure of the data would provide competitors, customers, insurers, pharmacy benefit managers, and/or marketers with information that could be used to impact the ability to negotiate purchase and rebate agreements, and/or increase the leverage that consumers may have over the manufacturer. Minnesota Prescription Drug Price Transparency 28
Assessing the Effectiveness of the Act
Early Takeaways
One of the requirements of the Act is for MDH to assess its impact on three outcomes: (1)
promoting transparency in pharmaceutical pricing, (2) enhancing Minnesota’s understanding of
pharmaceutical spending trends, and (3) assisting the state and other payers in the management of
pharmaceutical spending.
While MDH is not yet positioned to offer definitive insights into the efficacy of the Act given the
recency of data availability and the need to validate and improve data quality and completeness,
MDH is presenting early takeaways on the first two items based on the data MDH has reviewed, the
analysis MDH has conducted, and the experience MDH has gained from observing transparency
initiatives in other states. In the coming months, MDH will assess the Act’s effectiveness more
comprehensively, including by:
Analysis of Clean Data: Working with a representative set of data for which the review has been
successfully concluded. This will likely take several months of engagement with manufacturers.
Obtaining Stakeholder Perspectives: Engaging with stakeholders—such as payers, patient
representatives, and experts—to consider their insights on the effectiveness of the Act to
accomplish the legislative goals.
In the meantime, the following are our early takeaways:
Transparency in pharmaceutical pricing in Minnesota has distinctly increased. Pharmaceutical
prices and the factors that drive pricing in the U.S. have long been shielded from public scrutiny.
Initiatives in Minnesota and other states are illuminating pricing elements (the individual elements
that contribute to the total price) and market incentives that influence drug costs in the country. As
high-quality data become available, stakeholders will be able to gain substantial new insights from:
Analyzing patterns in list prices for new drug introductions and drugs with price increases.
Assessing market competition by comparing prices of select high-cost drugs to those of
equivalent drugs available in the pharmaceutical market.
Assessing U.S. prices in the context of international prices.
Weighing the impact of price increases within the context of drug use and spending in
Minnesota.
Monitoring revenue and profits associated with certain drugs relative to certain direct spending,
such as marketing and manufacturing costs.
The impact of the Act is limited in multiple ways. Prescription drug price transparency—like all
transparency initiatives—is an essential first step to transforming systems. Price transparency
Minnesota Prescription Drug Price Transparency 29You can also read