Ministry Statistics 2020 - The Church of England
←
→
Page content transcription
If your browser does not render page correctly, please read the page content below

Ministry Statistics
2020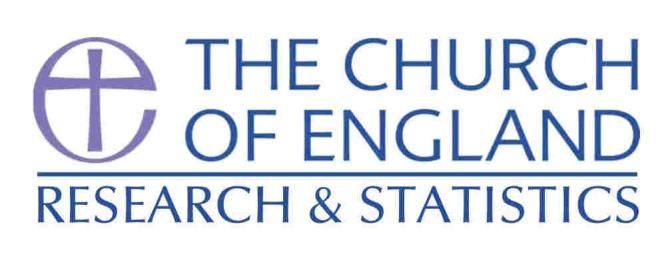
Research and Statistics
Church House
Great Smith Street
London SW1P 3AZ

Tel: 020 7898 1547

Published 2021by Research and Statistics

Copyright © Research and Statistics 2021

All rights reserved.

This document is available on line at https://www.churchofengland.org/researchandstats.
Any reproduction of the whole or any part of this document should reference: Church of England Research and Statistics, Great Smith Street, London
SW1P 3AZ

Email: statistics.unit@churchofengland.org
Twitter: @cofestats

The opinions expressed in this document are those of the authors and do not necessarily reflect the official policy of the General Synod or The National
Church Institutions of the Church of England.

                                                                                                                                                           1
Summary
At the end of 2020 there were nearly 20,000 active clergy serving in the Church of England, around 7,000 of whom are likely retired clergy continuing to
serve. This report explores various characteristics of those clergy, including gender, age, ethnicity, working hours and roles.
2020 at a glance:
7,670 stipendiary clergy; 330 of whom were ordained during 2020
2,880 self supporting clergy in parochial posts; 250 of whom were ordained during 2020
1,030 ordained chaplains (e.g. in health care, education, the armed forces and prisons) and 980 ordained clergy
in 'other' posts (e.g. working for National Church Institutions (NCIs))
7,210 clergy with Permission to Officiate (mostly retired clergy continuing to serve)
580 ordinands began training in 2020
7,590 Readers / Licensed Lay Ministers in active ministry, with a further 230 entering training during 2020
7,730 Oblates, Tertiaries, Associates or Outer Brothers/Sisters reported across 60 religious communities, with
recognised communities reporting a further 280 members
2All ordained ministers (nearly 20,000 in total)
• A third (33%) of those in ordained ministry in 2020 were female, which has continued the gradual increase in the proportion of women (28% in
2016).
• The average (mean) age in 2020 of stipendiary clergy was 52.5 years; self supporting ordained ministers (including ordained local ministers) were
aged, on average, 62.3 years; and those with Permission to Officiate (PTO) were on average 74.9 years old.
• The total number of stipendiary clergy dropped slightly during 2020.
• Women made up 32% of stipendiary ministers in 2020, which has increased gradually from 28% in 2016.
• Over a quarter (27%) of stipendiary clergy in senior posts (including Archbishop, Diocesan or Suffragan Bishop, Cathedral Dean, other Cathedral
clergy such as residentiary canons and Archdeacon) in 2020 were female, an increase from 21% in 2016.
• In 2020, as in recent previous years, 91% of stipendiary clergy were full time and 94% of stipendiary clergy worked in parochial roles.
Ordinations in 2020 (570 in total)
• In 2020 more females (55%, up from 51% in 2019) were ordained than males (45%).
• The average (mean) age at ordination to deacon in 2020 was 45.9 years - higher for females (48.6 years) and lower for males (42.3 years).
• In 2020, 57% of ordinations were to stipendiary posts, a drop on the previous 4 years
• For stipendiary ordinations, the average age in 2020 was 40.3 years, whilst for self supporting ordinations it was 54.8 years, similar to the last few
years for stipendiary ordinations, but a slight decrease in age for self supporting ordinations.
• 8.9% of stipendiary clergy ordained in 2020 were from a UK Minority Ethnic (UKME) background
Ordinands beginning training in 2020 (580 in total)
• In 2020, as in the previous 2 years, more females than males began training (54% females, 46% males).
• Nearly a quarter (23%) of all ordinands beginning their training in 2020 were aged under 32, and nearly two fifths (39%) were aged under 40.
• The average age at the beginning of training in 2020 was 42.9 years; this has ranged between 41 and 43 over the previous 5 years.
• Those training with the intention of stipendiary ministry made up nearly three quarters (72%) of all ordinands beginning training in 2020, similar to
the 73% in 2019.
• The increase in ordinands between 2019 and 2020 was found in both those training for stipendiary and self supporting ministries.
• 10.9% of ordinands beginning training in 2020 identified themselves as from UK Minority Ethnic (UKME) backgrounds, which is higher than the
proportion found in the current pool of stipendiary clergy (4.1% identifying as UKME, though note the proportion of missing data is much higher for
this group).
3Retirements (320 in total during 2020)
• The equivalent of 4.3% of the number of stipendiary clergy at the beginning of 2020 retired during 2020 (comparable to previous years).
• The average age of clergy retirement in 2019 was 66.2 years, comparable to 2019.
Impact of the pandemic
• In 2020, the numbers of ordinations, retirements, and movements between roles were remarkably similar to recent years and there was growth in
the number of new ordinands from 2019, demonstrating the creativity and resilience shown by ministers, theological institutions and the local,
diocesan and national church.
Contents
Summary .............................................................................................................................................................................................................................................................................. 2
Contents .............................................................................................................................................................................................................................................................................. 4
Acknowledgements ........................................................................................................................................................................................................................................................... 8
Introduction ........................................................................................................................................................................................................................................................................ 8
Total Ordained Ministry .................................................................................................................................................................................................................................................. 9
Figure 2: Age profile of licensed ministers, by individual age and banded age (2020) ............................................................................................................................10
Figure 3: Beneficed posts, by rural / urban categories and gender (2020) ...............................................................................................................................................11
Figure 4: Stipendiary clergy by rural / urban categories, part time / full time, and gender (2020) .....................................................................................................12
Proportion of stipendiary clergy working part-time ......................................................................................................................................................................................12
Trend data ....................................................................................................................................................................................................................................................................13
Movements between stipendiary, self supporting and other ministries ........................................................................................................................................................14
Figure 6: Movements between stipendiary and self supporting or other ministries (between 1st January 2020 and 31st December 2020) .........................14
Ordinands beginning training in 2020.....................................................................................................................................................................................................................15
Figure 7: Ordinands beginning training, by intended type of ministry (2016 to 2020) Figure 8: Ordinands beginning training, by intended role and
gender (2016 to 2020) 15
4Ordinations in 2020....................................................................................................................................................................................................................................................17
Figure 11: Number of ordinations, by stipendiary / self supporting and gender (2016 to 2020) ........................................................................................................17
Stipendiary Clergy ...........................................................................................................................................................................................................................................................18
Roles...............................................................................................................................................................................................................................................................................18
Figure 12: Overview of stipendiary clergy roles, by gender (2020) Figure 13: Parochial stipendiary clergy roles, by gender and part time / full time
(2020) 18
Job changes ...................................................................................................................................................................................................................................................................19
Table 1: Job changes by role, by proportion of all those that changed role between 2019 and 2020 ..............................................................................................19
Multiple roles ...............................................................................................................................................................................................................................................................20
Table 2: Additional roles of stipendiary clergy (2020)...................................................................................................................................................................................20
Ethnicity .........................................................................................................................................................................................................................................................................21
Figure 14: Stipendiary clergy by ethnic group (2012 and 2020) .................................................................................................................................................................21
Retirement ....................................................................................................................................................................................................................................................................22
Figure 15: Stipendiary clergy retirees, by age (2017 to 2020) .....................................................................................................................................................................22
Self supporting clergy ......................................................................................................................................................................................................................................................23
Diocesan figures ...............................................................................................................................................................................................................................................................23
Ordained Chaplains .........................................................................................................................................................................................................................................................24
Figure 16: Breakdown of types of Chaplain (2020) ........................................................................................................................................................................................24
Lay Ministry .......................................................................................................................................................................................................................................................................25
Readers / Licensed Lay Ministers (Readers) .........................................................................................................................................................................................................25
Figure 17: Active Readers / Licensed Lay Ministers and those in training, by age and gender (2020) ...............................................................................................26
Licensed lay Ministers (other than Readers) ........................................................................................................................................................................................................27
Authorised, commissioned or locally recognised lay ministries ......................................................................................................................................................................28
Religious Communities ...................................................................................................................................................................................................................................................30
5Figure 21: Recognised religious communities, by members (2020) Figure 22: Recognised religious communities, by size (2020) ...................................30
Figure 23: Oblates, Tertiaries, Associates or Outer Brothers/Sisters; or members who share a common Rule of life of Recognised and Acknowledged
Communities (2020) ..............................................................................................................................................................................................................................................31
Ordination of women resolutions ...............................................................................................................................................................................................................................32
Figure 24: Resolutions under the House of Bishops’ Declaration on the Ministry of Bishops and Priests (2020) .........................................................................32
Appendix 1: Data tables .................................................................................................................................................................................................................................................33
Table 3: Total number of ordained ministers, by gender (2020) ................................................................................................................................................................33
Table 4: Age profile of ordained licensed ministers, by age band (2020) .................................................................................................................................................34
Table 5: Average age of ordained licensed ministers (in years), by gender (2020) ................................................................................................................................34
Table 6: Proportion and average age (in years) of ordained beneficed posts, by rural / urban categories and gender (2020) ...................................................35
Table 7: Proportion of all stipendiary ordained beneficed posts, by rural / urban and part time / full time (2020) ......................................................................35
Table 8: Active ordained ministers by gender (2016 to 2020) ....................................................................................................................................................................36
Table 9: Number of ordinands beginning training, by intended role and gender (2016 to 2020) .....................................................................................................37
Table 10: Number of ordinands beginning training, by intended type of ministry and gender (2016 to 2020) ..............................................................................37
Table 11a: Number of ordinands beginning training by age and gender (2016 to 2020) .....................................................................................................................38
Table 11b: Number of ordinands beginning training by age and gender (2020) with alternative age groupings .............................................................................39
Table 12: Ethnic group of ordinands beginning training (2020) ...................................................................................................................................................................40
Table 13: Number of ordinations of stipendiary clergy by age and gender (2016 to 2020) ................................................................................................................41
Table 14: Number of ordinations of self supporting clergy by age and gender (2016 to 2020) .........................................................................................................42
Table 15: Stipendiary clergy roles by gender and full or part time (2020) ...............................................................................................................................................43
Table 16: Proportion of Stipendiary clergy by ethnicity and role (2012 and 2020) ..............................................................................................................................44
Table 17: Number of Stipendiary clergy retirees in 2020 by age and new roles by the end of 2020 ................................................................................................45
6Table 18: Movements between stipendiary and self supporting or other ministries (between 1st January - 31st December 2017, 2018, 2019 and 2020) ,
....................................................................................................................................................................................................................................................................................46
Table 19: Number of types of ordained chaplain, by gender (2020) ........................................................................................................................................................47
Table 20: Number and proportion of Readers / Licensed Lay Ministers (Readers), by gender (2020) ............................................................................................48
Table 21: Number of Readers and Licensed Lay Ministers (Readers), by age and gender (2020) ....................................................................................................48
Table 22: Proportion of Readers / LLMs and Readers in Training, by ethnic group (2020).................................................................................................................49
Table 24: Number of members of Recognised religious communities, by member type and gender (2020) ..................................................................................50
Table 25: Number and proportion of Oblates, Tertiaries, Associates or Outer Brothers/Sisters; or members who share a common Rule of life of
Recognised and Acknowledged communities (2020) ....................................................................................................................................................................................50
Table 26: Resolutions under the House of Bishops’ Declaration on the Ministry of Bishops and Priests .......................................................................................51
Appendix 2: Methodology .............................................................................................................................................................................................................................................52
Data sources: Ordained Ministry ............................................................................................................................................................................................................................52
Stipendiary clergy....................................................................................................................................................................................................................................................52
Self supporting clergy and PTO/LTO.................................................................................................................................................................................................................52
Other clergy.............................................................................................................................................................................................................................................................53
Main posts ................................................................................................................................................................................................................................................................53
Data sources: Ordinands beginning training .........................................................................................................................................................................................................53
Data sources: Readers ...............................................................................................................................................................................................................................................53
Data sources: Ordination of women resolutions................................................................................................................................................................................................54
Data sources: Religious communities.....................................................................................................................................................................................................................54
Appendix 3: Definitions and Abbreviations ...............................................................................................................................................................................................................54
7Acknowledgements
This report contains information provided by a number of people across the National Church Institutions (NCIs), diocesan and Bishops’ offices, and the
wider church community, to whom we are very grateful. This includes, but is not limited to, Wardens of Readers, Bishops’ PAs and chaplains, members of
religious communities, Crockford’s, Central Readers’ Council and colleagues in National Ministry Team.
Introduction
Ministry Statistics 2020 provides a snapshot of people who were serving the Church of England in ordained and some licensed lay roles, serving in religious
communities, or were training to become ordained clergy as at the end of 2020. Tens of thousands more serve in lay ministries across the church. The
Research and Statistics unit with a team of others from across the church gathered statistics on these ministries through the Lay Ministry Data Project; the
Lay Ministry report is available at https://www.churchofengland.org/about/research-and-statistics/key-areas-research#ministry-statistics.
This year in particular, the overview in this report is based on a complex and varied set of ministries. Each individual featured in this report will have a
unique story of how they lived out their ministry during 2020 and in order to bring these unique situations together, individuals are categorised into groups
based on their main role. In many cases individuals have multiple responsibilities and their responsibilities in 2020 may have varied from their “usual” role,
however these subtleties unfortunately cannot be expressed in these statistics. This report does, however, provide a consistent measure with previous
reports found on the Research and Statistics web page (https://www.churchofengland.org/researchandstats.) to see how ministry has changed since 2012.
At the time of writing it is unknown what impact the pandemic has and will have on future ministry in the Church of England, therefore projections have
not been included this year. However, it is noteworthy how similar the 2020 ministry statistics are to 2019 in terms of ordinations, retirements and
movements between roles, and that there was a rise in the number of candidates recommended to train for ordained ministry in this context; all of which
was driven by the creativity and resilience shown by ministers, theological institutions and the local, diocesan and national church.
All data tables in this report contain figures rounded to the nearest 10 people, unless otherwise stated. Percentages and totals are calculated from
unrounded data, meaning totals may not add up to the sum of rounded data. This report looks at national figures for all measures; Excel tables containing
data for individual dioceses are available on the Research and Statistics web page. More information regarding data collection and analysis can be found in
Appendix 2: Methodology. A glossary of terms is available in Appendix 3: Definitions and Abbreviations.
8Total Ordained Ministry
There were nearly 20,000 ordained ministers serving in the Church of England at the end of 2020. Over half of these clergy were self supporting or retired
(which includes Self Supporting Ordained Ministers (SSOMs) of which some are Ordained Local Ministers (OLMs), and clergy with Permission or License to
Officiate (PTO/LTO), as shown in Figure 1) and do not receive a stipend or salary from the Church Commissioners. The majority of clergy worked in a
particular church or churches, but there were just over 2,000 active ministers working in other settings such as chaplaincy, theological colleges and
diocesan roles. Within the 20,000 ordained ministers are around 150 Distinctive Deacons1. Although only a third of all active ordained ministers were
female, they made up half of all self supporting ministers.
The full breakdown of ordained clergy, including percentages of each type of ordained ministry by gender, can be found in Table 3 in Appendix 1.
Figure 1: Total ordained ministry, by gender (2020)2, 3
Stipendiary
Self Supporting Ordained Ministers (SSOMs) total, of which:
- Ordained Local Ministers (OLMs)
Permission or Licence to Officiate (PTO/LTO)
Chaplains
Other
0 1,000 2,000 3,000 4,000 5,000 6,000 7,000 8,000 9,000
Female Male Number of ordained clergy
1
Data provided through a data audit of Distinctive Deacons.
2During 2020, a data audit was undertaken of Crockford’s data, specifically those with Permission to Officiate (PTO) in preparation for migration to the national register of clergy. As a result
of this, data suggest a decrease in those with PTO compared to previous years, but this decrease is most likely to be due to increased data quality and should not necessarily be used for
direct comparison with data from previous years.
3Self Supporting Ordained Ministers (SSOMs) are the total of clergy that would previously have been known in previous reports as Non Stipendiary Ministers (NSMs), and Ordained Local
Ministers (OLMs).
9The average (mean) age of stipendiary clergy was 52.5 years, and of self supporting ordained ministers (SSOMs including OLMs) clergy was 62.3 years. The
age profile graphs in Figure 2 clearly indicate that a large number of those active clergy with Permission or Licence to officiate (LTO/PTO) were doing so
after retirement (i.e. aged 66 or older), with the average age being 74.9, whilst those in receipt of a stipend tended to be of working age (i.e. younger than
65).
All data, including average age by gender, are available in Table 4 and Table 5 in Appendix 1.
Figure 2: Age profile of licensed ministers, by individual age and banded age (2020)
500 2,200
2,000
450
1,800
400
1,600
350
Number of clergy
1,400
Number of clergy
300 1,200
250 1,000
800
200
600
150
400
100
200
50 0
0
27 31 35 39 43 47 51 55 59 63 67 71 75 79 83 87 91 95 99 103 Age
Age
Chaplain LTO or PTO SSOMs
Chaplain LTO or PTO SSOMs Other Stipendiary Other Stipendiary
10Three fifths (62%) of stipendiary beneficed roles (these are roles such as incumbents/incumbent status and assistant or associate curates/ministers) were
based in urban areas. This contrasts with a smaller majority of self supporting posts (57%) in urban areas. For comparison, 55% of all benefices and around a
third of parishes in England are in urban areas. For the purposes of this report, whether a clergyperson is urban or rural-based is determined by the
location of their main role, as reported on the Church Commissioners’ payroll or Crockford’s, with each person being included just once, and therefore
does not take into account additional roles.
Figure 3: Beneficed posts, by rural / urban categories and gender (2020)
Base: Beneficed clergy where urban/rural data were available. Self
supporting (male: 1,200, female: 1,330). Stipendiary (male: 4,600;
Self supporting
Male
female: 2,170)
Female
Rural
Male
Stipendiary
Urban
Female
0% 20% 40% 60% 80% 100%
% of clergy
When broken down by gender, as shown in Figure 3, male stipendiary posts were most commonly in urban areas (65%) whilst female posts (both
stipendiary and self supporting) were more evenly split between urban and rural areas. Clergy in rural posts were more likely to be older and more likely to
be female than those in urban posts, for both stipendiary and self supporting roles.
11Figure 4: Stipendiary clergy by rural / urban categories, part time / full time, and gender (2020)
Full time (91%) Part time (9%)
Figure 4 shows a breakdown of all
stipendiary clergy by their gender, working
hours (full time / part time) and location
(urban / rural). Working hours were
determined based on the stipend of the
clergyperson, as recorded on the Church
Rural Female Rural Male Urban Female Urban Male
Commissioners’ payroll. The stipend may
be for a single, full time role but it also may
be for multiple part time roles which are
added up to make a full time equivalent
(FTE). Therefore, essentially, the working
hours have been determined by the sum of 0% 10% 20% 30% 40% 50% 60% 70% 80% 90% 100%
all of a clergyperson’s stipendiary roles.
Note that this means non stipendiary roles are not included or where clergy couples share a stipend only one FTE will be counted although in reality it is
recognised that considerably more hours are often worked by both partners.
Whether they are urban or rural-based is based on the urban / rural status of the benefice in which their main role sits and does not take into account
additional and/or non-paid roles.
Proportion of stipendiary clergy working part-time
The majority of stipendiary clergy worked full time (91%), as shown in Figure 4, with part time making up a small proportion of the total (just 9%).
However, as explained above, those working part time may have non stipendiary roles that make up their working hours to full time. Males accounted for
the majority of full time posts, particularly those that worked in urban areas (accounting for 42% of all stipendiary clergy). Those in part time roles were
equally likely to be found in either rural or urban posts. All data are available in Table 6 and Table 7 in Appendix 1.
12Trend data Figure 5: Active ordained ministers (2016 to 2020) 4
As shown in Figure 5, the total 9,000
number of clergy in stipendiary
posts has seen a marginal drop over 8,000
recent years. There are slightly
more self supporting clergy and 7,000
chaplains in 2020 than in 2019. The
figures for PTO have been 6,000
Number of clergy
undergoing substantial quality
assurance over the last few years, 5,000
which could account for the
changes. Please see the Appendix 2: 4,000
Methodology for more information.
Data broken down by gender is 3,000
available in Table 8 in Appendix 1.
2,000
1,000
0
2016 2017 2018 2019 2020
Year
Stipendiary Self Supporting Ordained Ministers (SSOMs) total
Permission or Licence to Officiate (PTO/LTO) Chaplains
Other
4During 2020, a data audit was undertaken of Crockford’s data, specifically those with Permission to Officiate (PTO) in preparation for migration to the national register of clergy. As a result
of this, data suggest a decrease in those with PTO compared to previous years, but this decrease is most likely to be due to increased data quality and should not necessarily be used for
direct comparison with data from previous years.
13Movements between stipendiary, self supporting and other ministries
Each year a number of clergy move between different types of ministry. This could be through ordination or retirement, or through moving between
different forms of ministry. Figure 6 reveals the net impact of these changes for those clergy on the Church Commissioners’ payroll only5. The net change is
calculated by taking those leaving through a certain route away from those joining via the same route (where applicable), resulting in an overall (net)
increase or decrease. For 2020, there was a small net decrease of around 50 clergy in stipendiary ministry. The movements in 2020 were similar to those in
previous recent years.
A full breakdown of movements can be found inTable 18 in Appendix 1.
Figure 6: Movements between stipendiary and self supporting or other ministries (between 1st January 2020 and 31st December 2020)
Ordination
Other or unpaid parochial role
Other ministerial role
LTO or PTO
Death
Chaplaincy
Active retirement
Retirement (no role)
Unknown
-300 -200 -100 0 +100 +200 +300 +400
Net increase Net decrease
5Includes only those stipendiary clergy on the Church Commissioners’ payroll, therefore not all data add up to figures elsewhere in this report (for example, ordination data elsewhere in this
report also includes those in the Diocese in Europe, Sodor and Man, the Channel Islands, and Bishops’ Chaplains). It also does not include clergy on the NCIs payroll.
14Ordinands beginning training in 2020
At the end of 2020, there were 580 ordinands from the 2020/21 academic intake6, which is comparable to the 2018 figure after a slight fall in 2019. There
were again more females (54%) than males (46%) beginning training in 2020, a proportion very similar to the previous two years. Those training with the
intention of stipendiary ministry made up nearly three quarters (72%) of all ordinands beginning training in 2020, similar to the 73% in 2019, since the
increase in ordinands between 2019 and 2020 was found in both those training for stipendiary and self supporting ministries, as shown in Figure 7.
Figure 7: Ordinands beginning training, by intended type of ministry (2016 to 2020)7 Figure 8: Ordinands beginning training, by intended role and gender
(2016 to 2020)
600
450
Number of ordinands beginning training
400 500
Number of ordinands beginning training
350
400
300
300
250
200 200
150
100
100
0
50
2016 2017 2018 2019 2020
0 Year beginning training
2016* 2017 2018 2019 2020
Year beginning training Incumbent roles: Female Incumbent roles: Male
Assistant roles: Female Assistant roles: Male
Stipendiary Self supporting
6All ordinands in this section are those that began their course in September of the given year, as counted at end of December in the given year. Therefore, any that left training between
September and December are not included.
7
2016* excludes 2 unknown
15Those training with the intention of becoming incumbents made up nearly three quarters of all ordinands (78%) in 2020, as shown in Figure 8; an increase
on 2016 (75%). The proportion of those training for incumbent roles who were women remained steady at 38% in 2020.
Of those beginning training in 2020 who reported their ethnicity, 10.9% identified themselves as from a UK Minority Ethnic background (UKME)8, as shown
in Figure 9. This is a noticeable increase on 7.8% in 2019, and continues the trend of increase seen in recent years. It is important to note that 1% of all
ordinands beginning training in 2020 did not declare their ethnic group (not included in Figure 9). Of those identifying as UKME, the most commonly
declared ethnic group was Black (5.2%), followed by those identifying as Asian (accounting for 2.4% of all ordinands that declared an ethnic group).
Figure 9: Ordinands beginning training, by ethnic group (2020)9 Figure 10: Age profile by gender of ordinands beginning training (2020)
60
Number beginning training in 2020
50
Chinese 40
0.5%
Mixed
1.7% 30
Black Any 20
White UKME
5.2% Other
89.1% 10.9%
1.0% 10
Asian 0
2.4% Under 25-29 30-34 35-39 40-44 45-49 50-54 55-59 60-64 65-69 70+
25
Age at start of training (grouped)
Female Male
8 UKME includes all Black, Asian, Chinese, Mixed/Multiple ethnicities and other backgrounds, and excludes any White background.
9 Percentages do not include those who did not declare an ethnic group (2.7% of all ordinands beginning training in 2019).
16Nearly a quarter (23%) of all ordinands beginning their training in 2020 were aged under 32 (or 32% for just those training for stipendiary minsitry), and
nearly two fifths (39%) were aged under 40 (or 52% for just those training for stipendiary ministry). As highlighted in Figure 10, again, the average age of
those entering training in 2020 differed between genders with females slightly older at 45.7 years and males younger at 39.6 years (the average age overall
being 42.9 years).
Data tables, including ethnic background, age, gender, role and data for previous years are included from Table 9 to Table 12 in Appendix 1.
Ordinations in 2020
In 2020, there were around 570 people ordained as deacon, similar to 2019 (Figure 11). The proportion of ordinations to stipendiary posts was 57% in
2020, a drop on the last four years as shown in Figure 11. The ratio of female to male ordinations continued to rise in 2020 with 52% of clergy ordained to
stipendiary posts being male and 35% of clergy ordained to self supporting posts being male, compared to 60% and 40% respectively in 2016. The average
age of ordination for stipendiary clergy was 40.3, similar to the last few years. For self supporting clergy the average age at ordination was 54.8, a little
younger than in the recent few years. 8.9% of stipendiary clergy ordained in 2020 were from a UKME background. All data can be found in Table 13 and
Table 14 in Appendix 1.
Figure 11: Number of ordinations10, by stipendiary / self supporting and gender (2016 to 2020)
600
Number of deacons ordained
500
400
300
per year
200
100
0
2016 2017 2018 2019 2020
Year of ordination
Stipendiary clergy: Female Stipendiary clergy: Male Self supporting clergy: Female Self supporting clergy: Male
10 Refers to the ordination of deacons.
17Stipendiary Clergy
This section considers in more depth the 7,700 stipendiary clergy serving across the Church of England. All analyses in this section include clergy in receipt
of a stipend from the Church Commissioners’ payroll, but for some it also includes stipendiary clergy from the Diocese in Europe, Sodor and Man, and the
Channel Islands, and Bishops’ Chaplains – data included are outlined at the start of each analysis. Note that clergy paid a stipend locally or through other
funding sources are not included.
Roles
Of all stipendiary clergy, the majority (94%, as shown in Figure 12) worked in parochial roles across the 12,500 parishes in the Church of England. Figure 13
breaks down these parochial roles further (incumbents, incumbent status clergy or as assistant ministers and curates), showing that all stipendiary roles
were more likely to be undertaken by males working full time than females or males working part time.
Figure 12: Overview of stipendiary clergy roles, by gender (2020) Figure 13: Parochial stipendiary clergy roles, by gender and part time / full time (2020)
Non Non Senior staff Senior
parochial parochial Female, 1% staff
Female, Male, 1% Male, 4% Incumbent
0.2%
Incumbent status
Parochial
Female,
30%
Assistant minister or curate
Of this 94%
Parochial parochial...
Male, 64% 0 500 1,000 1,500 2,000 2,500 3,000 3,500 4,000 4,500
Number of stipendiary clergy, by role
Female: Full time Male: Full time Female: Part time Male: Part time
18Just over a quarter (27%) of clergy in senior posts (including Archbishop, Diocesan or Suffragan Bishop, Cathedral Dean, Cathedral Other and Archdeacon)
were female, similar to 2019. Female clergy were more likely to be in part time roles than male clergy. All data can be found in Table 15 in Appendix 1.
Job changes
At the end of 2020, of the 7,480 stipendiary clergy on the Church Commissioners’ payroll (i.e. excluding those in the Diocese in Europe, Sodor and Man,
the Channel Islands, and Bishops’ Chaplains), 9% had changed jobs between the end of 2019 and the end of 2020, down from 11% in the previous year. Of
those who had changed jobs in 2020, nearly a third (30%) had moved to a different diocese and nearly two fifths (38%) were female.
As shown in Table 1, over two fifths (41%) of the job moves during 2020 were incumbents or incumbent status clergy moving to other incumbency roles,
and a third (33%) were assistant curates or associate ministers moving into incumbency roles. Note that data include all clergy ordained at deacon level, so
the majority of these are likely to be assistant curates moving into incumbency roles following the end of their training.
Table 1: Job changes by role, by proportion of all those that changed role between 2019 and 2020
To (end of 2020)
Assistant
Incumbent / curate /
Senior staff
status associate
From (end of 2019) minister
Senior staff 1%Multiple roles
The analysis in this report counts clergy in what can be considered their main role; as was the case in previous years, over 2,100 (28%) of all stipendiary
clergy had multiple roles, as shown in Table 2.
These roles may be additional parochial posts, though it must be noted that around half of benefices have more than one church so a large number of
parochial clergy with one role might well have multiple churches or parishes under their care. At least 170 stipendiary clergy had additional chaplaincy roles,
though again this is likely to be an undercount due to the informal nature of chaplaincy work in many settings, for example the many clergy who work
closely with local schools, police forces and care settings.
Table 2: Additional roles of stipendiary clergy (2020)
% of all
Number of
In addition to their main role: stipendiary
stipendiary clergy
clergy
Parochial roles 1,170 19%
Chaplains 170 2%
LTO or PTO 130 2%
Senior staff (e.g. cathedral role) 30Ethnicity
As shown in Figure 14, 4.1% of the stipendiary clergy on the Church Commissioners’ payroll (i.e. excluding those in the Diocese in Europe, Sodor and Man,
the Channel Islands, and Bishops’ Chaplains) at the end of 2020 who reported an ethnic group described themselves as being from a UK Minority Ethnic
(UKME)12 background. This is an increase from 3.1% at the end of 201213, and continues the gradual increase year on year. However, 25.9% of ethnicity
data are missing in 2020, which makes it difficult to measure change accurately. We hope that the advent of the People and Data system will help with
improving the situation in future years.
All data can be found in Table 16 in Appendix 1, including breakdowns by role.
Figure 14: Stipendiary clergy by ethnic group (2012 and 2020) 14
2012 2020
Mixed
1.0% Asian Mixed
Asian 0.8% 1.4%
0.7%
White UKME Chinese
0.1% White UKME
96.9% 3.1% 95.9% 4.1% Chinese
0.2%
Any Other
Group
0.1% Any Other
Black Black Group
1.2% 1.6% 0.2%
12 UKME includes all Black, Asian, Chinese, mixed and other backgrounds, and excludes any White background.
13
2012 is chosen as the comparison year as the data were most complete
14 Percentages do not include those who did not declare an ethnic group (2012 – 20.6%, 2020 – 25.9%).
21Retirement
Figure 15: Stipendiary clergy retirees, by age (2017 to 2020)
Of the stipendiary clergy on the Church
Commissioners’ payroll at the end of 2019, (i.e.
excluding those in the Diocese in Europe, Sodor
and Man, the Channel Islands, and Bishops’
Chaplains), around 320 had retired by the end
of 2020, which is the equivalent of 4.3% of the
stipendiary clergy on the Church
Commissioners’ payroll at the beginning of
2020. This is comparable to recent previous
years.
Figure 15 illustrates that retirement patterns
remained similar in 2020 when compared to
previous years. In 2020 the average age at
retirement was 66.2 years, comparable to 2019.
Around a third (34%) of stipendiary clergy who
retired during 2020 were licensed in some
other role at the end of the year, though based
on previous patterns it is likely that many of the
remaining 66% of retirees will take up roles
during the course of 2020 – a full breakdown of
these can be found in Table 17 in Appendix 1.
22Self supporting clergy
At the end of 2020, a total of 2,880 clergy worked in parochial posts in self supporting roles (including 300 ordained local minister posts). The majority of
these individuals work with stipendiary clergy, but in a number of cases self supporting clergy hold incumbent status roles and/or are working in benefices
with no stipendiary clergy either due to vacancy or deployment decisions.
At the end of 2020, 240 (8% of all self supporting clergy) were listed in Crockford’s as being licensed to incumbent status roles whilst 720 (25% of all self
supporting clergy) were licensed to benefices with no stipendiary clergyperson licensed to the same benefice. Data on self supporting clergy are not always
accurate and exhaustive, hence it is not possible to break down further the data as is done with data for stipendiary clergy in this report.
Diocesan figures
Diocesan figures are available via an excel table that can be downloaded from the Research and Statistics pages of the Church of England website
(https://www.churchofengland.org/researchandstats).
Figures include diocesan full time equivalence (FTE), headcounts of stipendiary clergy, headcounts of self supporting clergy, along with national age profiles
of all roles.
23Ordained Chaplains
Industrial Figure 16: Breakdown of types of Chaplain (2020) 15
University/polytechnic chaplain
chaplain or assistant 1% Hospital/hospice Over 1,000 ordained clergy reported their main post as chaplain on Crockford’s.
chaplain chaplain or
assistant chaplain This is in addition to the 170 stipendiary clergy who reported additional chaplaincy
Prison chaplain 9%
30% roles (see Table 2). It should be noted that many other clergy may have additional
or assistant
chaplain chaplaincy roles for which we do not have data, and so the total number of Church
10%
of England clergy who work as chaplains is likely to be higher. Further research
regarding chaplains in the Church of England has been published by Todd et al
(2014)16, Ryan (2015)17 and Aune et al (2019)18. The Research and Statistics team
School chaplain
or assistant have conducted a pilot survey in 2019 to explore how further data on chaplaincy,
chaplain both ordained and lay, might be collected and hope to build on this in the future.
15%
See the chapter on Lay Ministry in this report for information known about
licensed lay chaplains.
Other chaplain None of the 1,030 chaplains in this section, whose main role was listed as a
Armed forces
or assistant chaplain
chaplain 19%
chaplain, appear in the Church Commissioners’ clergy payroll and so we know they
16% are not paid a stipend by the Church Commissioners. However, we are unable to
determine whether they are self supporting or paid a salary from another source.
The gender profile of clergy whose main role is as a chaplain is similar to that of stipendiary clergy, with 68% male. As Figure 16 shows, amongst those
whose main role is a chaplain, the most common type of chaplaincy undertaken is in a hospital or hospice; this accounted for 30% of all chaplain roles in
2020, as was the case in previous years. The armed forces (Army, Royal Navy or Royal Air Force) accounted for a quarter (25%) of all male chaplains,
15 Data source: Crockford’s
16 Todd, Slater and Dunlop (2014) ‘The Church of England’s involvement in chaplaincy: research report for the Church of England’s Mission and Public Affairs Council.’ Cardiff: Cardiff Centre
for Chaplaincy Studies. Accessed 28/06/2018
17 Ryan, Ben (2015) ‘A Very Modern Ministry: Chaplaincy in the UK.’ London: Theos. Accessed 28/06/2018
18
Aune, Guest and Law (2019) ‘Chaplains on Campus: Understanding Chaplaincy in UK Universities’ https://www.churchofengland.org/sites/default/files/2019-
05/chaplains_on_campus_full_report_final_pdf_.pdf
24whilst just 4% of female chaplains work in these roles. Of all those chaplains that work in the armed forces, 93% were male. Full gender breakdowns can be
found in Table 19 in Appendix 1.
Lay Ministry
Tens of thousands of lay people serve the church in various ministries from youth workers to worship leaders. One of the groups of lay ministers we have
best data about are Readers and Licensed Lay Ministers (Readers), who are lay leaders in the Church of England theologically trained and licensed by the
Church to preach, teach, enable mission, lead worship and assist in pastoral, evangelistic and liturgical work. For the first time this year additional data were
collected for other licensed ministries, including licensed lay workers, chaplains, pioneers, church army evangelists and evangelists.
To help understand the gap in data for other lay ministries (authorised, commissioned or locally recognised), The Lay Ministry Data Project was run
between 2018 and 2020, which included a survey to all diocesan offices and cathedrals. The full report can be viewed here
https://www.churchofengland.org/about/research-and-statistics/key-areas-research#ministry-statistics, and a few highlights are provided in this report.
Whilst the Lay Ministry Data Project was an exploratory piece of work, it is hoped that the findings will inform ongoing collection of lay ministry data to
track the scale and range of lay involvement and leadership across the Church of England.
Readers / Licensed Lay Ministers (Readers)
By the end of 2020, there were a total of 7,590 people in active lay ministry of whom 4,590 (60%) were Readers / Licensed Lay Ministers and 3,000 (39%)
had PTO. Of the Readers / Licensed Lay Ministers there were more females (56%) than males, but for those with PTO there were more males (51%) than
females. There were a further 230 Readers entering training in 2020, with a total of 520 in training at the end of 2020; 66% of whom were female. As
shown in Figure 17, Readers were most commonly female and aged between 60 and 69, and those in training were most commonly female aged between
40 and 59 years old. During 2020, a total of 390 Readers became non-active (retired emeritus), meaning a potential net loss of 170 in active ministry when
taking into account those entering training during the same year.
25Figure 17: Active Readers / Licensed Lay Ministers and those in training, by age19 and gender (2020)
Whilst it is possible to include a high-level overview
lay ministers Readers in Training
Female
of ethnic breakdown amongst Readers and Readers
in training, it should be noted that only around half
of all dioceses provided data for this measure
Male
meaning data are indicative only. Of those dioceses
that provided data (26 dioceses in total) in 2020, the
Readers Licensed
Female
vast majority of Readers and those in training were
White British, with 4.2% of Readers and 7.4% of
Male those in training identifying as UKME20. Of these,
Black or Black British accounted for the largest
proportions (3.0% of all Readers; 5.1% of all those in
Permission to
Female
Officiate
training).
Male A full breakdown of data by gender can be found in
Appendix 1, Table 20, Table 21 and Table 23.
0 500 1,000 1,500 2,000 2,500 ,000
umber of people
Less than 40 years old 40 59 years old 60 69 years old 0 years old or more
19 Some estimates were used to determine missing age breakdowns, based on the proportions of those dioceses that returned complete data.
20 UKME includes all Black, Asian, Chinese, mixed and other backgrounds, and excludes any White background.
26Figure 18 Total active Readers / Licensed Lay Ministers and those in training (2011 to 2020)
Error! Reference source not found. 10,000
shows the trend data for Readers from
9,000
2011 to 202021. There has been a gradual
decrease in the total number of Readers / 8,000
Licensed Lay Ministers in active ministry
,000
over the last decade, from just under 9,620
in 2011 to 7,590 in 2020. The number of
umber of people
6,000
readers in training at the end of each year
5,000
has decreased by two fifths (42%) from 900
in 2011 to 520 in 2020. 4,000
,000
Licensed lay Ministers (other than 2,000
Readers)
1,000
In addition to Readers, 34 dioceses
reported 410 other lay ministers/workers 0
2011 2012 201 2014 2015 2016 201 2018 2019 2020
licensed by Canon in active ministry, with a ear
further 60 in training in 10 of the
Readers Licensed lay ministers Permission To Officiate (i.e. retired, but still having an active ministry)
dioceses.22 As shown in Figure 19, just
Total in active ministry at end of year (all Readers LLMs and PTOs) Total in training at end of year
under a fifth (18%) of licensed lay
ministers/workers were chaplains, and a similar proportion were Church Army Evangelists or Evangelists (17% combined). Just over 1 in 10 (12%) were
Pioneers. 53% of those licensed by Canon were in other roles, which included Cathedral Canon, Community Minister, Funeral Minister, Licensed diocesan
staff, Liturgical Assistant, Parish Nurse, Pastoral Visitor and Spiritual Director. Nearly two thirds (64%) of those in these licensed roles were female.
A full breakdown can be found in Table 23 in Appendix 1.
21 Some data for 2017 were updated and amended during the course of data collection for 2018; Figure 19 reflects these updates and supersedes the Figure contained in the 2017 report.
22
Note many Readers also have roles as Chaplains and Evangelists, and therefore would have appeared in both categories in the LMDP which collected data by role.
27You can also read