Microbiologically confirmed tuberculosis 2004 -15 South Africa - NATIONAL INSTITUTE FOR COMMUNICABLE DISEASES
←
→
Page content transcription
If your browser does not render page correctly, please read the page content below

NATIONAL INSTITUTE FOR
          COMMUNICABLE DISEASES
  Division of the National Health Laboratory Service

Microbiologically confirmed
      tuberculosis 2004 -15
               South Africa
CONTENTS
Foreword                                                                                     2
Acknowledgments                                                                              3
Abbreviations                                                                                4
Executive summary                                                                            5
Introduction                                                                                 7
Methods                                                                                     10
Results and discussion                                                                      12
   National                                                                                 12
   Eastern Cape                                                                             21
   Free State                                                                               28
   KwaZulu-Natal                                                                            40
   Limpopo                                                                                  47
   Mpumalanga                                                                               53
   North West                                                                               59
   Northern Cape                                                                            65
   Western Cape                                                                             71
Conclusion                                                                                  77
Recommendations                                                                             79
References                                                                                  80

                         NICD - Microbiologically confirmed tuberculosis 2004-15; South Africa   1
FOREWORD

    The National Institute for Communicable Diseases (NICD) has, over the past four years, prioritised surveillance on the burden
    of tuberculosis (TB) in South Africa, particularly now that TB is the leading infectious cause of morbidity and death in South
    Africa. Such surveillance is critical to enable informed decision making, not only at national level, but also down to district
    level. This will better equip us to focus our resources on targeted interventions in communities where the burden of TB is
    greatest. Furthermore, robust longitudinal surveillance is critical to enable the evaluation of the success of the interventions
    deployed, and as a barometer to measure the progress being made in South Africa toward the goal of ending TB by 2035.
    This first report on the burden of TB in South Africa from the NICD, provides a robust assessment of the current status of TB
    in South Africa, and highlights successes of the National Department of Health and other stakeholders over the past few
    years in reducing TB in the country. Although the current year-on-year rate of decline in TB is only half of what we estimate
    is required to end TB by 2035, it is two- to three-fold higher than the reductions that have been observed globally. The
    shortcoming in meeting our targets to reduce TB in South Africa might be due to challenges in making inroads among some
    key populations. Included among these, as identified through our surveillance, are males between the ages of 25-44 years,
    among whom the reduction in incidence has lagged behind that observed in women of the same age group. We are now
    able to characterise geographic hotspots where the burden of TB is most concentrated. These need to be prioritised in our
    efforts to improve TB cure rates, as well as reduce transmission.
    The Department of Health has revised its Five Year Plan for TB (2017-2021) and measuring progress will be important. This
    current report provides a retrospective view until 2015 and is based on an even more exciting development, the online TB
    Surveillance Dashboard, which can now be used to assess trends into the future. The dashboard is publically available on the
    NICD website: www.nicd.ac.za.
    Major efforts are under way locally and globally to end TB by 2035 and the NICD will work closely with the Department of
    Health and other stakeholders to improve public health response to this killer disease and strongly promote a data-driven
    approach as highlighted in the new National Strategic Plan for HIV, TB and STIs.

    Prof. Shabir A Madhi
    Executive Director, National Institute for Communicable Diseases
    March 2017, Johannesburg

2            NICD - Microbiologically confirmed tuberculosis 2004-15; South Africa
ACKNOWLEDGMENTS
Data were provided by the Corporate Data Warehouse, National Health Laboratory Service (NHLS), Sandringham, South
Africa. We acknowledge the diligence of staff in the laboratories of the National Health Laboratory Service across South
Africa, who carried out the testing and recorded the data now being analysed for public health purposes. We are also
grateful for the efforts of the staff at the Centre for Tuberculosis, National Institute for Communicable Diseases and the
Corporate Data Warehouse who supported this work at multiple levels. We specifically thank the following individuals who
have played an important role in the conceptual development, preparation, cleaning and analysis of data used, as well as the
compilation of the final report: Nazir A Ismail, Ananta Nanoo, Sue Candy, Jaco Grobler, Jacques Rossouw, Vlad Poliakov, Linsay
Blows, Hendrik Koornhof, Chikwe Ihekweazu and Shabir A Madhi. Finally, we acknowledge the TB Cluster at the National and
Provincial Departments of Health, relevant external stakeholders and the provincial epidemiologist team at the NICD who
have supported our work over the years.

                                              NICD - Microbiologically confirmed tuberculosis 2004-15; South Africa              3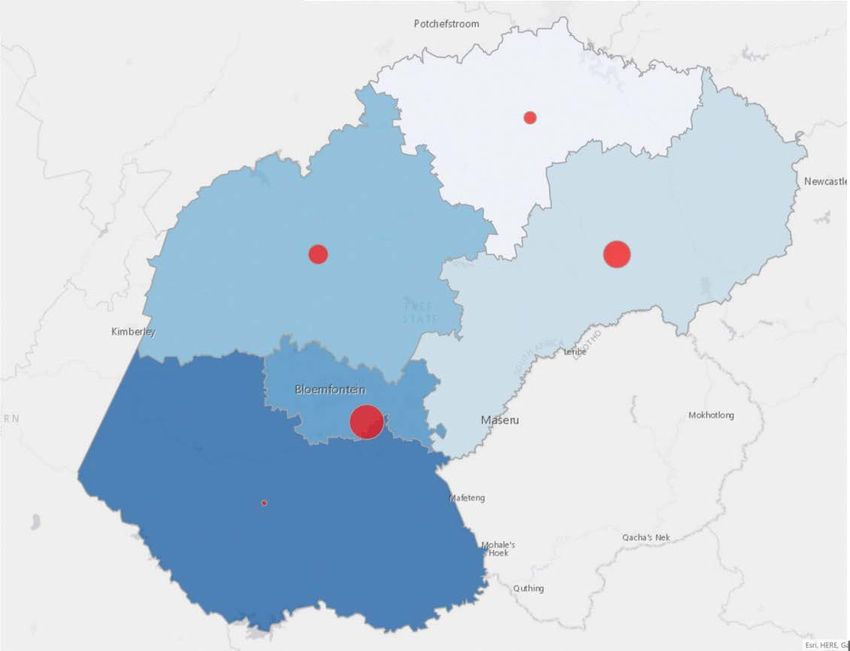
Abbreviations

    AIDS                  acquired immunodeficiency syndrome
    ART                   antiretroviral therapy/treatment
    CDW                   Corporate Data Warehouse
    CI                    confidence interval
    DOTS                  directly observed treatment, short course
    DRS                   Drug-Resistance Survey
    DST                   drug sensitivity/susceptibility testing
    DS-TB                 drug-susceptible tuberculosis
    EPTB                  Extra-pulmonary tuberculosis
    GXP                   Xpert MTB/Rif assay
    HIV                   human immunodeficiency virus
    ILTF                  initial loss to follow up
    INH                   isoniazid
    LIS                   laboratory information system
    LPA                   line probe assay
    MDR-TB                multidrug-resistant tuberculosis
    MGIT                  Mycobacterial Growth Indicator Tube
    MTB                   Mycobacterium tuberculosis
    mPTB                  microbiologically confirmed pulmonary tuberculosis
    NDoH                  National Department of Health
    NHLS                  National Health Laboratory Services
    NICD                  National Institute for Communicable Diseases
    NSP                   National Strategic Plan
    NTP                   National Tuberculosis Programme
    PDoH                  Provincial Department of Health
    PHC                   primary health clinic
    PLWHIV                people living with human immunodeficiency virus
    PTB                   Pulmonary tuberculosis
    RR-TB                 rifampicin-resistant tuberculosis
    SRL                   Supranational Reference Laboratory
    STI                   sexually transmitted disease
    TB                    tuberculosis
    WHO                   World Health Organization
    XDR-TB                extensively drug-resistant tuberculosis

4            NICD - Microbiologically confirmed tuberculosis 2004-15; South Africa
EXECUTIVE SUMMARY
South Africa is on the World Health Organization (WHO) list of priority countries in the categories of Tuberculosis
(TB), Drug Resistant Tuberculosis (DR-TB) and HIV associated TB1. In 2005, the situation seemed hopeless, as can be
inferred from the aptly titled editorial published in reference to TB control, “Are we losing the battle?”2. The period
beginning in the early 1990s saw a massive annual increase in TB and a decade later the STOP TB partnership was
established to address the escalation of this killer disease. This report by the NICD confirms the change in tide
previously reported in the Lancet Infectious Diseases journal, which shows a further decline in microbiologically
confirmed pulmonary TB (mPTB) incidence in South Africa3. This compares well with the global change in TB,
which is now showing signs of decline. The new strategy developed by the WHO is focused on ending TB and has
set revised and ambitious targets to achieve annual reductions in incidence rates and mortality4. However, even
with a 10% year-on-year reduction in TB incidence rates, as required by the WHO’s END TB strategy, more radical
changes will be required in future to control TB globally.

This report provides reason for optimism, with the year-on-year decline in mPTB incidence in South Africa since
2012, with figures of -4.8%, -6% and -4.8% for the years 2013-2015 respectively. Although this represents only
half of what is required, it exceeds the global average year-on-year reduction of 2%4. Notably, in South Africa,
KwaZulu-Natal, which carries the highest absolute burden in the country, has shown the greatest reduction over
the three-year period 2013-2015, with a year-on-year reduction averaging 10.5%. Similarly, there has been an
acceleration of the year-on-year reduction in the Free State from -2.5% in 2013, -4.8% in 2014 and approaching
-9.2% in 2015. Although the broader roll out of antiretroviral therapy (ART ) on reducing mPTB incidence has been
shown to be an important contributor; this alone will not be enough.

The new national TB Plan 2017-2021 provides a set of focused interventions to further accelerate the reduction in
TB cases in South Africa. This includes, an emphasis on initial loss to follow up and contact tracing of household
contacts, which will likely yield important short-term benefits. Additionally, the strong focus on quality
improvement as a cross cutting issue will enable sustainable achievements. The Northern Cape, however, is
an example of an area where health systems and access are key elements impacting on success. The province
demonstrates a concerning increase in mPTB incidence rates, and although it carries a relatively low absolute
number of mPTB cases, adjusting for population size, it has one of the highest rates nationally, requiring further
investigation.

A striking clue to the success and failure of the achieved reduction in incidence was observed when disaggregating
by gender. Most of the declines observed across provinces and reflected nationally have been driven by successes
achieved among females between 25-44 years of age with a 33.6% reduction between 2008 and 2015 nationally.
These statistics link closely with the large emphasis of the HIV programme, as well as greater health-seeking
behaviour among this population group. In stark contrast, the reduction among males in the same age category
was only 13.4% for the same period. Specific strategies aimed at this population group are urgently required if
South Africa is to reach its End TB goals, including targeted public messaging, increased access through men’s
health and wellness centres, and male role models. Breaking through this barrier will be challenging, but is likely
to see even greater reductions than in the past.

The observation of over three million people diagnosed with mPTB over the reporting period (2004-2015)
highlights the magnitude of the TB burden. Much like HIV, the disease is of a chronic nature, with new cases
accumulating over time. However, unlike HIV, TB is curable and the majority of the aforementioned three million
TB cases have been cured – a statistic often underappreciated. This highlights the significant and direct value
achieved by dealing with the TB epidemic effectively. Additionally, the burden of disease is heterogeneous, with
74.2% of the absolute number of cases occurring in just four provinces: KwaZulu-Natal, Gauteng, the Eastern Cape
and the Western Cape, with hotspots in the urban metropolitan areas.

                                           NICD - Microbiologically confirmed tuberculosis 2004-15; South Africa          5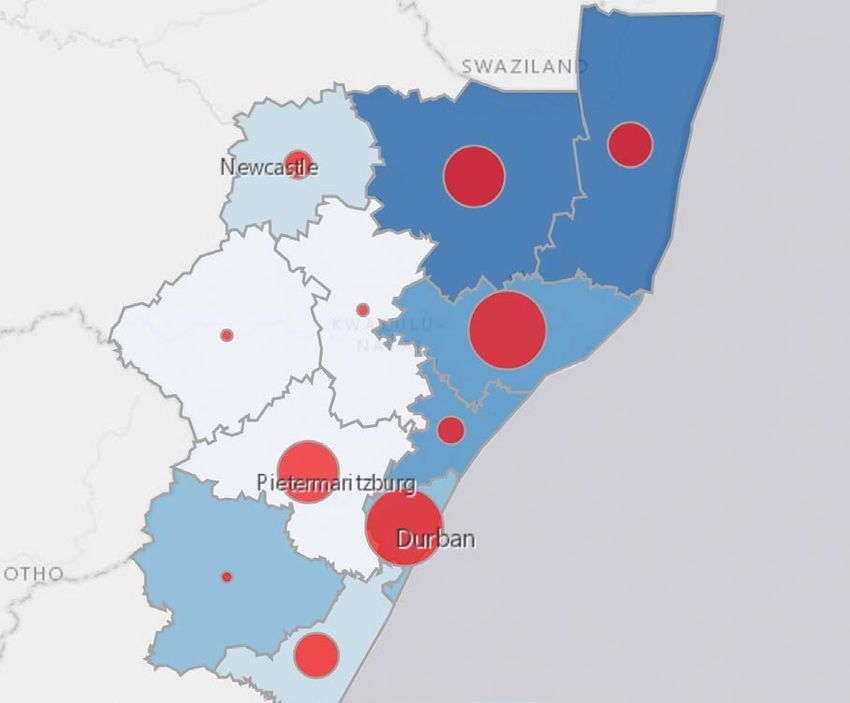
In assessing the distribution of rifampicin resistant TB, we build on the most recent TB DRS report 2012-2014 which
    highlighted Mpumalanga as the province with the highest prevalence of drug resistant TB – again confirmed in
    the current report. In addition, other high prevalence areas have been identified in KwaZulu-Natal. For both
    provinces the highest incidence occurred in districts close to the Mozambique and Swaziland borders, showing
    that greater co-operation with neighboring countries is essential to overcome the challenges faced in combating
    TB. Similar to what is observed for mPTB cases, there is considerable heterogeneity for drug resistant TB nationally,
    with KwaZulu-Natal having close to 30% of the rifampicin resistant TB burden. Identifying and targeting responses
    and providing decentralised services for the management of drug resistant TB will be important to improve
    adherence and achieve cure.

    The current report provides valuable insights that should be closely integrated into TB control planning for the
    next five years. The current report ends in 2015 and annual updates will be provided to more closely monitor the
    status of this priority disease in South Africa.

    Finally, we are greatly excited to announce the release of an online TB Surveillance Dashboard upon which this
    report is based and which will provide regular updates which cannot easily be achieved in a report format. The
    dashboard is accessible from the National Institute for Communicable Diseases’ website: www.nicd.ac.za.

6          NICD - Microbiologically confirmed tuberculosis 2004-15; South Africa
INTRODUCTION
Early hopes for the effective control of tuberculosis (TB), and even possible elimination, were thwarted by the growing human
immunodeficiency virus (HIV) co-epidemic in the early 1990s. The successful introduction of antiretroviral treatment (ART)
in South Africa and its impact on TB incidence has provided renewed hope, however TB control remains a major concern in
this country and is now the leading cause of death due to an infectious bacterial agent5. The situation in South Africa was
aggravated by the emergence of multi-drug resistant TB (MDR-TB). This included outbreaks of extensively drug-resistant TB
(XDR-TB) in KwaZulu-Natal6 and reported cases of “total” drug-resistant TB in the Eastern Cape7. Encouraging outlooks for TB
control include recent developments in the use of molecular technologies for the rapid and definitive diagnosis of TB and
drug resistance in Mycobacterium tuberculosis strains from patients8,9, as well as the prospect of the introduction of two novel
anti-TB drugs for TB treatment in the near future10.
Tuberculosis has plagued the world for centuries. Dating back to 3700 BC, the disease has been found in the vertebrae of
Neolithic man in Europe, as well as Egyptian mummies. TB was a major cause of death in Europe with a mortality rate of 500
per 100 000 people per year. Mycobacterium tuberculosis is the causative agent of TB, and is transmitted by aerosol infection
involving droplet nuclei, 1-4 µm in diameter. These infective particles are expectorated by coughing and other ways of
forced expiration by patients with active “open” pulmonary TB. After inhalation of tubercle bacilli by a susceptible individual, a
small area of bronchopneumonia develops. Some surviving TB bacilli remain viable but are dormant after primary infection,
particularly in areas of high PO2 e.g. apex of the lung, kidney, meninges, ends of long bones, vertebrae and lymph nodes.
During these events, infected persons are usually asymptomatic, but in suitably susceptible individuals, mainly children,
the TB organism causes disseminated disease, including TB meningitis, as well as various other forms of extrapulmonary TB.
Patients may progress from asymptomatic latent TB infection to active disease when immunity is suppressed as a result of a
new predisposing condition (e.g. uncontrolled HIV or diabetes) or due to immunosuppressive therapies (e.g. chemotherapy).
Re-infection among adults following exposure to an untreated active TB case is also common in high burden settings like
South Africa and contributes to the growing burden of active cases due to the high population prevalence, with a total of
6.19 million people living with HIV11.
The clinical diagnosis of symptomatic or active TB poses a challenge to healthcare workers as the typical symptoms of a
prolonged cough, fever, night sweats and loss of weight do not all occur at an early stage. A patient may present with just
a cough or night sweats which are non-specific. Additionally, among HIV infected individuals, symptoms can be minimal
making the diagnosis even more difficult. Microbiological diagnosis of TB is thus often required and is the cornerstone of
diagnosis and monitoring in TB programmes globally. Smear microscopy was and continues to be widely used but can miss
up to 50% of TB cases – especially in high HIV endemic settings. In 2011 South Africa replaced this technology, which dates
back to the early discovery of the organism by Robert Koch in 1882, with a highly sensitive and specific molecular test – the
Xpert MTB/RIF assay.
The Xpert MTB/RIF assay (GXP) has an overall sensitivity of 88% (95% CI: 70%-86%) and 79% (95% CI: 84%-92%) in HIV
positive individuals; specificity is 99% (95% CI: 98%-99%)8. The historic gold standard against which these tests are assessed
is mycobacterial culture, which is highly sensitive at detecting active TB. Even though results take up to six weeks for
finalisation, culture is still recommended for use in cases where the GXP is negative and the patient is HIV positive. The
newer version of the assay is set to change this practice. Despite these great advances in technology, some cases may not
be microbiologically confirmed, particularly in cases of extra-pulmonary TB, paediatric TB, and also adult TB patients who
are unable to produce sufficient sputum for accurate testing. Thus, although the majority of cases would be detected by
microbiological methods, clinically diagnosed cases are important contributors to the total burden of TB.
TB in South Africa has had an interesting evolution; underpinned by the nature of the disease which is easily spread among
close and prolonged contacts of active TB cases. Early increases were fueled by historic inequalities and high poverty levels in
South Africa associated with overcrowding, malnutrition and in more recent times HIV. In addition, the massive expansion of
mining activities linked to economic migration and mine workers often living away from their families in densely populated
structures have also played an important role, impacting both TB and HIV control in South Africa.
After South Africa became a democracy in 1994 the country was faced with major challenges in delivering services to all, as
well as a rapidly increasing TB and HIV burden. To this end, the National Tuberculosis Control Programme was established,
which has since introduced a variety of interventions, including: the phased implementation of the Directly Observed
Treatment Short-Course (DOTS) in 1997; the introduction of the four drug fixed dose combination in 2000; conducting the
first national Drug Resistance Survey in 2001; the launch of the National Tuberculosis Strategic Plan 2007-2011 in 2007; the

                                                NICD - Microbiologically confirmed tuberculosis 2004-15; South Africa                7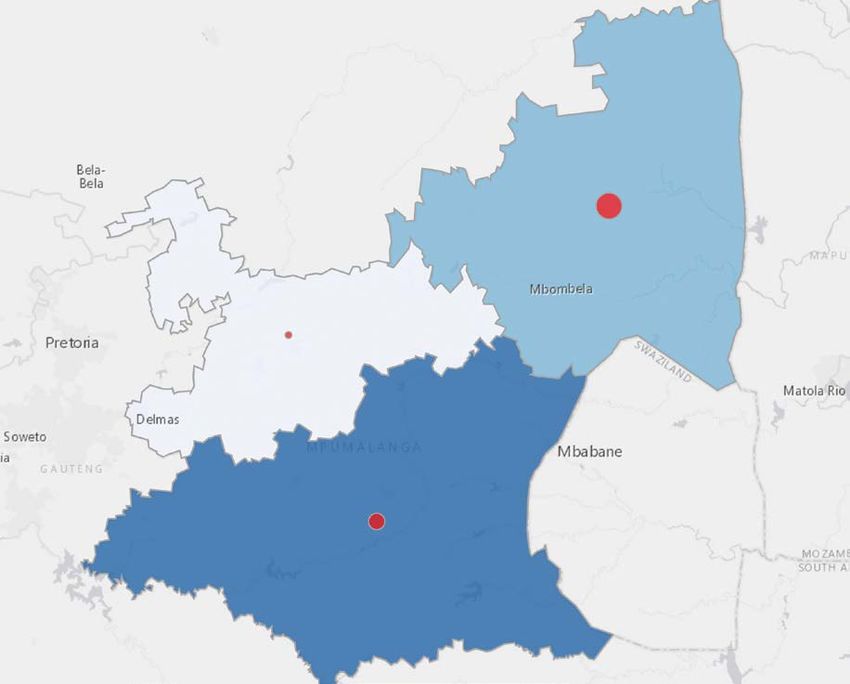
introduction of the new diagnostic assays (MTBDRplus rapid test for MDR-TB in 2008 and the XpertMTB/Rif in 2011 as a
    replacement for sputum smear microscopy); implementation of the 6-month isoniazid preventive therapy (IPT) programme
    for all HIV-infected persons (regardless of TST status) in 201012; and, most recently, the release of the findings of the most
    recent national Drug Resistance Survey in 201513.
    Despite instituting numerous interventions to control TB in South Africa over the years, the World Health Organization
    (WHO) estimated 454 000 new TB cases in South Africa in 20151 – the fifth highest globally. After adjustments for population
    size, South Africa has the highest incidence of TB among the 22 high-TB burdened countries in the world. It also has the
    largest number of HIV-associated TB cases. WHO has previously classified a TB incidence of ≥250 per 100 000 people as a
    “health emergency” and the estimated incidence in South Africa is three-fold higher than this level.
    The TB incidence reported by WHO is an estimated calculation, using several sources of information. To date a survey has
    not been conducted to determine the population prevalence of TB in South Africa. Several countries have however recently
    concluded such surveys in other parts of Africa, producing surprising results that suggest a much higher prevalence than
    reported through routine treatment registers. In many African countries, the latest technologies for the diagnosis of TB are
    not widely available or accessible and may contribute to the low number of cases reported as compared to the estimates
    generated through surveys. A prevalence survey is planned for South Africa and will be important in determining the true
    burden of TB, as well as the proportion of cases remaining undiagnosed in the community.
    In 2015, 294 603 cases were registered on treatment1 – presenting a very different picture from the estimated 450 000 cases
    by WHO. These variances could be due to poor health access or health-seeking behaviour, incomplete records in registry
    data, failure to follow up diagnosed cases or death prior to accessing treatment3,14,15. In 2015, the National Institute for
    Communicable Diseases with the National Department of Health published a peer reviewed paper in the Lancet Infectious
    Diseases journal using routine laboratory data to determine incidence rates nationally and provincially, and comparing
    findings with those reported through the current electronic data systems. The paper demonstrated the powerful utility of
    laboratory data in providing a robust surveillance system for tracking incidence, albeit only for microbiologically confirmed
    cases. Most importantly, transformation of the laboratory data allows for trend analysis at multiple levels of the healthcare
    system. These findings were made possible by South Africa’s unique position as compared to many other developing and
    developed countries globally, in having a single integrated laboratory network that covers all public health sector facilities.
    The National Health Laboratory Service was established in 2001 linking every laboratory in the public sector under a single
    entity. Services are managed using a single laboratory information system with all data, including laboratory results and
    demographic information, stored in a corporate data warehouse (CDW).
    The publication covered data between 2004 and 2012, and as data for the KwaZulu-Natal province were largely missing due
    to the lack of a laboratory information system in that province up to 2010, imputation was performed. The results from this
    study showed that the annual incidence of microbiologically confirmed pulmonary TB (mPTB) had increased nationally from
    656 per 100 000 people in 2004, to 854 per 100 000 people in 2008, then subsequently declined to 774 per 100 000 people
    by 2012. The incidence of PTB varied by age group and gender, as well as between provinces. The impact of HIV infection on
    the incidence of TB in South Africa was profound, but the upscaling of antiretroviral therapy (ART) was temporally associated
    with declining PTB incidence, albeit variably across the country. The incidence rates were highest in the Western Cape,
    Northern Cape and Eastern Cape with rates declining in all provinces since 2009, most markedly in the Western Cape and
    Northern Cape provinces.
    Utilisation of laboratory data to assess trends was a first for South Africa. Assessment of this data confirmed that the declining
    trend, as observed from the treatment registration data, was indeed true. The following factors were taken into account
    when developing the laboratory based surveillance system: As a unique identifier is not universally used, record linking
    was achieved using computer-based probabilistic matching algorithms to reach a case-based record of a patient. Multiple
    microbiological methods used to diagnose TB can also be used for monitoring progression to cure and the algorithms
    were adapted to order test types. Lastly, a person could have multiple episodes of TB over the course of their lives and thus
    episode assignments were developed to arrive at a patient level episode of TB spanning the period 2004 to 2015.
    Since the publication of the paper, the algorithms used have been further refined to improve the accuracy of the system
    resulting in the updated incidence rates now reported for the preceding years. Three additional aspects were considered as
    important for developing this report: Firstly inclusion of more recent years’ data, as the GXP rollout only began in 2011 and
    the previous findings were reported ending in 2012. Secondly, analysis needed to be performed at a much lower level to
    be meaningful and impactful in guiding future interventions. Finally, data were available in a format that was easy to access
    and visually presented in a way that made it easy to understand and interpret. The result was the development of an online
    TB Surveillance Dashboard, which forms the basis of this report and will officially be made available on World TB Day 2017.
    Drug resistant TB is another major concern for South Africa and unlike the lack of a general TB survey, two TB drug resistance
    surveys have been concluded for South Africa, the first between 2001-2002 and the second between 2012-2014; both

8             NICD - Microbiologically confirmed tuberculosis 2004-15; South Africa
showing relatively low levels of multi-drug resistant TB (MDR-TB), but increasing prevalence of rifampicin mono-resistant
TB, as well as high second line resistance in the latter survey. It is unclear, based on these surveys, what transpired in the
intervening decade between the surveys. Potentially, the laboratory-based surveillance system that has been developed will
be able to answer that question. Unlike the case for all TB where testing was universal, albeit with varying test performance,
in the case of drug resistant TB universal testing was not performed. Yet, with the introduction of the GXP in the most recent
years, this has been achieved to a large extent. Noting the limitations which are being improved on through the surveillance
system, the current report only presents information for rifampicin resistant TB for the year 2015. Future planned annual
reports will address this shortcoming and provide regular updates on trends.
The current report comes at a timely phase for South Africa as the National Strategic Plan (NSP) for HIV, TB and STIs 2017-2021
will place a major focus on using data to guide and drive efforts to achieve the END TB strategic targets (Table 1). One of
the main targets is to achieve a 10% year-on-year reduction in TB incidence rates. As highlighted earlier, TB incidence rates
are not reported routinely, however the current report and the online TB Surveillance Dashboard fill this important gap.
Although these only report mPTB incidence rates and not all TB cases, including those which are clinically diagnosed, mPTB
incidence rates are robust and objective, providing a suitable surrogate to assess progress towards reducing incidence.
Lastly, the current report also serves to address an important priority of the NSP in targeting responses by mapping the
burden in absolute numbers and incidence rates from national to sub-district levels.
Table 1: WHO End TB Strategy, milestones and targets
Vision A world free of tuberculosis
– zero deaths, disease and suffering due to tuberculosis
Goal End the global tuberculosis epidemic
Indicators Milestones Targets
2020 2025 SDG 2030 End TB 2035
Reduction in 35% 75% 90% 95%
number of TB deaths
compared with 2015
(%)
Reduction in TB 20% 50% 80% 90%
incidence rates (METHODS
Sources of data
Laboratory data
The data in this report are sourced from the National Health Laboratory Service’s (NHLS) Corporate Data Warehouse (CDW).
The CDW collates information from the laboratory information management systems (LIMS) (which is currently in operation
in the NHLS laboratories in South Africa) and the legacy LIMS that was previously used by the NHLS. Specimens which are
collected from people presenting at public health facilities with signs and symptoms of TB are sent to the NHLS’ network of
laboratories for testing. A laboratory requisition form containing basic demographic information and the test/s requested
accompanies each specimen and is captured into the LIMS.
Population and geographic data
Geographic data in the form of shape files and boundaries with associated population data by gender and five year age
group were obtained from the Municipal Demarcation Board and Statistics SA respectively.
Record linking
All data captured in the LIMS are specimen-based; associated demographic information is captured at the time of specimen
registration. To identify cases, an algorithm was applied to the registration data to ensure that all tests associated with individual
“patients” were assigned a link ID based on the outcome of an algorithm that uses the most frequently populated demographic
information for evaluation. This algorithm applied both exact and probabilistic matching to all specimen registrations in the CDW.
The number of records that were input into the probabilistic matching routine were reduced by the application of a
preliminary exact matching routine. To further enhance the chances of matching, both exact and probabilistic, the data
were first cleansed e.g. standard titles that may have been included in the first name field were removed and if date of birth
was not given then it was calculated from the given age at time of registration.
Exact matching was done using attributes for first name, surname and birthdate, and when available, the national ID number.
In addition, the hospital folder number from facilities known to use reliable unique patient identifiers was used. These
attributes were also used in the probabilistic linking. The population of the address lines was found to be too inconsistent
and unreliable for inclusion as a link criterion.
The probabilistic linking evaluated each attribute individually using a “fuzzy logic” function that returned a probabilistic
score. The score for each attribute was weighted; this weighting was determined by the reliability of the attribute being
used. A final score was assigned and the records were linked and assigned a unique link ID or left unlinked and assumed to
be individual cases based on a given threshold. The threshold used was determined during the development and testing of
the algorithm and was confirmed to result in conservative linking i.e. it would avoid linking unlikely matches.
Case definitions
TB
For each patient identified by the record linking process, TB confirmed status was determined based on a positive TB result
for an Xpert MTB/Rif test, culture, Line Probe assay or smear. A 12-month window period was calculated based on the date of
the first confirmatory test with a positive result and used to distinguish new episodes from existing episodes. This approach
was based on the understanding that treatment for drug susceptible TB spans six months, and that smear conversion for drug
susceptible TB is usually achieved within three months and allows for some delay between diagnosis and entry into treatment.
If a case that was confirmed to have drug susceptible TB was found to develop drug resistance later, the 12-month episode
window was extended to 24 months to allow for the extension of treatment.
10 NICD - Microbiologically confirmed tuberculosis 2004-15; South AfricaRIFR TB
For each confirmed TB patient identified, an assessment was made of all testing for rifampicin resistance using any one of
Xpert MTB/Rif, Line Probe assay or culture-based drug susceptibility testing (DSTs). A 24-month window period was applied
to distinguish new episodes of drug resistant TB (DRTB) from existing ones, again based on the duration of treatment, the
time taken to achieve smear conversion and allowing for some delay between diagnosis and treatment. All DRTB cases
that were still found to be TB positive within four months of the end of the episode window had the window extended by
an additional 12 months as they were considered to be still under treatment. It is important to note that MDR and XDR are
subsets of RIFR and MDR cases, respectively.
Statistical analysis
Data from annual population estimates aggregated to sub-districts were linked to the laboratory-confirmed TB data at sub-
district level. This enabled calculation of sub-district, district, provincial and national TB incidence rates as well as age/sex
standardised incidence rates. Ninety-five percent confidence intervals were calculated for these incidence rates. Incidence
trend graphs with fitted trend lines and confidence intervals were plotted for each administrative level. Population pyramids
were used to show the age/sex distribution of TB cases nationally and provincially.
RIFR and MDR incidence rates were calculated as a percentage of TB cases, while XDR incidence was calculated as a
percentage of MDR cases. Ninety-five percent confidence intervals were also calculated for each of these incidence rates.
The resulting TB and RIFR TB data were also used to develop maps showing TB and RIFR TB incidence rates as well as numbers
of cases for each province and for the country.
All statistical analysis was undertaken using Stata v14.0 (Statacorp, College Station, TX, USA). All maps were developed using
the Esri Maps for Microstrategy plugin (Esri, Redlands, CA).
Clinic Clinic Clinic Clinic Clinic
NHLS laboratory NHLS laboratory NHLS laboratory
Data Repository
Data linkage
Collation
Cleansing
Direct matching
Probalistic matching
Unique link ID allocation
Episode assignment
Population data
Analysis
Outputs
Figure 1: Schematic representation of data flow and processing
NICD - Microbiologically confirmed tuberculosis 2004-15; South Africa 11RESULTS AND DISCUSSION
NATIONAL
Over the 12 year period, a total of 3 327 876 microbiologically confirmed cases of pulmonary TB (mPTB) were diagnosed in South
Africa (Table 2). This total however excludes KwaZulu-Natal for the period 2004-2010 for which data was unavailable. The peak
number of mPTB cases was 272 702 nationally in 2008, and during the most recently recorded year (2015), it was 214 543, excluding
KwaZulu-Natal which accounted for an additional 66 512 mPTB cases in 2015. The highest burden of mPTB incidences occurred
in four provinces ranked by order: KwaZulu-Natal (66 512), Eastern Cape (59 205), Gauteng (44 822), and Western Cape (37 967)
(Figure 2). Together they account for 74.2% of the total burden in 2015. Complete data for KwaZulu-Natal were not available prior to
2011 as a laboratory information system covering the whole province had not been introduced before this time. Data had however
been modelled for the preceding period and have been published elsewhere3. The overall trend in TB has shown a decline in both
the number of mPTB cases and in incidence rates (Table 2) with an annual incidence of 689 (95% CI 687-692) per 100 000 people
in 2008, compared with 520 (95% CI 519-522) in 2015.
LP
GP MP
NW
FS KZN
NC
EC
WC
65 000 – 71 843 810.16 – 864.97
621.05 – 810.16
45 000 – 65 000
466.66 – 621.05
25 000 – 45 000
350.14 – 466.66
15 000 – 25 000
250.52 – 350.14
10 260 – 15 000
Figure 2: mPTB case burden (circles) and incidence rates (shading), South Africa: spatial distribution, 2015
12 NICD - Microbiologically confirmed tuberculosis 2004-15; South AfricaThe total cumulative number of TB cases averted between the peak incidence in 2008 and 2015 was 83 656. As previously
reported3, the most notable reductions observed were closely related to the upscaling of the antiretroviral therapy (ART)
rolled out in South Africa. Of greater interest are the trends in incidence rates which provide a population-adjusted evaluation
of the success or failure of programmatic interventions aimed at reducing new infections and ultimately control efforts.
mPTB incidence in South Africa has previously been shown to be on the decline and the current report confirms the trend
beyond 2012 with a national mPTB incidence rate in 2015 of 520 (95% CI: 519-522) per 100 000 people. The annual changes
in incidence rates have been -4.1%, -6.0% and -4.8% respectively for the last three years, compared to the 10% required
for the WHO End TB strategy. These year-on-year declines are higher than the global average of 1.5% but lower that that
required to achieve the 2025 and 2035 targets.
Table 2: mPTB case burden and incidence rates by year, South Africa: 2004-2015
Incidence/100000 Annual change in Annual change in
Year n
(95% CI) cases (n) incidence (%)
2004 214 166 572(569-574) - -
2005 260 855 687(685-690) 46 689 20.1
2006 269 197 700(697-702) 8 342 1.9
2007 260 406 668(665-670) -8 791 -4.6
2008 272 702 689(687-692) 12 296 3.1
2009 252 467 629(627-632) -20 235 -8.7
2010 251 951 619(616-621) -516 -1.6
2011 *
343 960 667(665-669) -$
-$
2012* 317 439 606(604-609) -26 521 -9.1
2013* 309 088 581(579-584) -8 351 -4.1
2014 *
294 590 546(544-548) -14 498 -6.0
2015 *
281 055 520(519-522) -13 535 -4.8
*includes data for KwaZulu-Natal
$ Annual change restarted with addition of KwaZulu-Natal data
Incidence Trends
Figure 3: Trends in mPTB incidence rates by province, South Africa: 2004-15
Incidence trends by province have shown similar consistent declines in recent years, though variation in incidence rates did
NICD - Microbiologically confirmed tuberculosis 2004-15; South Africa 13occur (Figure 3, Table 3). In 2015, the most recently reported year, the province with the lowest incidence rate was Limpopo
(251; 95% CI: 246-255) which is more than three-fold lower than the Eastern Cape (865; 95% CI:858-872), the province with
the highest incidence rate. However, all provincial incidence rates were above 250 per 100 000 people, the level which
WHO has previously declared to be a health emergency. Northern and Western Cape had the highest incidence rates in
2004/05 and have shown very similar trends with sharp declines up to 2010; the former showing increases in the subsequent
period coinciding with the implementation of the GXP, while for the latter province the trend has been flat, ending in 2015.
Although the KwaZulu-Natal data in the current report dates only from 2011, modelled data previously published indicated
that it too is one of the provinces with the highest incidence rates and the downward trend only began in 2011 (2nd highest).
This province has shown the largest year-on-year declines since 2011 (988; 95% CI: 982-995) and in 2015 (621; 95%CI: 616-
626) was down to the 4th highest in terms of incidence rates a 37.1% reduction in mPTB incidence rate over the 4-year period.
Males
Females
Figure 4: Age and gender population pyramid of mPTB cases, South Africa: 2015
The most affected age groups with mPTB were those in the economically active 25-44 year age group with an overall
male dominance in 2015 (Figure 4). The absolute number of cases was, however, higher among females in the younger
age groups and is reflective of the pattern seen with HIV-infected persons. The encouraging finding of a declining mPTB
incidence rate is primarily driven by large declines in incidence rates in females (25-44 year age group) with a 33.6% decline
in incidence rates between 2008 (1059; 95% CI: 1051-1067) and 2015 (703; 95% CI: 698-709) nationally (Figure 5).
In contrast, the changes in incidence rates among males in the most affected 25-44 year age group remained relatively small
for the same period (13.4%) starting at 1 272 (95% CI:1 263-1 281) and declining to 1 101 (95% CI:1 094-1 108) per 100 000
people respectively. These numbers are four times higher than the WHO threshold of 250 per 100 000 people for a health
emergency. The age/gender specific incidence rates show a marked difference between the 25-44 year age group (703; 95%
CI: 698-709) and the 45-64 year age group (439; 95% CI: 433-445) for females in the most recent year. Another interesting
finding is the small but consistent upward trend in incidence rates over time in the >65y age group among most females
and this may be reflective of HIV-infected people living longer and having TB at later stages of life, as would occur in the
non-HIV/AIDS population. Alternatively, this finding could reflect reactivation disease among patients who are HIV negative
and were exposed during the peak incidence periods in the 1990s and 2000s.
14 NICD - Microbiologically confirmed tuberculosis 2004-15; South AfricaTable 3: mPTB case burden and incidence rates by province, South Africa: 2004-2015
Year Eastern Cape (EC) Free State (FS) Gauteng (GP) KwaZulu-Natal (KNZ) Limpopo (LP) Mpumalanga (MP) North West (NW) Northern Cape (NC) Western Cape (WC)
n Incidence (95% n Incidence n Incidence (95% n Incidence (95% n Incidence n Incidence n Incidence n Incidence n Incidence
CI) (95% CI) CI) CI) (95% CI) (95% CI)
2004 42 879 724(717-731) 16 767 677(666-687) 49 398 446(442-450) - - 10 184 209(205-213) 15 906 436(429-443) 15 854 500(493-508) 11 669 1 128(1 108- 51 509 980(972-989)
1 149)
2005 49 511 825(818-832) 19 160 763(752-774) 68 352 609(604-614) - - 13 280 269(264-273) 18 691 506(499-513) 24 584 766(756-775) 12 812 1 223(1 201- 54 465 1 023(1 014-1 031)
1 244)
2006 51 828 852(845-859) 18 360 721(711-732) 69 189 608(604-613) - - 15 825 316(311-321) 20 018 535(527-542) 27 100 833(823-843) 11 582 1 090(1 071- 55 295 1 024(1 016-1 033)
1 110)
2007 54 455 883(876-890) 18 594 721(710-731) 59 155 513(509-517) - - 18 383 362(357-367) 22 384 590(582-597) 23 370 708(699-718) 10 564 981(962-1 000) 53 501 978(969-986)
2008 64 336 1029(1 021-1 037) 18 870 721(711-731) 61 327 524(520-528) - - 21 034 408(403-414) 25 558 664(656-672) 23 355 698(689-707) 10 615 972(953-991) 47 607 858(850-866)
2009 62 421 984(976-992) 17 979 677(667-687) 58 122 490(486-494) - - 21 698 415(410-421) 23 485 601(594-609) 22 191 654(645-663) 8 487 766(750-782) 38 084 676(670-683)
2010 68 440 1 063(1 055-1 071) 16 751 622(612-631) 57 364 476(473-480) - - 20 775 392(386-397) 22 294 562(555-570) 21 675 629(621-638) 7 129 634(619-649) 37 523 657(650-664)
2011 65 236 998(991-1006) 16 489 603(594-612) 54 722 448(444-452) 101 058 988(982-995) 19 765 367(362-372) 20 447 508(501-515) 19 205 549(542-557) 8 796 771(755-787) 38 242 660(653-666)
2012 63 018 950(942-957) 16 552 596(587-605) 46 490 375(371-378) 90 075 868(862-873) 18 706 342(337-347) 20 192 494(488-501) 17 014 479(472-487) 8 502 734(718-750) 36 890 627(620-633)
2013 65 281 969(961-976) 16 369 581(572-590) 47 376 376(373-379) 79 290 752(747-757) 17 071 308(303-312) 19 413 468(461-475) 17 545 487(480-494) 9 550 812(796-828) 37 193 622(616-628)
2014 60 518 884(877-891) 1 5833 553(544-562) 46 467 363(360-366) 72 743 679(674-684) 15 921 282(278-287) 18 439 438(431-444) 17 790 486(479-493) 9 607 804(788-820) 37 272 614(607-620)
2015 59 205 865(858-872) 14387 502(494-511) 44822 350(347-353) 66512 621(616-626) 14124 251(246-255) 17 271 410(404-416) 17 085 467(460-474) 9 682 810(794-826) 37 967 625(619-631)
NICD - Microbiologically confirmed tuberculosis 2004-15; South Africa
15Age specific incidence trends – Males
Age specific incidence trends – Females
Figure 5: Trends in mPTB incidence rates by age and gender, South Africa: 2004-15
16 NICD - Microbiologically confirmed tuberculosis 2004-15; South AfricaIn this report we present national heat maps of mPTB incidence at a sub-district level. The first map shows the burden of
TB disease according to geospatial distribution by absolute number of mPTB cases for the year (Figure 6). The second map
is adjusted for population size, and shows the mPTB incidence rates per 100 000 people (Figure 7). The maps show vast
differences in both burden of disease and incidence rates and highlight an important distinction: The absolute number of
cases at a provincial level primarily identifies the four high burden provinces, and when viewed at a sub-district level, the
heterogeneity of the findings becomes very apparent. The highest burdened areas are the urban metropolitan regions with
the following major cities highlighted: Cape Town, Johannesburg and Buffalo City Metropolitan. The latter city is probably
not being given enough attention and carries a very high burden of mPTB. Apart from the other cities and major towns
that show a high absolute burden, selected districts in the Eastern Cape and Mpumalanga also account for relatively high
burdens requiring attention. These heat maps with absolute burden of mPTB cases provide valuable hotspot information
of areas where the highest impact could potentially be made in reducing the burden of TB nationally. This could present a
cost-effective approach to address TB in a resource-constrained climate.
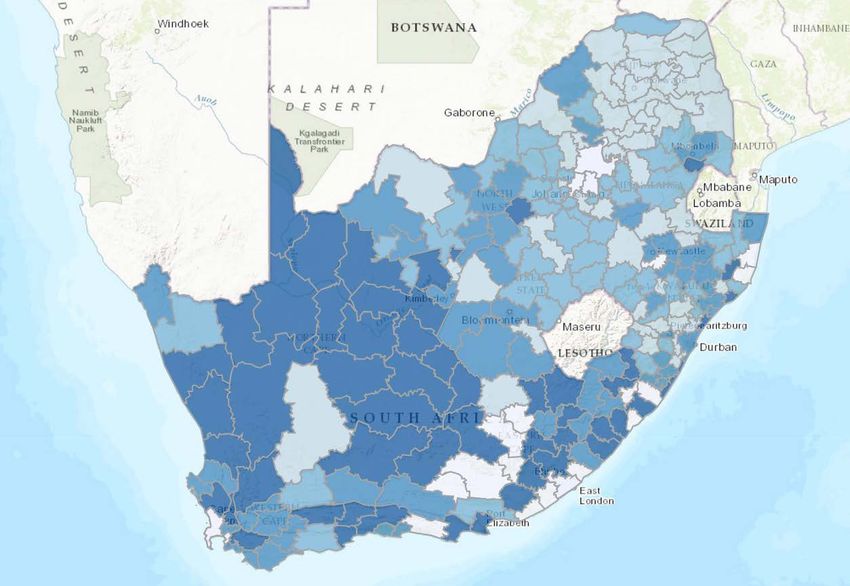
The heat map showing the distribution of mPTB incidence rates at a sub-district level (Figure 7) illustrates areas where
new cases are occurring at high frequency, adjusted for population size, and for a high burden setting like South Africa
it probably reflects ongoing transmission. The western regions of South Africa show the highest incidence rates at a sub-
district level and became progressively lower, moving eastwards with the lowest incidence areas in the Limpopo province.
Interestingly, the major cities which carry the highest burden of absolute number of mPTB cases and population (Cape Town
and Johannesburg) do not have very high incidence rates. However, eThekwini is different, carrying a high absolute case
load as well as a relatively high incidence rate. Additional sub-districts with high incidence rates occur predominantly in
non-urban settings in the Northern and Western Cape and parts of the Eastern Cape. This may be reflective of patient access
to health services and delays in accessing these services. This situation would therefore require a different set of health
interventions to those targeting high burden metropolitan areas.
Figure 6: Geospatial distribution of mPTB case burden at a sub-district level, South Africa: 2015
NICD - Microbiologically confirmed tuberculosis 2004-15; South Africa 17Figure 7: Geospatial distribution of mPTB incidence rates at a sub-district level, South Africa: 2015 18 NICD - Microbiologically confirmed tuberculosis 2004-15; South Africa
Microbiologically confirmed rifampicin resistant tuberculosis

                                                                                        LP

                                                                                   GP        MP
                                                                   NW

                                                                          FS                      KZN
                                            NC

                                                                         EC

                                         WC

              4 488 – 6 346                                                    9.54 –9.99

                                                                               7.07 – 9.54
              2 170 – 4 488
                                                                               6.40 – 7.07

              1 093 – 2 170
                                                                               5.75 – 6.40
              786 – 1 093
                                                                               5.56 – 5.75
              685 – 786

Figure 8: Rifampicin resistant mPTB case burden (circles) and incidence rates (shading), South Africa: spatial
distribution, 2015

The geographic distribution of the number of mPTB rifampicin-resistant TB (RR-TB) cases and the incidence rate of RR-TB per
100 mPTB cases is shown in Figure 8 and Table 4. The absolute burden of RR-TB cases is highest in KwaZulu-Natal (6 293),
accounting for 29.3% of all cases nationally in 2015. Combined with the second highest (Eastern Cape, 4 511) and third
highest (Gauteng, 3 150), these three provinces collectively accounted for most of the drug resistant. TB burden and should
be prioritised. Interestingly, Mpumalanga has shown a relatively high absolute burden (1 733) and importantly the highest rate
of RR-TB cases per 100 mPTB cases nationally (10; 95% CI: 9.6-10.5). This latter finding is consistent with results from the most
recent TB drug resistance survey: 2012-2014 highlighting the high prevalence in this province and providing possible reasons.
It should, however, be noted that the incidence rate of RR-TB per 100 mPTB cases is relatively homogenous with most parts of
the country ranging from 5.6 to 7.6 and therefore the apparent differences observed are relatively small. It should also be noted
that some areas may have a relatively low RR-TB burden but may have a much higher XDR-TB burden and this is not presented
in the current report, but will be covered in future reports together with changes that have occurred in South Africa over time.

                                                 NICD - Microbiologically confirmed tuberculosis 2004-15; South Africa              19
Table 4: Rifampicin mPTB case burden and incidence rates per 100 mPTB cases by province, South Africa: 2015
Province Incidence (95% CI)
Eastern Cape 7.6 (7.4-7.8)
Free State 6.5(6.1-6.9)
Gauteng 7 (6.8-7.3)
KwaZulu-Natal 9.5 (9.2-9.7)
Limpopo 5.6 (5.2-6)
Mpumalanga 10 (9.6-10.5)
North West 6.5 (6.1-6.9)
Northern Cape 7.2 (6.7-7.7)
Western Cape 5.9 (5.7-6.2)
Summary
• A total of 3 327 876 mPTB cases occurred between 2004 and 2015.
• Four provinces (KwaZulu-Natal, Eastern Cape, Gauteng and Western Cape) accounted for 74.2% of the absolute burden
in South Africa during 2015.
• mPTB incidence rates are on the decline with reductions of -4.1%, -6.0% and -4.8% year-on-year for 2013, 2014 and
2015 respectively which is half of that required by the WHO End TB Strategy.
• Females between the ages of 25-44 have shown the sharpest decline in incidence rates (-33.6%) between 2008 and
2015, reflective of efforts in the HIV programme targeting this age group.
• Change in incidence rates among males has been minimal for the age group 25-44 years over the same period (-13.4%)
and shows the highest incidence (2.5 times the national average), requiring initiatives aimed at this population.
• Among provinces, KwaZulu-Natal has shown the sharpest decline in mPTB incidence rates and achieved a reduction of
37.1% over a four year period (2011-2015).
• Antiretroviral therapy expansion, which has probably led to important early successes, has tapered off in several
provinces (Gauteng, North West and Western Cape) and other aspects of TB control need to be targeted (pre-treatment
loss to follow up, contact tracing etc.).
• Rifampicin resistant TB is concentrated in KwaZulu-Natal, accounting for 29.3% of the national burden, while
Mpumalanga has the highest incidence rate at 10 (95%CI: 9.6-10.5) among provinces.
20 NICD - Microbiologically confirmed tuberculosis 2004-15; South AfricaEASTERN CAPE
Between the period 2004 and 2015, a total of 707 128 microbiologically confirmed cases of pulmonary TB (mPTB) were
diagnosed in Eastern Cape (Table 5). The peak number of mPTB cases was 68 440, occurring in 2010 and in the most recent
year (2015) the number of cases was 59 205. The highest burden of mPTB cases occurred in the following three districts
(Figure 9 and Table 6): Nelson Mandela Bay Metro (12 275), OR Tambo (11 881) and Buffalo City Metro (7 881). Together they
account for 54.1% of the total burden in 2015. This pattern has remained unchanged when compared with 2004, though
lower absolute numbers of cases have been observed in the Nelson Mandela Metro when comparing 2015 to the 2004 data.
AN
JG
TA
(OR Tambo)
CH
AT
BUF
SBA
NMA
7 881 - 12 275 1 021.41 - 1 161.11
1 000.45 - 1 021.41
6 707 - 7 881
808.34 - 1 000.45
5 457 - 6 707
693.45 - 808.34
2 530 - 5 457
601.78 - 693.45
2 530 - 2 530
Figure 9: mPTB case burden (circles) and incidence rates (shading), Eastern Cape: spatial distribution, 2015
The overall trend in TB over the period showed an increasing incidence rate peaking in 2010 at 1 063 (95% CI: 1 055-1 071)
mPTB cases per 100 000 people and subsequently showing consistent declines to 865 (95% CI: 858-872) in 2015 (Table 5).
The cumulative number of cases of TB averted between 2010 and 2015 were 9 235. This downward trend is consistent with
what was previously reported3. The annual change has been +2.0%, -8.8% and -2.1% for the last three years as compared to
the 10% required for the WHO End TB Strategy.
NICD - Microbiologically confirmed tuberculosis 2004-15; South Africa 21Table 5: mPTB case burden and incidence rates by year, Eastern Cape: 2004-2015
Incidence*/100000 Annual change in Annual change in
Year n (95% CI) cases (n) incidence (%)
2004 42 879 724(717-731) - -
2005 49 511 825(818-832) 6 632 14.0
2006 51 828 852(845-859) 2 317 3.3
2007 54 455 883(876-890) 2 627 3.6
2008 64 336 1 029(1 021-1 037) 9 881 16.5
2009 62 421 984(976-992) -1 915 -4.4
2010 68 440 1 063(1 055-1 071) 6 019 8.0
2011 65 236 998(991-1 006) -3 204 -6.1
2012 63 018 950(942-957) -2 218 -4.8
2013 65 281 969(961-976) 2 263 2.0
2014 60 518 884(877-891) -4 763 -8.8
2015 59 205 865(858-872) -1 313 -2.1
Incidence trends by district have been mixed in this province (Figure 10). The Nelson Mandela Metro region had the highest
incidence rate in 2004, at 1 637 (95% CI:1 613-1 662) mPTB cases per 100 000 people and has declined to 1 021 (95% CI:1 003-
1 040) in 2015 (Table 6). The Sarah Baartman District had the second highest incidence rate in 2004 at 1 250 (95% CI: 1 216-
1 285) and is now the district with the highest incidence rate in 2015 at 1 161 (95%CI: 1 131-1 192) (reasons for this situation
should be investigated). The most striking trend was encountered in the Alfred Nzo District, showing sharp changes in mPTB
incidence trends, peaking in 2010 at 1 442 (95%CI: 1 415-1 468) per 100 000 people, followed by sharp declines with an
incidence rate of 602 (95%CI: 585-619) in 2015.
The increase in incidence rate is unlikely to have been driven by improved diagnostics as it pre-dated the introduction of the
GeneXpert (GXP) assay, while the declines occurred when GXP became widely used. The declines are certainly encouraging
and understanding the reason(s) for these shifts will be valuable for future planning. Fluctuating allocation of resources at sub-
district level in this province may have led to such shifts; however, these would not impact greatly on the incidence as both the
numerator and denominator of the allocation figures would have shifted. Secondly, if a shift in allocation at sub-district level
had occurred, this would have impacted on adjacent district(s) and such major shifts in other districts have not been observed.
Incidence Trends
Figure 10: Trends in mPTB incidence rates by district, Eastern Cape: 2004-15
22 NICD - Microbiologically confirmed tuberculosis 2004-15; South AfricaTable 6: mPTB case burden and r incidece ates by year, Eastern Cape: 2004-2015
Year Alfred Nzo (AZ) Amathole (AT) Buffalo City Metro Chris Hani (CH) Joe Gqabi (JG) Nelson Mandela Bay O R Tambo (TA) Sarah Baartman (SBA)
(BUF) Metro (NMA)
n Incidence n Incidence n Incidence n Incidence n Incidence n Incidence n Incidence n Incidence
(95% CI) (95% CI) (95% CI) (95% CI) (95% CI) (95% CI) (95% CI) (95% CI)
2004 35 5 (3-7) 2496 310 (298-322) 5876 862 (840-884) 3151 439 (424-454) 738 234 (217-251) 17027 1637 (1613- 8472 688 (673-702) 5084 1250 (1216-1285)
1662)
2005 1663 227 (216-238) 4145 508 (492-523) 6344 918 (896-941) 3796 522 (505-539) 1330 416 (394-439) 15564 1477 (1454- 12152 973 (956-991) 4517 1096 (1064-1129)
1500)
2006 2776 374 (360-388) 5746 694 (677-713) 7038 1005 (982- 4431 601 (583-619) 1609 496 (472-521) 13778 1290 (1269- 12401 980 (963-997) 4049 969 (940-1000)
1029) 1312)
2007 4928 654 (636-673) 6866 818 (799-838) 7307 1029 (1006- 4740 634 (616-652) 1416 431 (409-454) 12742 1177 (1156- 11758 917 (900-933) 4698 1109 (1078-1142)
1053) 1197)
2008 9052 1185 (1161- 7576 890 (870-911) 7578 1053 (1029- 6279 828 (808-849) 2059 618 (591-645) 14334 1305 (1284- 12624 970 (953-987) 4834 1126 (1094-1158)
1210) 1077) 1327)
2009 10107 1304 (1279- 6157 713 (696-731) 7642 1047 (1023- 5942 773 (753-792) 2013 595 (570-622) 12355 1109 (1090- 13746 1042 (1024- 4459 1024 (994-1054)
1330) 1070) 1129) 1059)
2010 11334 1442 (1415- 6874 785 (766-804) 8619 1163 (1139- 6477 830 (810-850) 2540 740 (712-770) 13775 1219 (1198- 13598 1015 (998- 5223 1181 (1150-1214)
1468) 1188) 1239) 1033)
2011 7935 994 (973-1016) 7830 881 (861-901) 8563 1139 (1115- 6201 783 (763-803) 2970 853 (822-884) 12705 1107 (1088- 14041 1033 (1016- 4991 1112 (1082-1143)
1163) 1127) 1050)
2012 6956 859 (839-879) 7525 834 (815-853) 8474 1110 (1086- 7028 874 (854-895) 2814 796 (767-826) 12589 1081 (1062- 12766 925 (909-941) 4866 1068 (1038-1099)
1134) 1100)
2013 6397 777 (759-797) 8257 901 (882-921) 8688 1120 (1097- 7755 949 (928-971) 2788 776 (748-806) 12479 1055 (1036- 13242 945 (929-961) 5675 1227 (1195-1259)
1144) 1074)
2014 5433 650 (633-668) 7564 812 (794-831) 8015 1017 (995- 6955 838 (819-858) 2588 709 (682-737) 11410 949 (932-967) 13424 943 (927-959) 5129 1091 (1062-1122)
1040)
2015 5030 602 (585-619) 7444 800 (781-818) 7881 1000 (978- 6707 808 (789-828) 2530 693 (667-721) 12275 1021 (1003- 11881 834 (820-850) 5457 1161 (1131-1192)
1023) 1040)
NICD - Microbiologically confirmed tuberculosis 2004-15; South Africa
23Males
Females
Figure 11: Age and gender population pyramid of mPTB cases, Eastern Cape: 2015
The most affected age groups with mPTB coincide with those in the economically active age categories (25-44), with a clear male
dominance overall in 2015 (Figure 11). Among males, the peak in absolute number of mPTB cases occurred in the 30-34 year age
group and in females in the 25-29 year age group. The age and gender profile of cases in earlier years showed the classic pattern
of more cases in females (25-44 years) which has reduced over time. An encouraging finding is that this group also experienced a
sharp decline in mPTB incidence rates of 1 753 (95% CI: 1 725-1 781) in 2010 to 1 134 (95% CI:1 112-1 157) (Figure 12); a reduction
of 35.3% and is the principal group driving the provincial declines.
Age specific incidence trends – Males
24 NICD - Microbiologically confirmed tuberculosis 2004-15; South AfricaAge specific incidence trends – Females
Figure 12: Trends in mPTB incidence rates by age and gender, Eastern Cape: 2004-15
Similar to the national picture, the highest burdened age groups among males have shown slow declines in incidence rates and
this is concerning. Additionally, the mPTB incidence rates in males aged 25-44 years was exceedingly high at the peak in 2010 at
2 550 (95%CI:2 513-2 587) per 100 000 people. This rate is similar to those reported for mine workers, though this is at a community
level rather than in a congregate setting. Age specific mPTB incidence rates in this province are generally higher than for other
provinces with all individuals 15 years and older, among both males and females, having an incidence rate > 500 per 100 000
people. Similar to national trends, among individuals aged >65 years of age, there is an upward trend with very high rates of above
1 200 cases per 100 000 people among males. This may be reflective of a high transmission rate with individuals experiencing their
disease later in life; particularly for HIV negative individuals or patients with HIV that are re sponsive to long-term ART.
NICD - Microbiologically confirmed tuberculosis 2004-15; South Africa 25Microbiologically confirmed rifampicin resistant tuberculosis
AN
JG
TA
(OR Thambo)
CH
AT
BUF
SBA
NMA
917 – 1 013 8.25 – 11.64
7.44 – 8.25
833 – 917
6.92 – 7.44
406 – 833
5.56 – 6.92
348 – 406
4.94 – 5.56
125 – 348
Figure 13: Rifampicin resistant mPTB case burden (circles) and incidence rates (shading), Eastern Cape:
spatial distribution, 2015
The geographic distribution of the number of mPTB RR-TB cases and the incidence rate of RR-TB per 100 mPTB cases are
shown in Figure 13 and Table 7. The absolute burden of RR-TB cases is highest in Nelson Mandela Bay Metro (1 038), Buffalo
City Metro (907) and OR Tambo district (838) and together they account for 61.7% of the RR-TB burden in the province for
2015 and should be key priority areas. Buffalo City Metro had the highest incidence (11.5; 95%CI: 10.8-12.3) for the province
and is also among the highest nationally. This implies a high force of transmission and reasons for this should be investigated,
including delays in accessing care and treatment, adherence issues and lack of contact tracing. The second highest was
Nelson Mandela Metro which also carries a high absolute burden and will similarly need further attention. It should also
be noted that some areas may have a relatively low RR-TB burden but may have a much higher XDR-TB burden; this is not
presented in the current report, but will be covered in future reports as well as in a forthcoming trend analysis for drug
resistant TB.
26 NICD - Microbiologically confirmed tuberculosis 2004-15; South AfricaYou can also read