MAJOR AUGMENTATION PROPOSAL - OPTIONS PAPER Picton South - Staged 132kV conversion - Western Power
←
→
Page content transcription
If your browser does not render page correctly, please read the page content below

MAJOR AUGMENTATION
PROPOSAL
OPTIONS PAPER
Picton South - Staged 132kV conversion

3 February 2020

Prepared By:
Grid Transformation
Western Power
GPO Box L921, Perth WA 6842
ABN 18 540 492 861

                                       DOCUMENT PURPOSE
 For the benefit of those not familiar with the Electricity Networks Access Code 2004, Western
 Power offers the following clarifications on the purpose and intent of this document:
1. Western Power, as a prudent electricity networks business, is required to carry out forward planning to
   identify future reliability of supply requirements and to issue this type of document for proposed
   “Major Augmentations” to the covered network;
2. The Electricity Networks Access Code 2004 requires that Western Power should properly assess each
   Major Augmentation to determine whether it maximises the “Net Benefit” to those who generate,
   transport or consume electricity, after considering alternative options; and
3. This document contains the results of this assessment, and a draft recommended solution to address
   future supply requirements in several stages of project implementation, starting from August 2020.
   Interested parties are invited to comment on the draft recommendation.

 What the document does NOT mean:
4. It does NOT mean that the electricity supply interruptions are imminent. The identified supply
   interruption scenario is a moderate consequence event with possible likelihood, which has not been
   observed in the system during the past 10 years, with its likelihood expected to increase within the
   next 10 years. There is sufficient time to implement a solution with mitigation strategies in place to
   prevent any associated supply interruptions.
5. It does NOT mean that Western Power has been surprised. It is, in fact, part of the standard Western
   Power planning processes.

                                                                                             EDM 49401234
                                                                                                    Page ii
Contents

Glossary ................................................................................................................................................. v
Executive summary ...............................................................................................................................vii
1.     Background .................................................................................................................................. xiv
       1.1       Geographical Area - Bunbury Load Area ...................................................................................... xiv
       1.2       Picton South Network ................................................................................................................... xv
       1.3       Network Strategy and Network Development Plan .................................................................... xvi
       1.4       Developments in Peak Demand Forecast and Asset Condition .................................................. xvii
       1.5       Peak Demand Forecast ................................................................................................................... 1
2.     Asset Condition .............................................................................................................................. 4
       2.1       Asset Condition Summary ...............................................................................................................4
       2.2       Power Transformers ....................................................................................................................... 5
       2.3       Primary Plant................................................................................................................................... 6
       2.4       Transmission Lines – Conductors .................................................................................................... 7
       2.5       Transmission Lines – Structures...................................................................................................... 7
3.     Planning Drivers ............................................................................................................................. 9
       3.1       Planning Criteria..............................................................................................................................9
       3.2       N-1 Criterion – Steady State Network Performance....................................................................... 9
       3.3       Short Term Voltage Stability ........................................................................................................... 9
       3.4       Long Term Voltage Stability ..........................................................................................................10
       3.5       Maximum Supportable Demand ...................................................................................................10
4.     Committed Projects ...................................................................................................................... 11
       4.1       Present Projects ............................................................................................................................11
       4.2       Completed Projects.......................................................................................................................11
5.     Options Considered ...................................................................................................................... 12
       5.1       Network Options ...........................................................................................................................12
       5.2       Non-Network Options ...................................................................................................................12
       5.3       Key Assumptions ...........................................................................................................................13
       5.4       Development Strategy 1: Picton South 132kV conversion – Accelerated conversion .................14
       5.5       Development Strategy 2: Picton South 132kV conversion – Staged 132kV conversion -
                 Busselton Terminal Transformer ..................................................................................................17
       5.6       Development Strategy 3: Picton South 132kV conversion – Staged 132kV conversion -
                 Picton Terminal Transformer ........................................................................................................20
       5.7       Development Strategy 4: Retain 66kV Network - Procure NCS ....................................................23

                                                                                                                                           EDM 49401234
                                                                                                                                                 Page iii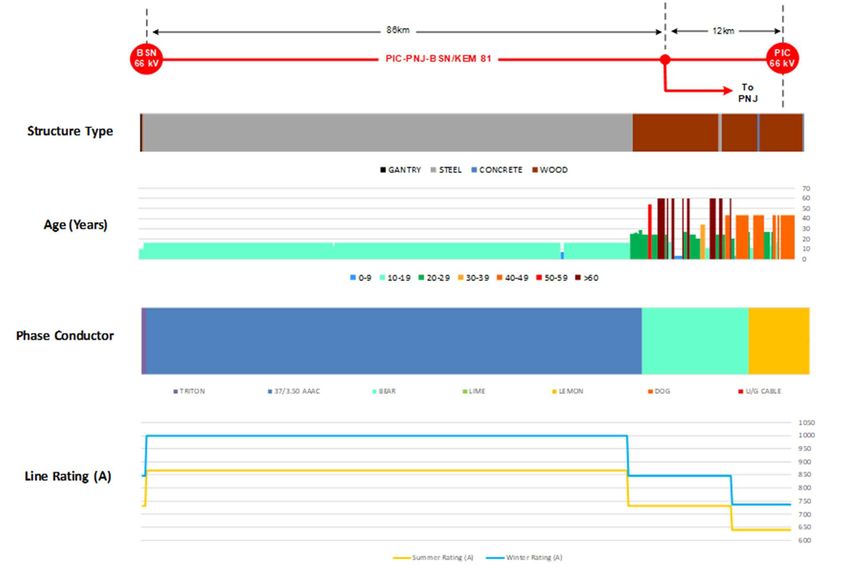
5.8       Development Strategy 5: Retain 66kV Network – Install Additional Reactive Support ...............25
       5.9       Managing Risks Prior to Construction...........................................................................................27
       5.10      Comparison of Development Strategies .......................................................................................28
6.     Format and Inputs to Analysis ....................................................................................................... 32
       6.1       Regulatory Test Requirements .....................................................................................................32
       6.2       Network Augmentation Costs .......................................................................................................32
       6.3       Other .............................................................................................................................................32
7.     Financial Analysis ......................................................................................................................... 33
       7.1       Net Present Cost ...........................................................................................................................33
       7.2       Cost Building Blocks ......................................................................................................................35
       7.3       Demand Growth............................................................................................................................36
8.     Conclusions .................................................................................................................................. 38
9.     Draft Recommendation ................................................................................................................ 40
10. Consultation ................................................................................................................................. 41
Appendix A : Asset Condition Criterion......................................................................................................... A-1
Appendix B : Transmission Line Asset Information ...................................................................................... B-1
Appendix C : Asset Base Rationalisation ....................................................................................................... C-1
Appendix D : Asset Replacement Expenditure ............................................................................................. D-1
Appendix E : Demand Growth Sensitivity Analysis....................................................................................... E-1
Appendix F : Discounted Options .................................................................................................................. F-1
Appendix G : Picton South Network Diagrams ............................................................................................. G-1
Appendix H : Existing and Proposed Fault Levels ......................................................................................... H-1
Appendix I : Resupply of WSD ........................................................................................................................ I-1
Appendix J : Capel and Busselton 132kV Line Conversion Options .............................................................. J-1
Appendix K : Network Control Services - Assumptions ................................................................................ K-1
Appendix L : Technical Rules Requirements ..................................................................................................L-1
Appendix M : Western Power Reference Documents ................................................................................. M-1

                                                                                                                                              EDM 49401234
                                                                                                                                                    Page iv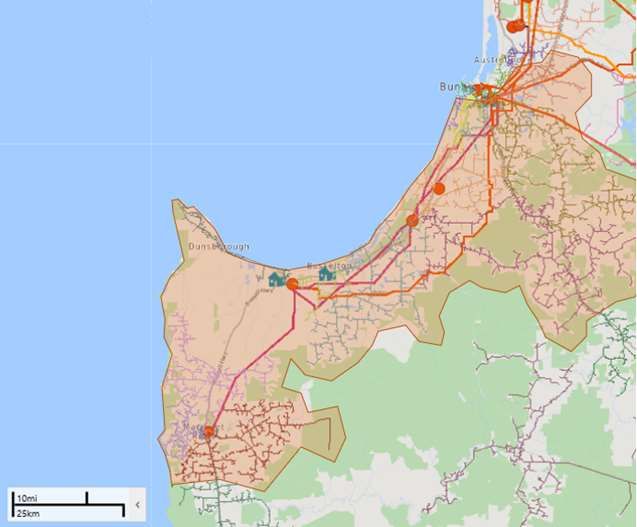
Glossary
The list of abbreviations and acronyms used throughout this document is shown below.

 Abbreviation / Acronym Definition
         AEMO             Australian Energy Market Operator
         CAPEX            Capital Expenditure
          CMD             Contract Maximum Demand
           CPI            Consumer Price Index
           CT             Current transformer
           DTC            Distribution Transfer Capacity
          DSM             Demand Side Management
           ERA            Economic Regulation Authority
           IEM            Investment Evaluation Model
           kV             Kilo Volt
          MRL             Mean Replacement Life
          MVA             Mega Volt Ampere
          MVAr            Mega Volt Ampere (Reactive)
          MW              Mega Watt
          MWh             Mega Watt-hour
           N-0            System normal state, operating with no transmission elements out of service
           N-1            System state with one transmission element out of service
          NCR             Normal Cyclic Rating
           NCS            Network Control Service
          NDP             Network Development Plan
          NFIT            New Facilities Investment Test
          NPC             Net Present Cost
          OPEX            Operating Expenditure
           pa             Per Annum
           PoE            Probability of Exceedance
           PV             Photo Voltaic
           RCP            Reserve Capacity Price
           VT             Voltage Transformer

                                                                                         EDM 49401234
                                                                                                Page v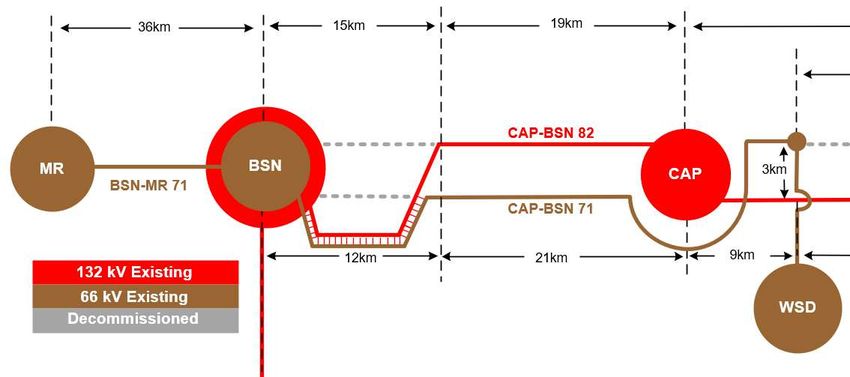
WACC                   Weighted Average Cost of Capital
               WEM                   Wholesale Electricity Market
    Substation Abbreviation Definition
                BSN                  Busselton Substation
                CAP                  Capel Substation
                MR                   Margaret River Substation
                PIC                  Picton Substation
               WSD                   Westralian Sands1 Substation

1      The Westralian Sands substation is owned by Iluka Resources

                                                                        EDM 49401234
                                                                              Page vi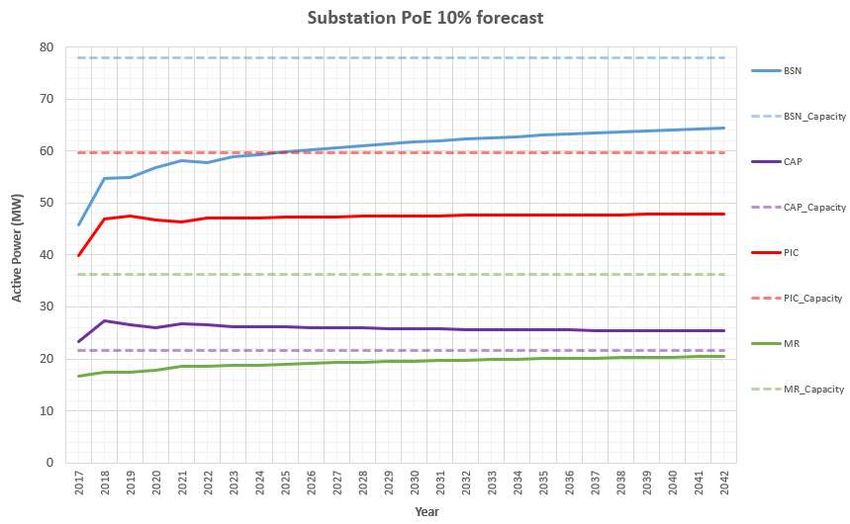
Executive summary
Introduction
The Picton South network is a sub network of the Bunbury load area, spanning from Picton to Augusta.
Approximately 46,000 customers are supplied within Picton South, with a mix of residential, commercial,
industrial and agricultural electricity consumers.
One of Western Power’s key overarching strategies that drives investment is Western Power’s 66kV
Rationalisation strategy. This strategy guides investment decisions related to the replacement of 66kV
networks to maximise the net benefit for network Users and maintain appropriate asset types/volumes
with respect to current and forecast network conditions.
The Picton South network is one of the few remaining pockets of Western Power’s network still operating
at a 66kV transmission voltage. A significant number of these assets are approaching or have already
exceeded2 their expected replacement life, with many assets also in degraded condition, resulting in
multiple safety, reliability of supply and system security risks that have triggered the need for network
development within the Picton South region.
The two 132/66kV Picton terminal transformers are 52 years old and in degraded condition, representing
the highest risk assets in the area. These transformers are critical in providing supply to the entire Picton
South 66kV network and are necessary to maintain N-1 system security to the region. The timely
replacement of these transformers is required to avoid the initial loss of supply of up to approximately
46,000 customers (of which 81 are on life support), followed by significant periods of load shedding that
will result in adverse impact on customers experience and reduced economic activity in the region3.
In addition, significant growth within the last 25 years has led to the 66kV network exceeding its intended
design capability, resulting in existing voltage related N-1 non compliances that limit further growth
opportunities in the area.
Western Power recognises the importance of reliable and secure electricity supply to customers and has
completed planning investigations to identify the most prudent and efficient course of action to continue to
meet the needs of its customers in the Picton South region.
This document outlines five medium to long term development strategies to augment the Picton South
transmission network and achieve the following objectives:
Address the existing and emerging asset condition risks;
Address existing steady state and dynamic voltage stability non-compliances prescribed under the
N-1 design criterion;
Increase the maximum supportable demand to meet the long term forecast growth; and
Align with Western Power’s long term strategies (in particular, the 66kV Rationalisation strategy).
Western Power has prepared this Options Paper, in accordance with the requirements of chapter 9 of the
Electricity Network Access Code 2004, for public consultation as part of the Regulatory Test process for a
Major Augmentation Proposal to the Western Power network. The objective of the Options Paper is
twofold:
2 These assets have a depreciated value of zero and the capital costs associated with these assets have been fully recovered.
3 Although an N-2 event is outside the planning criteria, Western Power considers it prudent to address these risks, given the current degraded
condition and system security risks associated these transformers.
EDM 49401234
Page vii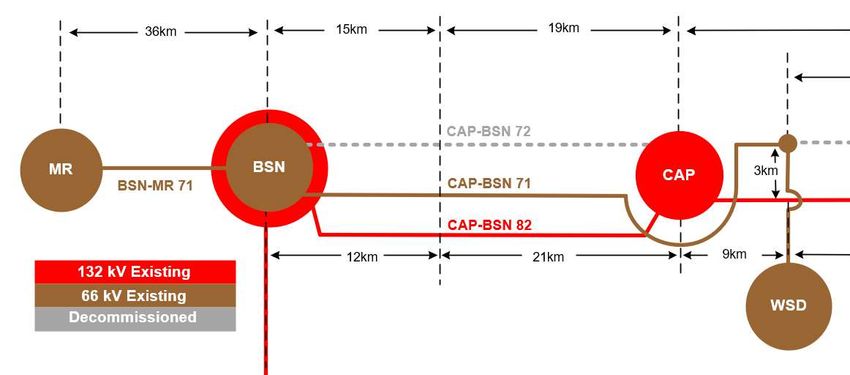
1.     to inform the public, in general, and interested parties, in particular, of the Major Augmentation
              Proposal; and
       2.     to obtain input with regard to any additional or alternative considerations.

Key stakeholders are encouraged to submit opinions and to offer alternative solutions to those proposed by
Western Power.

A summary of the outcomes of the public consultation and submission will be published as part of Western
Power’s submission to the ERA for a Major Augmentation Proposal and associated Regulatory Test
requirements.

Network Issues
Assets

Most of the assets within the Picton South region are supplied by 66kV rated equipment. A significant
portion of these assets are approaching or have already exceeded their expected replacement life, with
many assets also in degraded condition, requiring them to either be replaced, maintained, upgraded or
decommissioned.

The key assets that require mitigation within the short to medium term relate to the following power
transformer replacements, as shown in Table ES.1.

Table ES.1: Key power transformer asset information

                                                                      Asset    Estimated
                   Plant                          Nameplate                                                            Committed
    Substation                   Voltage                              Health   remaining                Age
                     #                             Capacity                                                        Replacement Plans5
                                                                    Condition4     life
                     T1          66/22kV             15 MVA             Poor               6             62                     N
    Busselton        T2          66/22kV             19 MVA            Failed             n/a           n/a                     N
                     T3          66/22kV             15 MVA             Poor               6             62                     N
                     T1       132/66/22kV           100 MVA             Bad                56            52                     N
                     T2       132/66/22kV           100 MVA             Bad                56            52                     N

      Picton                                                                                                            Y – 132/22kV
                     T3          66/22kV             27 MVA             Bad                18            51
                                                                                                                        replacement
                                                                                                                        Y – 132/22kV
                     T5          66/22kV             27 MVA            Failed              16            52
                                                                                                                        replacement
                     T1          66/22kV             19 MVA             Bad                14            54        Y – Installation of an
      Capel                                                                                                        additional 132/22kV
                     T3          66/22kV             19 MVA             Poor               15            53            replacement

4      Based on a Condition Based Risk Management (CBRM) health index
5      See Section 4 for further detail on committed works
6      Routine inspection and diagnosis of both transformers identified inherent manufacturing defects on both transformers (i.e. high resistance
       ‘hot joints’ on phase windings), which have been temporarily managed through retaping. As a result, the expected remaining life of both
       transformers has been reduced from 17 to 5 years. The timely replacement of these transformers represents the highest asset condition risk
       for the area.

                                                                                                                             EDM 49401234
                                                                                                                                  Page viii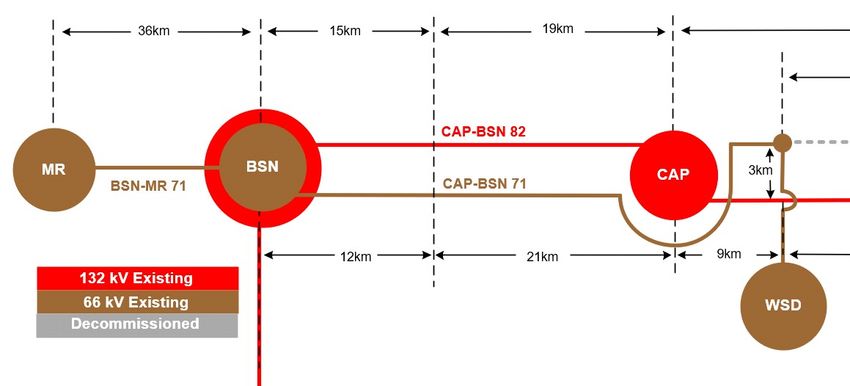
The mitigation of the asset condition issues with both Picton terminal transformers are expected to provide
the greatest impact into shaping the development strategies, with high network criticality levels associated
with these transformers.
Voltage Capacity
The Picton South region has several existing non-compliances relating to voltage capacity within the N-1
design criterion. These limitations are most sensitive to demand levels at the Busselton and Margaret River
substations7. Under peak demand conditions and following the loss of the single 132kV supply into
Busselton, existing voltage capacity issues arise relating to:
Inadequate steady state voltages – Picton South’s 66kV network is susceptible to low voltages,
excessive voltage step, and in the worst case, a complete loss of supply, or ‘blackout’, to the region.
Short and long term voltage instability – The dynamic response of the Picton South network is
insufficient in recovering short term voltages to acceptable levels following a contingency event.
Maximum supportable demand - These voltage capacity constraints limit the ability to meet the
forecast peak demand and connect additional load in the area. The existing Picton South maximum
supportable demand is currently limited to 46MW. Based on the past 2 years of data, this level is
exceeded for 2.1%8 (or 184 hours) of the year and is expected to increase with forecast growth in
the area.
Options Considered
Aligned with the long term strategy in the Bunbury load area, the identified development strategies to
address the range of network issues are based on the following two broad investment themes:
1. Conversion of the Picton South network to operate at 132kV; and
2. Retention of the existing 66kV network topology and asset base.
The development strategies proposed for the Picton South network have been developed with
consideration of Western Power’s 25 year ‘Central’ peak demand forecasts (2017-2042).
As discussed in more detail in sections 2 and 2, Western Power has completed detailed planning studies in
considering feasible network options to mitigate the multiple asset condition issues and voltage capacity
limitations within the Picton South region over the long term. These studies include load flow analysis,
dynamic and fault level studies as well as other technical assessments to determine the capacity delivered
by various options that achieve network compliance and adequately mitigate the identified network risks.
Assessment of a range of network drivers and Western Power’s 25 year peak demand forecasts within the
Picton South network over a 50-year evaluation period has led to the development of five discrete
development strategies based on the broad themes that include both network and non-network solutions:
1. Picton South 132kV conversion
a. Accelerated 132kV conversion
b. Staged 132kV conversion - Busselton terminal transformer
7 The level of supportable demand into Busselton and Margaret River will be used throughout the Options Paper as a baseline in defining the
Picton South’s limitations and comparing network development strategies.
8 Western Power currently manages this risk operationally by pre-contingently splitting the 66kV and 132kV networks into Busselton at demand
levels lower than the actual stability limit. Although these temporary measures manage these risks, the network is not compliant and
operating in an unsecure state.
EDM 49401234
Page ix
c.     Staged 132kV conversion - Picton terminal transformer
                  2.     Retain 66kV network
                        a.     Procure Network Control Services (NCS)
                        b.     Install additional reactive power support

Evaluation
The five capital investment development strategies shown in Table ES.2 were evaluated against a range of
financial and technical performance metrics. The development strategies consider asset rationalisation,
alignment to Western Power’s 66kV rationalisation strategy and increases to Picton South maximum
supportable demand.

Table ES.2: Financial and technical assessment of proposed development strategies

                                                                                     Asset Rationalisation –
                                                                    Relative to Picton South 66kV asset base (+/)

       Dev                                                                                                                                                                    Strategic
                                                   Total NPC

                                                                                                                                               Transmission Lines
                Description                                                                                                                                                  Alignment
     Strategy                                        ($M)

                                                                                                                              Primary Plant
                                                                                                              Substation Tx
                                                                                                                                                                              (Yes/No)
                                                                                                Terminal Tx
                                                                STATCOM

                                                                          Capbanks

                                                                                                                                                                      Max
                                                                                      Reactor

                                                                                                                                                                     Supp.
                                                                                                                                                                    Demand

                Accelerated 132kV                                 ↑          ↑            -         ↓             ↓                ↓            ↓
        1                                            156.1                                                                                                          84MW        Yes
                conversion                                         1          2          0            1              5            75          91km

                Staged 132kV conversion -                         ↑          ↑            -         ↓             ↓                ↓            ↓
        2       Busselton terminal                   143.6                                                                                                          84MW        Yes
                transformer                                        1          2          0            1              5            75          51km

                Staged 132kV conversion -                         ↑          ↑            -         ↓             ↓                ↓            ↓
        3                                            148.9                                                                                                          84MW        Yes
                Picton terminal transformer                        1          2          0            1              5            75          51km

                Retain 66kV network –                               -          -        ↑              -          ↓                ↓                 -
        4                                            174.19                                                                                                         76MW10      No
                Procure NCS                                        0          0          1            0              3            11               0

                Retain 66kV network –                             ↑          ↑            -            -          ↓                ↓                 -
        5       Install additional reactive          161.5                                                                                                          73MW        No
                support                                            1          2          0            0              3            11               0

The results of the options analysis identified Development Strategy 2 as the most efficient long term
solution for the Picton South region. Western Powers four key objectives of safe, reliable, efficient and
growth are also met under the Development Strategy 2 investment pathway.

This development strategy represents an optimised network plan that is lower in cost than a like for like
replacement solution, providing additional benefits including asset rationalisation and increases to

9       Total costs are expected to be higher as connection costs were not included. For more detail on the assumptions used, refer to Appendix K.
10      The maximum supportable demand is determined by the summation of the capacity of the procured NCS (30MW) and the existing maximum
        supportable demand (46MW)

                                                                                                                                                                       EDM 49401234
                                                                                                                                                                              Page x
maximum supportable demand to support the forecast peak demand, while providing additional spare
capacity to accommodate future growth opportunities in the region.
A sensitivity analysis11 was undertaken to determine the impact of variations in cost (+/- 20%) and the
‘Central’ 25-year peak demand forecast (+46%/-37%) to test the robustness of the recommended pathway.
The output of the sensitivity analysis has demonstrated an outcome consistent with the base case
economic analysis, in that Development Strategy 2 is still seen to have the lowest NPC compared to the
alternative development strategies presented.
Conclusion
Based on the options analysis and Western Power’s obligations under the Electricity Networks Access Code
2004 for major augmentations, Western Power recommends progressing the following investments under
Development Strategy 2, being the recommended network development pathway:
By 2022:
Uprate of the Picton-Capel/ Westralian Sands 71 line to support future energisation at 132kV
including:
Upgrade electrical fittings and post insulators to 132kV specification
2.5km of earthwire along the Picton-Capel 71 and 72 line circuits
Transfer Westralian Sands 66kV tee-line from Picton-Capel/Westralian Sands 71 to Picton-Capel 72
transmission line via the construction of a new 3km 132kV rated (energised at 66kV) wood pole single
circuit with ‘Lemon’ conductors.
By 2023:
Extension of the existing 132kV busbar at Busselton substation, including a new 132kV disconnector
Installation of a new 132kV Tx bay and 100MVA 132/66/22kV transformer at Busselton substation
By 2024:
Installation of a static and dynamic reactive support at Busselton substation including:
Install 1 x (+/-) 12MVAr of dynamic reactive support devices (i.e. STATCOM) and associated step-
up transformer equipment
Install 10MVAr capacitors and associated plant on 22kV tertiary winding of new Busselton
132/66kV transformer
The nominal12 capital cost of this option being $38.2 million is the subject of this Options Paper and
subsequent Regulatory Test Submission. This cost has been determined as part of the detailed cost
estimate process through Western Power’s Estimation and Value Assurance Section.
The recommended development strategy is a key decision that sets the investment direction for the entire
Picton South network to ensure that the asset condition and voltage capacity network issues are addressed
in a timely manner, while also providing additional benefits of asset rationalisation and spare capacity to
accommodate future growth beyond the forecast peak demand in the area.
Upon the completion of the individual investments in this first stage of investments, the system security
and supply risks associated with a single Picton terminal transformer contingency to the Picton South area
11 See Appendix E– Demand Growth Sensitivity Analysis for further detail
12 Nominal cost – includes indirects, risk and escalation
EDM 49401234
Page xiwill be addressed. Additionally, the network will achieve N-1 network compliance and the maximum
supportable demand at Busselton and Margaret River will increase from 46MW to 73MW to ensure the
forecast peak demand is met over the long term.
The remaining investments of the development strategy consist of further asset replacement works and the
complete conversion of one of the existing 66kV line circuits to 132kV. Upon energisation of the second
132kV supply into Busselton, the security of supply risks associated with the loss of both Picton terminal
transformers will be completely addressed. Furthermore, the completion of these works will provide
additional benefits including further asset rationalisation and maximum supportable demand increases
from 73MW to 84MW, providing enough spare capacity to accommodate future growth opportunities.
The recommended investment pathway has been developed based on the most current and available
information. Although unlikely, if strong growth drivers begin to emerge in the short to medium term, the
network development under Development Strategy 2 can be accelerated towards a third 132kV supply into
Busselton, with the increase in costs expected to be similar to Development Strategy 1.
It should be noted that the subsequent investments within the recommended strategy are expected to be
taken forward in due course and will undergo more detailed technical, economic, social and environmental
assessments with the most current available information to further develop and refine these individual
investments. In addition, the investments beyond the recommended scope works to be progressed may be
subject to future Regulatory Tests.
36km 34km 35km
CAP-BSN 72 – 44 MVA PIC-CAP 72 – 73MVA
To
MR BSN CAP PIC BUH
BSN-MR 71 – PIC-CAP/WSD 71 – 69 MVA
32 MVA CAP-BSN 71 – 52 MVA
To
WOR
33km 9km 22km
12km
To
WSD MRR
85km
BSN To
132kV PNJ
132 kV Existing
4 km To
66 kV Existing KEM
PIC-PNJ-BSN/KEM 81 – 167 MVA
86km
Figure 1: Existing Picton South network configuration
EDM 49401234
Page xiiInstall (+/-) 12 MVAr of
dynamic reactive support
Resupply WSD
and 10 MVAr static
customer
reactive support (2024)
substation (2022)
36km 34km 35km
CAP-BSN 72 PIC-CAP 72
To
CAP 3km PIC
MR BSN BUH
BSN-MR 71 PIC-CAP/WSD 71
CAP-BSN 71
To
WOR
33km 9km 22km
Extend the 132 kV busbar 12km
and install additional To
WSD MRR
100MVA 132/66/22 kV
terminal transformer (2023) Uprate 66 kV cct for 85km
BSN To
future 132 kV
132kV PNJ
132 kV Existing energisation (2022)
66 kV Existing
132 kV Future 4 km To
66 kV Future KEM
Decommissioned PIC-PNJ-BSN/KEM 81
86km
–
Figure 2: Development Strategy 2 – Stage 1 scope overview
36km 15km 19km 35km
26km
CAP-BSN 82
To
MR BSN 3km
PIC BUH
CAP
BSN-MR 71 PIC-CAP 81
CAP-BSN 71 To
WOR
12km 21km 9km 22km
12km To
MRR
WSD
85km
BSN To
132kV PNJ
4 km To
132 kV Existing KEM
66 kV Existing
PIC-PNJ-BSN/KEM 81
86km
Figure 3: Development Strategy 2 – Final configuration
EDM 49401234
Page xiii1. Background
1.1 Geographical Area - Bunbury Load Area
The Bunbury load area covers the south west corner of the Western Power network, stretching from Alcoa
Pinjarra in the north to Augusta in the south and just West of Wagerup and Worsley.
Transmission network infrastructure in the region is illustrated below in Figure 4.
Figure 4: Bunbury load area
EDM 49401234
Page xiv1.2 Picton South Network
The Picton South network supplies a subset of residential, commercial, agricultural and industrial
customers in the Bunbury load area. The boundary for the transmission and distribution networks in this
region is illustrated in Figure 5. The boundary envelops four Western Power owned substations (Picton,
Capel, Busselton and Margaret River) and one customer owned substation (Westralian Sands) in the Capel
region. Works in this area are the core focus of this options paper.
Electrically, the area is characterised as a lightly meshed network, consisting of two 66kV circuits emanating
from the Picton terminal transformers and a long single 132kV supply into Busselton substation. Although
Coolup substation is also supplied by the Picton terminal transformers, it has not been included in the
options assessment due to the following reasons:
Coolup is located north of Picton; and
A committed project is currently in advanced stages of the planning phase, involving a series of
distribution load transfers to the neighbouring Wagerup substation, facilitating the de-energisation of
the Coolup substation by 2021 and decommissioning of the Coolup substation assets by 2024.
Legend
Picton South network
Figure 5: Picton South aerial overview
EDM 49401234
Page xv1.3 Network Strategy and Network Development Plan
The Picton South development plans take into consideration multiple relevant network strategies, the
existing assets and network configuration within the Bunbury load area, in addition to proposed works
described within 10 year Network Development Plan (NDP). This approach ensures consistency and
demonstrates the network requirements over the longer term are well supported.
Table 1.1: Relevant network strategies
Document Purpose
A significant portion of Western Power’s 66kV networks are
approaching or have already exceeded their expected replacement
life, with many assets also in degraded condition, requiring assets to
either be replaced, maintained, upgraded or decommissioned.
66kV Rationalisation strategy
This strategy guides investment decisions related to the replacement
of 66kV networks in order to maximise the net benefit for network
Users and maintain appropriate asset types/volumes with respect to
current and forecast network conditions.
The Bunbury load area long term strategy identifies individual
Bunbury load area long term
investment projects to address specific individual drivers in the
strategy – 2017/18 update
Bunbury load Area within a 25 year horizon.
Western Power engaged an independent party to revisit and update
the Bunbury long term plan. This document provided updates to the
network strategy, following declining capacity drivers and
accelerated asset condition risks (specifically relating to the Picton
Bunbury load area long term terminal transformers).
staging report
The updates focused on developing a more detailed staging of the
works for the preferred Picton South investment pathway within a
10 year time horizon. It also included refining the accuracy of the
cost estimates.
The purpose of the Network Development Plan is to identify the
current and emerging transmission and distribution network
limitations to forecast demand, compliance, customer, reliability,
power quality and optimised asset condition network drivers over
Network Development Plan the period 2016/17 to 2027/28.
(2016/17 – 2027/28)
It also provides a summary of the proposed network and non-
network plans to address these limitations and supports the forecast
expenditure in the 10-year Business Plan (covering the period
2017/18 to 2027/28)
Based on the peak forecast data at the time, the Bunbury load area long term strategy - 2017/18 update
document proposed network development in the Picton South region to include a third 132kV supply into
Busselton by 2041, as illustrated in Figure 6.
The long term view also proposed maintaining Margaret River at 66kV for the foreseeable future, due to
the lack of current capacity drivers to trigger voltage conversion upgrades. Should future capacity drivers
emerge at Margaret River, suitable upgrade options will be investigated. However, it is important to note
that changes to the supply voltage at Margaret River are not expected to have significant impact to the long
term network development between Picton and Busselton.
EDM 49401234
Page xviThe long term view also proposes the resupply of Westralian Sands Substation at 22kV. Although this
supply arrangement is feasible, a more detailed assessment has been performed since to determine the
most suitable supply arrangement for this customer owned substation13.
Figure 6 illustrates upgrading the existing supply lines to 132kV along the existing corridors, which is only
indicative at this stage. The actual rebuilding of these circuits will largely depend how best to optimise the
upgrades with asset condition drivers, while minimising cost and environmental impacts.
Since this document was developed, peak demand growth rates have reduced further, creating significant
uncertainty around the need and timing for a third 132kV supply into Busselton.
36km 34km 35km
CAP-BSN 82 PIC-CAP 82
To
MR BSN PIC BUH
CAP
BSN-MR 71
CAP-BSN 71 PIC-CAP 81 To
WOR
33km 32km
12km
To
MRR
WSD
85km
BSN To
132kV PNJ
10km
132 kV 4 km To
66 kV KEM
22 kV PIC-PNJ-BSN/KEM 81
86km
Figure 6: Picton South Network Development – Long term strategic view
1.4 Developments in Peak Demand Forecast and Asset Condition
The 25 year peak demand forecasts in the Bunbury load area are forecast to experience a slight increase in
demand.
Historical peak demand forecasts have followed similar growth profiles, but higher growth trajectories in
the past have been heavily revised down over several years due to external influencing factors, including,
but not limited to:
Declining economic conditions;
Increased penetration of photovoltaic (PV) installations; and
Increased appliance efficiencies.
13 The Westralian Sands Substation supply arrangement assessment is discussed in more detail in Appendix I.
EDM 49401234
Page xvii1.5 Peak Demand Forecast
The peak demand forecasts are a key input into Western Power system studies that identify existing and
emerging network constraints on the Picton South transmission network.
During the development of this Options Paper, Western Power used the 2017 25 year peak demand
forecasts being the latest approved forecasts. Western Power’s Forecasting team has contributed to the
development of long term forecasts to support the ‘Whole of System Plan’ ongoing project which we have
used to validate the 2017 peak demand forecasts. Following this review, the preferred option remains valid.
Figure 7: Picton South region - 25 year ‘Central’ peak demand forecasts (MW)14
The 25 year 2017 ‘Central’ PoE10% and PoE50% System summer and winter peak demand forecasts for the
aggregated loads within the Picton South network are illustrated in Figure 7. The Picton South region is
forecast to peak during winter periods. On a substation level, Capel and Busselton substations are summer
peaking, whereas Picton and Margaret River are both winter peaking.
Table 1.2 highlights that the Picton South demand is expected to increase from 132.0MW to 149.3MW over
the 25 year period, representing a moderate annual growth rate of 0.7%. Historically, the Picton South
demand has been as high as 139.3MW, which is higher than the PoE10% Picton South System peak demand
(winter) forecast up until 2023. Despite milder peak demand conditions in more recent years, higher
historical demand indicate a level of latent demand that may be triggered by sustained periods of high
temperatures.
14 Coolup substation load is not included in the Picton South historical and forecast peak demand
EDM 49401234
Page 1Table 1.2: Picton South region - 25 year peak demand forecasts (MW) – PoE10% System (Winter) 15
Region 2018 2020 2022 2024 2026 2028 2030 2032 2034 2036 2038 2040 2042
Picton South 132.0 136.6 139.3 141.2 142.7 143.9 145.0 145.9 146.7 147.5 148.1 148.8 149.3
While the forecast increase in peak demand in the region will not trigger new constraints in the region
without a significant block customer load connection, the existing voltage capacity limitations described in
detail in section 3 are expected to increase further due to growth forecast in the area over the long term.
In addition to peak demand forecasts, Western Power also considers minimum demand conditions to
identify network constraints, which are shown in Table 1.3. Minimum demand conditions are modelled as
portion of the peak demand forecasts.
Table 1.3: Picton South region - 25 year minimum demand forecasts (MW) –PoE10% System (Winter)
Region 2018 2020 2022 2024 2026 2028 2030 2032 2034 2036 2038 2040 2042
Picton South 52.8 54.6 55.7 56.5 57.1 57.6 58.0 58.4 58.7 59.0 59.2 59.5 59.7
Table 1.4 highlights the PoE10% non-coincidental Substation peak demand forecasts at Busselton, Capel,
Picton and Margaret River substations. These forecasts are non-coincident, meaning these loads represent
the individual peak forecast demand of each substation, without regard to system demand, and are used to
determine whether adequate substation capacity exists to cater for existing and future network demand.
Figure 8 shows that Capel substation is forecast to exceed its capacity in the presented planning horizon
however, this capacity shortfall is only minor and will be addressed by committed works underway, as
discussed in section 4. No other substations are expected to experience any capacity shortfalls.
15 Western Power has also considered the Westralian Sands customer demand when performing network studies. This customer owned
substation has a Contract Maximum Demand, which is not shown for confidential reasons.
EDM 49401234
Page 2Figure 8: Picton South - 25 Year peak demand forecast - Substation (non-coincidental) PoE10%
Table 1.4: Picton South PoE10% Substation (non-coincident) peak demand forecast (MW) –
Forecast Year
Sub
Substation Capacity
(MVA) 2018 2020 2022 2024 2026 2028 2030 2032 2034 2036 2038 2040 2042
Busselton 71.1 54.6 56.7 57.8 59.4 60.3 61.0 61.7 62.3 62.8 63.2 63.7 64.0 64.4
Capel 21.6 27.4 26.0 26.6 26.2 26.0 25.9 25.8 25.7 25.6 25.6 25.5 25.4 25.4
Picton 59.7 48.7 47.9 48.2 47.9 47.7 47.6 47.5 47.4 47.3 47.2 47.1 47.1 47.0
Margaret
River 36.3 15.5 15.2 16.5 16.3 16.5 16.7 16.8 17.0 17.1 17.2 17.3 17.4 17.4
EDM 49401234
Page 32. Asset Condition
As shown in Table 2.1, all Western Power substations within Picton South have been established around
1960, with one Customer substation established in 1987. A significant number of substation assets are
approaching or have already exceeded their expected replacement life, with many assets also in degraded
condition, resulting in multiple safety, reliability of supply and security risks in the region. As per Western
Power’s Planning Standard, assets are replaced based on their condition and criticality to the network.
Asset replacements consider multiple network drivers to ensure optimised long term replacement plans are
developed.
Table 2.1: Picton South substation – Year commissioned
Substation Name Year Commissioned
Margaret River 1956
Busselton 1960
Picton 1962
Capel 1964
Westralian Sands 1987
Westralian Sands is a customer owned substation supplying Iluka North Capel mining operations. Western
Power has engaged this customer to understand and align future planning requirements, where possible.
At this stage, there are no changes to the customers’ requirements in terms of the level of supply and
service.
2.1 Asset Condition Summary
Most of the transmission assets within the Picton South region are rated at 66kV voltage, except for the
132/66kV terminal transformers at Picton and Busselton and two 132/22kV zone substation transformers
at Busselton.
A significant portion of these 66kV assets are approaching or have already exceeded their expected
replacement life, with many assets also in degraded condition. The 52 year old Picton terminal
transformers present the most immediate risk, as they supply the entire 66kV Picton South network and
are necessary to maintain N-1 system security to the region.
The Picton, Capel and Busselton supply and substation assets also have a significant volume of asset
condition issues that require addressing within the next 10 to 20 years. The condition assessments at these
substations were undertaken but limited to the following assets as they are the most material in terms of
investment options and financial impact.
Power transformer16 – terminal and zone substation transformers
Primary Plant17 - circuit breakers, disconnectors, CT’s and VT’s
Transmission Lines – conductors
16 Power transformer and are large, bulky, long lead time assets with high replacement costs, which generally present opportunities to optimise
replacement plans with other network drivers, such as demand.
17 Primary plant assets and transmission line structures are modular in nature, allowing these assets to be replaced individually under large
volumetric like for like programs.
EDM 49401234
Page 4 Transmission Lines – structures
Underpinned by Western Power’s 66kV Rationalisation strategy, an opportunity exists to develop an
optimised network plan to address the safety and reliability of supply risks, while securing the long term
system security in the Picton South region.
Western Power replaces assets using a risk-based approach which considers condition18, likelihood of
failure and consequence of failure. Where available, individual asset information and the condition of the
assets have been taken into consideration within the Option’s Paper’s analysis.
2.2 Power Transformers
Table 2.2 summarises the current condition and other key asset information for the power transformers in
the Picton South region (excluding Margaret River), including any replacement plans that are at a
committed stage.
Table 2.2: Picton South - Power transformers
Asset
Estimated
Plant Nameplate Health Committed
Substation Voltage remaining Age
# Capacity Condition Replacement Plans20
19 life
T1 66/22kV 15 MVA Poor 6 62 N
T2 66/22kV 19 MVA Failed n/a n/a N
T3 66/22kV 15 MVA Poor 6 62 N
Busselton
T4 132/66/22kV 100 MVA Good 52 16 N
T5 132/22kV 33 MVA Good 55 13 N
T6 132/22kV 33 MVA Good 62 6 N
T1 132/66/22kV 100 MVA Bad21 521 52 N
T2 132/66/22kV 100 MVA Bad21 521 52 N
Y – 132/22kV
T3 66/22kV 27 MVA Bad 18 51
Picton replacement
T4 66/22kV 33 MVA Good 51 18 N
Y – 132/22kV
T5 66/22kV 27 MVA Failed 16 52
replacement
T1 66/22kV 19 MVA Bad 14 54 Y – Installation of an
Capel additional 132/22kV
T3 66/22kV 19 MVA Poor 15 53 replacement
18 See Table A.1 in Appendix A for further detail
19 Based on a Condition Based Risk Management (CBRM) health index
20 See section 4 for further detail on committed works
21 Routine inspection and diagnosis of both transformers identified inherent manufacturing defects on both transformers (i.e. high resistance
‘hot joints’ on phase windings), which have been temporarily managed through retaping. As a result, the expected remaining life of both
transformers has been reduced from 17 to 5 years.
EDM 49401234
Page 5In addition to the safety and reliability of supply risks associated with the Picton terminal transformers,
these assets are critical in providing supply to the entire 66kV Picton South network and are necessary to
maintain N-1 system security to the region. Without adequate mitigation, the eventual failure of both these
transformers will result in the initial loss of up to approximately 46,000 customers supplied within the
region (of which 81 are on life support), followed by significant periods of rotational load shedding that
result in adverse impact on customers experience and reduced economic activity in the area.
2.3 Primary Plant
Table 2.3 lists the following key primary plant equipment information within the Picton South network:
Circuit breakers
Disconnectors
CT’s
VT’s
With no significant asset or growth drivers, Margaret River substation is expected to stay at 66kV for the
foreseeable future. The asset information has therefore been excluded from this table the costings.
Table 2.3: Picton South - Primary plant summary
Ave Age MRL # Beyond
Substations Asset Type Total % at end of life
(yrs) (yrs) MRL
Circuit Breakers - Oil 4 58 41 4 100
Circuit Breakers – SF6 4 14 33 0 0
Busselton Disconnectors 18 38 53 0 0
CTs (per phase) 27 14 40 0 0
VTs (per phase) 9 14 40 0 0
Circuit Breakers - Oil 5 45 41 5 100
Circuit Breakers – SF6 1 8 33 0 0
Capel Disconnectors 12 47 53 0 0
CTs (per phase) 12 11 40 0 0
VTs (per phase) 6 11 40 0 0
Circuit Breakers - Oil 2 48 41 2 100
Circuit Breakers – SF6 7 13 33 0 0
Picton Disconnectors 16 45 53 2 12.5
CTs (per phase) 18 22 40 3 16.7
VTs (per phase) 12 33 40 6 50
EDM 49401234
Page 62.4 Transmission Lines – Conductors
Transmission line conductors have an expected life of 80 years. Table 2.4 below provides a summary of key
information relating to the ratings, average age and condition for conductor assets within the Picton South
line circuits.
The key transmission line conductor and structure data for the transmission line circuits between Picton
and Busselton have been profiled in relation to their distribution along the line circuits within Appendix B.
Table 2.4: Picton South transmission line circuits – Conductors
Line Rating (A)
Rated for Overall
Conductor Ave Age Voltage
Transmission Line 132kV average
Length Summer Winter Type (yrs) (kV)
(Y/N)? condition
(km) (A) (A)
Picton-Capel/Westralian
31.89 639 737 Lemon 31 66 Y22 Good
Sands 71
Picton-Capel 72 34.79 639 737 Lemon 42 66 N Fair
Capel-Busselton 71 33.05 453 591 Lemon 41 66 N Fair
Capel-Busselton 72 34.40 388 446 Dog 51 66 Y23 Poor
Busselton-Margaret River
35.56 281 361 Dog/Lemon 51 66 N Poor
71
Picton-Pinjarra-
Busselton/Kemerton 81 - 12.7 639 737 Lemon/Bear 63 132 Y Poor
PIC end
Picton-Pinjarra-
37/3.50
Busselton/Kemerton 81 - 85.65 732 885 19 132 Y Good
AAAC
BSN end
Picton-Pinjarra-
Busselton/Kemerton 81 - 85.04 732 845 Bear/Lime 63 132 Y Poor
PNJ end
2.5 Transmission Lines – Structures
The expected mean replacement life of transmission line wood pole and steel structures are 62 years and
55 years24, respectively. The key transmission line conductor and structure data for the transmission line
circuits between Picton and Busselton have been profiled in relation to their distribution along the line
circuits within Appendix B.
Table 2.5 below provides a summary of key information relating to the type and age distribution of the
structures within the Picton South line circuits.
22 Picton-Capel/Westralian Sands 71 has been constructed to 132kV standard, including most post insulators and pole top hardwire equipment
23 Approximately 70% of the Capel -Busselton 71 circuit has been constructed to 132kV standard however, the conductor is ‘Dog’ type which is
not suitable for 132kV energisation, due to corona discharge issues.
24 Engineering assessment has been applied in determining the steel pole structure mean replacement life. Unlike wood pole structures, it is not
possible to derive a reliable and rational asset survival life from the historical low replacement volumes associated with steel pole structures.
EDM 49401234
Page 7The key transmission line conductor and structure data for the transmission line circuits between Picton
and Busselton have been profiled in relation to their distribution along the line circuits within Appendix B.
Table 2.5: Picton South transmission line circuits – Structures
Primary Age Distribution (%)
Ave
# of Length structure
Transmission Line 30-40 40-50 Age
structures (km) material 50 yrs
yrs yrs (yrs)
type
Picton-Capel/Westralian
181 31.89 Steel 2% 98% 0% 0% 31.5
Sands 71
Picton-Capel 72 221 34.79 Wood 0% 26% 74% 0% 35.3
Capel-Busselton 71 180 33.05 Wood 28% 0% 0% 72%25 36.3
Capel-Busselton 72 205 34.40 Wood 70% 0% 0% 30%9 29.4
Busselton-Margaret River
197 35.56 Wood 24% 5% 25% 46% 40.5
71
Picton-Pinjarra-
Busselton/Kemerton 81 - 69 12.7 Wood 45% 1% 36% 17% 34.1
PIC end
Picton-Pinjarra-
Busselton/Kemerton 81 - 309 85.65 Steel 100% 0% 0% 0% 15.9
BSN end
Picton-Pinjarra-
Busselton/Kemerton 81 - 380 85.04 Wood 53% 29% 0% 17% 27.0
PNJ end
25 A significant portion of the structures beyond 50 years old fall on the Capel-Busselton 71 & 72 line circuits fall within the first 12-15km from
the Busselton end. See Appendix J for further detail.
EDM 49401234
Page 83. Planning Drivers
3.1 Planning Criteria
Western Power has security, reliability and quality of supply obligations defined in the Technical Rules
(December 2016 – Rev 3) and identified in Chapter 12 of the Electricity Networks Access Code (2004). The
Technical Rules establish the planning criteria that Western Power applies across the SWIS. Western Power
owned substations in the Picton South region are planned under the N-1 criterion. Refer to section 25:
Appendix N for further detail on the Technical Rules requirements
3.2 N-1 Criterion – Steady State Network Performance
Relating to the steady state network performance requirements prescribed under Table 2.2 of the
Technical Rules, several existing (post-tap) low voltage and (pre-tap) excessive voltage step issues arise
under high system demand conditions, following the loss of the single 132kV supply into Busselton26.
Following the loss of the single 132kV supply into Busselton, the network is currently limited when:
demand in the region exceeds 118MW (but remains below 128MW), the region’s 66kV network is
susceptible to unacceptable (and non-compliant) low voltages and excessive voltage step that can
result in damage to Western Power and customer equipment;
demand in the region exceeds or is forecast to exceed 128MW27, the 66kV network is susceptible to
a ‘blackout’ scenario, resulting in the initial loss of supply of up to 46,000 (of which 81 are on life
support) customers supplied within the Picton South region.
As illustrated in Figure 7 in section 1.5, the Picton South peak demand has historically been well above
118MW and close to or above the 128MW threshold on numerous occasions. With slight growth forecast
over the long term, the likelihood of voltage related issues is increasing. These corresponding Busselton and
Margaret River aggregate demand at these limits are 48MW and 52MW, respectively.
In addition, the Busselton 22kV distribution network is now increasingly at risk of sustained overvoltages
during daytime periods, due to a combination of lower overall demand, higher efficiency residential
equipment and increasing connection of rooftop solar that is reducing daytime demand. During these
minimum daytime conditions, the zone substation transformer tap changers are reaching their minimum
tap positions, resulting in a loss of voltage control and inability to reduce voltages, putting the network at
risk of sustained overvoltages for the next contingency (i.e. load rejection scenario).
3.3 Short Term Voltage Stability
Western Power’s Transmission Planning Guidelines require all transmission and distribution buses to
recover to 0.9pu of nominal voltage without employing under voltage load shedding, following the worst
case credible contingency. Transient overvoltage requirements must also be satisfied in accordance with
Technical Rules Clause 2.2.10. Despite the Picton to Busselton line circuits having sufficient thermal
capacity, the relative high impedance 66kV network has already exceeded its voltage capacity, resulting in
voltage stability limitations in the area. Sensitivity studies performed over a range of generation dispatch
26 Low voltage and excessive voltage step issues arise over multiple contingencies, with the worst case being the loss for the single 132kV supply
into Busselton.
27 By 2021, both Picton T3 and T5 substation transformers will be replaced and upgraded to 132kV. Although these works result in the entire
Picton demand being supplied via the 132kV network, it only increases the limits to 122MW and 131MW respectively, as demand changes at
Busselton and Margaret River are significantly more sensitive that at Picton
EDM 49401234
Page 9conditions, identified that at a power transfer of 48MW into Busselton and Margaret River, the voltages at
Busselton and Margaret River adequately recover.
Historically, the aggregate Busselton and Margaret River demand levels have been much higher than the
stability limit28. At these levels, the network is unsecure and susceptible to sustained low voltages that can
lead to equipment damage, further outages and in the worst-case, a ‘blackout’ scenario to the region.
Furthermore, this risk is anticipated to worsen with peak demand growth forecast in the Picton South
region over the long term.
3.4 Long Term Voltage Stability
Western Power’s Transmission Planning Guidelines require that all parts of the network must demonstrate
a positive reactive power margin prior to the operation of tap changing, following the worst-case credible
contingency. The reactive power reserve at a point in the network is the amount of additional reactive
power that could be supplied from that point, whilst maintaining voltages within the prescribed limits
specified in clause 2.2.2 (a) of the Technical Rules.
The existing reactive reserve margin was calculated at Busselton 66kV busbar, which is most sensitive to
demand changes. The results of the long-term stability studies identified an existing reactive reserve deficit
of 14.5MVAr at the Busselton 66kV busbar, following the loss of the 132kV supply line into Busselton. The
corresponding level of demand at Busselton and Margaret River that will result in adequate long-term
voltage stability is 51MW.
3.5 Maximum Supportable Demand
The maximum supportable demand is defined as the maximum level of power transfer (or demand) that
achieves adequate network performance relating to thermal, steady state voltages, voltage step and
voltage stability. Clause 2.3.8 of the Technical Rules states that the maximum supportable demand is
limited to 95% of the stability limit.
Based on the above definition, the maximum power transfer into Busselton and Margaret River is the level
of demand that achieves adequate steady state and transient network performance is 48MW, resulting in a
maximum supportable demand of 95% of this power transfer, or 46MW.
Based on the historical and forecast Busselton and Margaret River peak demand levels shown in Table 3.1
and Table 3.2, the existing maximum supportable demand is inadequate.
Network augmentation works are required to increase the maximum supportable demand to meet the
forecast peak demand at Busselton and Margaret River to approximately 68MW in 2028 and 73MW in
2042.
Table 3.1: Busselton and Margaret River historical peak demand (2013–2018) – PoE10% System peak
Peak Demand 2013 2014 2015 2016 2017 2018
Busselton & Margaret River 55.3 48.1 57.5 61.5 55.8 58.4
Table 3.2: Busselton and Margaret River forecast peak demand (2019-2042)– PoE10% System peak
Peak Demand 2019 2020 2021 2022 2023 2024 2025 2026 2027 2028 2042
Busselton & Margaret River 60.9 62.7 63.5 64.5 65.3 66.0 66.7 67.2 67.8 68.2 72.6
28 Busselton and Margaret River demand reached 56MW during 2017 system peak conditions
EDM 49401234
Page 10You can also read