MH370 Controlled Eastward Veering and Descent After the 6th Arc - Research Square
←
→
Page content transcription
If your browser does not render page correctly, please read the page content below
MH370 Controlled Eastward Veering and Descent After the 6th Arc Vincent Lyne ( vincent.lyne@utas.edu.au ) Retired Scientist https://orcid.org/0000-0002-7718-4050 Research Article Keywords: Burst Frequency Offset, Burst Timing Offset, MH370, Doppler Shift Posted Date: December 27th, 2021 DOI: https://doi.org/10.21203/rs.3.rs-962332/v2 License: This work is licensed under a Creative Commons Attribution 4.0 International License. Read Full License
MH370 Controlled Eastward Veering and Descent After
the 6th Arc

Vincent Lyne 1*

 1 Retired Scientist. Hobart. Tasmania. Australia
 * Correspondence: Vincent.lyne@utas.edu.au (Note: UTas is not to be affiliated with this
 article)

 Abstract

 Past expert analyses of communication signals from missing Malaysian Airlines
 MH370 reconciled Burst Frequency Offset (BFO) errors up to the 6th of 7 arcs for
 a southerly track. After the 6th arc, the Satellite Data Unit (SDU) power-up or
 reboot resulted in settling errors in the last two data points that were ignored (first
 search) and later bounded (second search). For the second search, investigators
 invoked a high-speed vertical descent to account for BFO errors for the south
 track fuel-starved scenario. Two searches disappointingly failed to find the
 implied violent-crash site. We report that interpretations were flawed in
 suggesting the plane dived vertically, as investigators did not recognize that BFO
 extrapolations implicitly implied mathematically that the plane was also cruising
 along the south track, but with no fuel. Our reanalysis used the “Penang
 Longitude” (PL) theory that predicted a similar southerly track to the 6th arc, and
 that MH370 subsequently veered eastwards and descended. Doppler Shifts from
 vertical motions were replaced with plausible horizontal veering and declination
 of a high-speed aircraft. Veering predicted by the PL theory plus controlled
 descent plausibly accounts for nominal 7th arc BFO discrepancies for the warm-
 reboot scenario. We conclude that the fuel-starvation scenario analyses wrongly
 implied a vertical high-speed crash that ignored the impossible implicit southerly
 cruise, with no fuel, assumption. Instead, MH370 was piloted to a precise glide
 landing under power, east of the 7th arc.

 Keywords: Burst Frequency Offset, Burst Timing Offset, MH370, Doppler Shift

 Introduction

 Malaysian Airlines MH370, a Boeing 777-200ER equipped with the Inmarsat Classic Aero
 system, has not been found since it went missing on the 8th of March 2014 with 239 people on
 board [1]. Inmarsat engineers identified regular monitoring “Log-on Interrogation”
 communications after each hour of inactivity, and two phases of specific logon requests from
 the aircraft near 18:25 and 00:19 UTC [2]. Detailed complex analyses of the Burst Timing
 Offset (BTO – distance-based measurement) and the Burst Frequency Offset (BFO – relative
 speed-based measurement) from these communications resulted in seven BTO global arcs
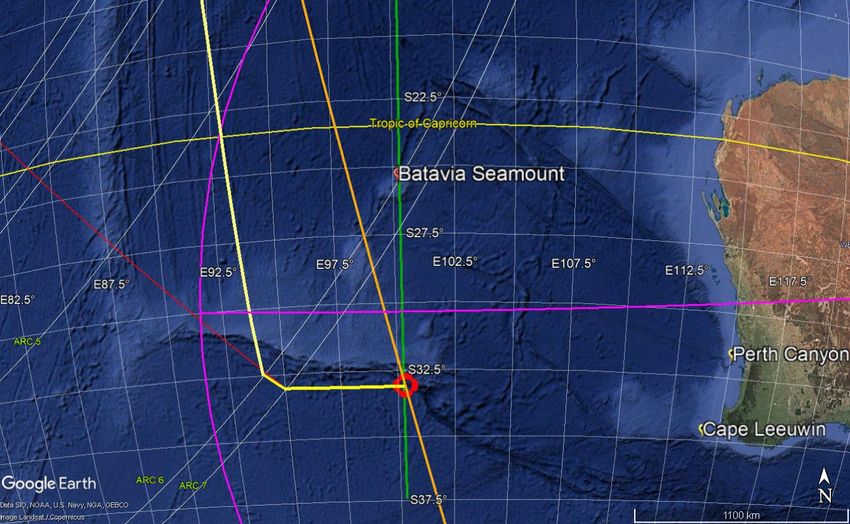
along which the aircraft was located at different times, centred around the Inmarsat satellite
located nominally above 0.5oN and 64.5oE [2].

 Reconstructed potential flight paths, using the arc timings and BFO-estimated
speeds/directions, generally supported a persistent southerly track down to the 6th arc [2,3]. At
the 7th arc, anomalies in BFO remained after extrapolation of the BFO predicted from a good
statistical fit to previous BFOs [3] and resolution of a wide variety of potential error sources
[4]. Errors from the power-up settling anomalies from the Satellite Data Unit (SDU) were also
bounded but discrepancies remained between a predicted BFO of 260 Hz and nominal
observed BFOs of 182 Hz and -2 Hz respectively at the last two communications 8 seconds
apart at the 7th arc [4]. Hypotheses on whether the SDU was started up from a power-off-on
engine flame-out event (Hypothesis 1 – fuel-starvation scenario, long cold-start settling
behaviour) or a warm reboot electronic event (Hypothesis 2 – electronic switching, short
reboot settling behaviour) led to an extended BFO range error, and an extreme range which
considered BFO noise [4]. The extreme range resulted in unrealistic descent rates, so mid-
point values were used to determine that, if the southerly track continued to the 7th arc,
anomalies could only be resolved from up-down motions, unaccounted for by the SDU which
only compensated horizontal motions. This led Holland [4] to generally conclude that,
discounting the unrealistic extreme range (primarily from the flame-out Hypothesis 1), a 0.68
g (g is Earth’s surface gravitation acceleration constant) acceleration took place during the 8
seconds leading to a nominal high-speed descent of 10,800 fpm (feet per minute). These
conclusions resulted in probable search locations of MH370 within bounds along the 7th arc
which were supported by highly promising drift model analyses of recovered debris [5].
However, extensive, and extended, searches around these bounded locations along with
previous aerial searches and satellite searches, were unsuccessful [1].

 In early 2021, the fuel starvation theory which guided previous searches was challenged
by the “Penang Longitude” (PL) theory [6] which not only reconciled the drift model analyses
but also reconciled the pilot’s home simulator tracks, satellite anomalies and hydroacoustic
sounds heard at listening stations at Perth Canyon [7], Cape Leeuwin and Diego Garcia [8];
which were all abandoned previously as they could not be reconciled with a crash site along
the 7th arc. The theory was predicated on the notion that there is one precise location for
MH370, namely where the 33oS latitude intersects the longitude of Penang, where all evidence
appears to plausibly intersect at an ultra-deep hole. The theory of a piloted glide landing was
supported by expert investigations of debris damage by Vance [9] who has quietly suffered
unfair unsubstantiated criticism of his excellent careful work. The explanation for what
happened between the last two communications at the 7th arc may critically determine whether
this theory is more plausible than the failed fuel-starvation theory.

 As shown in Figure 1, the southerly track of MH370 approximately concords with this
theory’s intuitive explanation that the track taken was to stay outside of the western boundary
of the Jindalee Over-the-Horizon Radar Network (JORN) from the Laverton station in
Western Australia [10]. Note that the track shown in Figure 1 was changed from the original
track outside JORN [6] by moving the southerly track to intersect the 6th arc at a bearing of
about 6.7o east from due south. This change was made to align more closely with the estimated
southerly track from the reconciled BFO analyses down to the 6th arc. We assume for this
study that the aircraft is flying southerly at the 6th arc, as the primary interest is what caused
the BFO changes after the 6th arc at the last two communications at the 7th arc: the first at
00:19:29 UTC, and the second at 00:19:37 UTC.

 The 7th arc’ BFO evidence and analyses to date suggesting an uncontrolled violent crash
are at odds with this theory’s prediction of a meticulously planned precise piloted powered
glid landing, which was also suggested independently from the detailed careful interpretations
of debris “witness marks” by Vance [9] –implying that there was little or no randomness in
 the plan. Hence, our aim is to test whether alternate plausible explanations of the 7th arc BFOs
 are possible and in keeping with this theory’s prediction of an eastward turn of MH370 once
 past the southern end of the JORN range located approximately at 32oS, with the actual turn
 taking place near 33oS latitude, at a waypoint, ultimately towards a secret deep hole.

Figure 1 Main map features of the BFO analyses. The white curves are the 7 arcs. The purple curve is the Jindalee
Over the Horizon Radar Network (JORN) range, and the purple line marks the southern limit of the range. One
postulated example flight path of the Penang Longitude theory is in yellow showing an approximately southerly
track that intersects the 6th arc (ARC 6) at 94oE, then veers to 33oS, 95oE at the 7th arc (ARC 7), and then proceeds
to the postulated Penang Location (red circle) intersected by the Penang longitude (green vertical line). Note that
this track is a modification of the original predicted southerly track outside the JORN range; this version cuts the
southwest corner of JORN at a bearing of 6.7o east of a southerly track. Note for later purposes, the close
alignment of the track running between the 6th and 7th arcs with the bearing to the satellite. The orange line
running northeast is one of the simulation tracks from the pilot’s home simulator [1] which passes precisely over
the Penang Location. The depth at the Penang Location hole is just under 6000 m according to Google Earth Pro.

 Much has been written about the BFO analyses, and since there is general acceptance of
 BFO interpretations of a southerly track up to the 6th arc, our focus, as per Holland [4], will be
 on the change between the two final 7th arc BFOs; in particular on alternate explanations for
 anomalies arising from Holland’s calculated nominal range for the observed BFOs [4]. We
 focus on anomalies for the “warm start” Hypothesis 2, rather the extreme anomalies for
 Hypothesis 1 where fuel starvation leads to engine flame-out followed by a restart of the SDU
 using power from the Auxiliary Power Unit (APU) [4]. The “warm start” refers to a warm
 reboot from a power switching rather than a fuel-starved power outage, which is more
 compatible with the PL theory’s prediction that the aircraft was undergoing preparations for
 its descent phase. In any case, the precedence for this power glitch assumption was established
 by a previous such event (at 18:25 UTC) when the aircraft clearly did not run out of fuel.

 Method
The main difference between our proposed analysis and past analyses is that we allow the
 aircraft track to vary, and to veer eastwards from a southerly track at the 6th arc for a descent
 along the 33oS latitude to a destination at the PL location. This contrasts with the fuel-
 starvation theory which required the aircraft to maintain its southerly track – that was assumed
 to be compensated for by the SDU unit [2]. The other difference is that the up-down motions
 analysed by Holland [4] are implicitly incorporated into a flight descent model where the
 aircraft descends at a declination angle to the horizontal plane. For our analyses, we also
 ignore the 6.7o difference between the predicted track (Figure 1) and a southerly track required
 by the BFO analyses up to the 6th arc. We assume that the actual track is southerly at the 6th
 arc and only analyse differences from this at the last two communications at the 7th arc.

 These changes are incorporated into the standard Doppler Shift model of equation (1) that
 defines the frequency change observed from a moving electromagnet source:

 ∗ (1)
 =
 ( − )

 Where: speeds are in kilometres per hour (kph); frequencies are in Hertz (Hz); is the
 speed of light (1.079e+9 kph); is the speed component of the aircraft velocity vector (kph)
 that is aligned with the vector from the aircraft to the Inmarsat satellite (positive towards the
 satellite); is the uplink frequency from the aircraft to the satellite (1646.6525 MHz); and
 is the received Doppler-shifted frequency (assuming no compensation was applied).

 The magnitude of velocity was calculated from the aircraft track, heading and elevation
 to the Inmarsat satellite, and an assumed declination angle according to equation (2).

 = ∗ cos( − ) ∗ cos ( − ) (2)

 Where: heading and track angles are measured clockwise from North; is the ground
 speed of the aircraft; is the aircraft to satellite elevation angle from horizontal (positive and
 set to 38.8ofor the 7th arc following Holland [4]); is the aircraft declination angle (positive
 for descent); and and are heading angles at ground level for the satellite and aircraft
 respectively (so 0o is a track to the North and 180o is a South track).

 The calculated velocity magnitude ( ) is used in equation (1) following the appropriate
 sign conventions. The first cosine term in equation (2) accounts for the satellite elevation
 angle modulated by the aircraft declination, so that when these angles are the same the
 frequency offset is at an absolute maximum as the aircraft is proceeding directly to the satellite
 or away from it. Likewise, for the alignment of the satellite and aircraft headings in the second
 cosine term. The two equations represent the model we used to calculate expected
 uncompensated BFOs for various combinations of aircraft track angle ( ) and declination
 angle ( ). Other parameters were fixed as listed in Table 1.

 Table 1 Ancillary parameters for the BFO calculations.

 Parameter Description Value
Inmarsat Satellite Location [2] Ground projected location of the 0.5 N, 64.475 E
 o o

 Inmarsat Satellite at 00:19 UTC
Inmarsat Satellite Elevation [4] Elevation angle from the aircraft 38.8o
 location to the satellite
Aircraft Location and heading Estimated by Ashton et al. (2015) [2] Location: 34.7oS, 93.0oE
at 7th arc Heading: 323.98o from North
Aircraft Location at 7th arc According to the PL theory Location: 33.0oS, 95.0oE
 Heading: 320.99o
Aircraft speed at 7th arc In kph 829 kph [2]
First BFO at 7th arc: at 00:19:29 Predicted for south track and Predicted 260 Hz
UTC [4] observed Observed 182 Hz
Second BFO at 7th arc: at Predicted for south track and Predicted 260 Hz
00:19:37 UTC [4] observed Observed -2 Hz

 Our aim with the analyses was to investigate the change of BFO between the last two 7th
 arc communications. We had the choice of using the Ashton et al. (2014) [2] location (Table
 1) or the PL theory location [6]. We chose the PL location since it is the focus of the analyses
 and the coincidence of the integer latitude and longitude crossing (33.0oS, 95.0oE) at the 7th
 arc seemed remarkable and was predicted by the PL theory as a waypoint (Figure 1).

 The BFO error at the two times in Table 1represent the difference between predicted BFO
 for a frequency-compensated south track and measured SDU-frequency-compensated BFO.
 If the south track was correct, the SDU frequency compensation and predicted frequency
 compensation would match. In other words, a match of horizontal-motion-compensated BFOs
 would imply that the aircraft was indeed on a horizontal southerly track – as witnessed for
 arcs prior to the 7th arc. The 7th arc mismatch was interpreted by previous investigators as due
 to vertical motions not compensated by the SDU – leading to the high-speed descent
 conclusion [4]. By contrast, the PL theory suggests that the SDU was compensating for an
 eastward-veered track which would lead to a mismatch of frequency compensations between
 predicted and observed, in addition to any uncompensated vertical motions. It is this mismatch
 which we investigate using equations (1) and (2) to predict BFO errors expected between the
 south track and an assumed eastward-veered track (with positive values implying the aircraft
 was tracking more rapidly away from the satellite).

Results

 For a level flight (no declination), the BFO difference between the south track (180o track)
 and other track angles are shown in Figure 2. At the south track reference, the difference is
 zero and increases as the track veers eastward towards angles smaller than 180o. Westward
 veering would lead to BFO changes of the wrong sign (increasing towards the satellite), and
 hence discounted.

 The 80 Hz dashed line marks the approximate location of the mismatch at the first 7th arc
 communication (80 Hz = Predicted 260 Hz – Observed approximate 180 Hz). The mismatch
 would require a veering eastward of less than 8o from the south track, and it is in the right
 direction. This small angle change suggests also that the aircraft may have started to veer from
 a southerly track just before the first of the communications at the 7th arc. Implying that the
 path from the 6th arc to that point is less veered than suggested by the general PL path in Figure
 1.

 The second communication mismatch was nearly 260 Hz and the maximum veering
 (where the aircraft track is aligned to the satellite direction but moving away from the satellite)
 occurs at about 141o heading giving a value of 220 Hz. Implying that during the 8 seconds
 between communications, the aircraft would need to veer 39 degrees or at a rate of 4.875
 degrees per second – compared to nominal aircraft turning rates of about 3 degrees per second.
Even though the bulk of the BFO mismatch is explainable, a significant amount (40 Hz) is not
explainable by a veering model alone. Note that the heading required for maximum BFO is
closely aligned coincidentally with the bearing to the satellite as noted in Figure 1. The totality
of the required veering from the 6th arc is well matched in explaining much of the nominal
BFO change.
 200
 BFO (Hz) relative to South Track

 100

 80Hz
 0
 -100

 100 120 140 160 180

 Track Angle (degrees clockwise from North)

 Figure 2 Variation of BFO (Hz) relative to a south track (180o track) with track angle measured in
 degrees clockwise from North. The dashed vertical line marks the approximate track which aligns with
 the aircraft to satellite direction. Note the directionality of the BFO change is such that if the aircraft is
 moving faster away from the satellite (as it will when it veers towards 141o heading), the SDU will
 compensate for the reducing frequency. So, a positive error as displayed means the error is defined as
 Predicted (BFO at 180o) – Measured (BFO at Track Angle).

 For the indicated track range, the rate of decline of BFO with track angle as shown in
Figure 3 is greatest at 180o, and zero when the track is aligned with the direction to the satellite.
In other words, eastward veering produces the greatest BFO change rate at the south track,
and the change with track angle is minimal when the track is aligned with the satellite
direction. At the south track, one degree of track veering to the east, with no up-down motion,
produces 10 Hz BFO decrease – a change that requires 588 fpm downward motion according
to Holland’s model.
BFO (Hz) change per degree eastward track ch

 10
 5
 0
 -5
 -10

 100 120 140 160 180

 Track Angle (degrees clockwise from North)

 Figure 3 Variation of BFO change per degree of track angle change. The dashed vertical line marks the
 approximate track which aligns with the aircraft to satellite direction.

 With declination included the range of BFO variation with track angle and declination
angles are as contoured in Figure 4. For reference, the predicted 10,800 fpm high-speed
descent of Holland corresponds to about 13.78o declination in Figure 2, with a maximum BFO
mismatch of over 350 Hz explainable – compared to about 184 Hz for the up-down Holland
model. The 260 Hz mismatch is now explainable using the approximate 250 Hz contour in
Figure 4, which suggests a minimum declination required of about 3o. The contour displays
the balance between veering and declination required to achieve a BFO mismatch. This angle
is within normal aircraft descent angles near the satellite-aligned track, and achievable within
the 8 second window. The minimum declination required also suggests that the aircraft was
descending at the last signal.

 At the south track, changes are near-maximal with veering and declination (Figure 4),
whereas at the satellite-aligned track, declination is mainly responsible for changes. Of
interest to note is that the veering to an easterly track was not achieved by the time of the
second communication, implying that, if our interpretations are correct, the aircraft was still
veering towards the final east track. The sensitivity to track change is also minimal at about
141o as shown in Figure 3, implying that the estimate of track angle at this point is not highly
sensitive to BFO change. But there is high sensitivity in the opposite direction as the track
veers further eastward, but we are unable to resolve this due to the lack of communications
beyond the 7th arc.
20

 400
 Descent Angle (degrees)

 400

 15 300

 200
 350
 10

 100

 300

 5 0
 -50

 100
 150

 250
 50

 150

 -100
 0
 -100

 20
 100

 20

 50
 0

 0

 0
 100 120 140 160 180

 Track Angle (degrees)

 Figure 4 Contoured variation of BFO (Hz) with track angle and declination angle. The vertical line
 marks the approximate track which aligns with the aircraft to satellite direction.

Discussion

 Brilliant past technical analyses of complex BFO changes deciphered from satellite and
 phone communications provided much needed clarification of MH370’s southerly track to the
 southern Indian Ocean up to the 6th arc. However, later analyses of perplexing added BFO
 changes at the last two communications were apparently resolved through uncompensated up-
 down motions as there was no reason to assume a change from the fuel-starvation-theory
 southerly track. The south track was extrapolated to the 7th arc and vertical velocity shifts
 required to explain the remaining BFO changes led to the high-speed descent scenario and an
 assumed unobserved violent impact. Instead, the damage found on the recovered flaperon (and
 the limited amount of debris) was convincingly demonstrated, by finite-element simulations
 conducted by the MH370-Captio group [11], as well as careful detailed expert investigations
 by Vance [9], as most likely due to a piloted glided landing, and incompatible with a high-
 speed nosedive that would have crumpled the leading-edge nose [11] and obliterated the plane
 into many pieces within the blink of an eye [9].
Whilst the glided landing scenario is now more plausible, the notion that MH370 was in a
vertical high-speed dive at the 7th arc is still prevalent in public media [12] and in acrimonius
criticism of alternative theories. A glided landing at the 7th arc is also clearly at odds with the
suggested uncontrolled high-speed descent demanded to explain the BFO changes. The failure
of two comprehensive searches predicated on the theory of fuel-starvation-at-the-7th-arc has
stymied plans for another search. The final location of MH370 must also explain all plausible
evidence, one of which is the BFO interpretations at the 7th arc. No theory has succeeded in
meeting these requirements till now.

 Despite the reconciliation of all other evidence by the PL theory there were no previous
analyses to support the predictions of this theory that MH370 veered eastward at the 7th arc to
follow an easterly track at 33oS latitude. The theory is specific about when such a change
should occur in relation to the JORN network range. The observation that such a change could
be underway at 33oS, 95oE, which is on the 7th arc is either a remarkable coincidence, or a
planned waypoint for a track change as predicted by the PL theory. These observations and
the failures of the fuel-starvation theory led us to re-examine interpretations of the final BFOs
from MH370.

 Results of our veering model suggests that the first BFO is explainable with less than 8o
eastward veering from the south track at the 7th arc where BFO changes are sensitive to track
change. Reconciliation of the second BFO required a track change to about 141o heading
(approximate south-eastward track), a declination angle of at least 3o, but with an aggressive
turn rate. These parameters seem more reasonable and plausible, than an unverified high-
speed descent. This disparity (of a small veering change and declination versus high-speed
descent) is understandable as the Doppler Shift is due to the speed change in the direction of
the satellite, regardless of whether it is from horizontal veering of an aircraft flying at high
speed, or a presumed sudden diving down at high speed (whilst also maintaining its south
track). But the two different interpretations give two very different and incompatible landing
scenarios.

 To resolve this, we suggest respectfully that past investigators forgot that the extrapolation
of the BFO curve along the south track to the 7th arc implied that the plane was implicitly
required to be flying south at its cruise speed; in addition to undergoing the high-speed vertical
dive, with no fuel left. However, the official narrative for this scenario in media stories, which
is inconsistent with the mathematics, is that the plane simply ran out of fuel and accelerated
into a high-speed vertical dive. The mathematical narrative for this scenario is that the plane
ran out of fuel but was still able to magically continue flying at cruise speed along the south
track, and within 8 seconds also experienced an added (to the cruise speed) high-speed vertical
dive of about 10,800 fpm. The two narratives are incompatible, implausible, and
disappointing. The first does not explain the BFO changes, and the latter is clearly impossible.
It’s an honest mistake, that we should not unduly dwell upon, brought about by the complex
assumptions in interpreting the BFO discrepancies. If we are to resume the search for MH370
we need to stop the misinformation on what happened at the second arc and show respect to
investigators such as Vance [9] who have articulated a piloted glided landing scenario based
on well-founded objective investigations of debris evidence.

 Whilst details of the tracks predicted for the 6th arc and the first of the communications at
the 7th arc aren’t precise, results of the veering analyses can explain the 7th arc BFO changes.
The analyses suggest that the turn to an easterly track was not complete and changes to the
aircraft’s flight were still underway. The overall changes in flight track align closely with the
general predictions of the PL theory. We also note that the short disturbance to power to the
SDU after the 6th arc (Hypothesis 2) may have been from preparation for the descent, predicted
by the analyses to be underway by the end of the 7th arc. Whereas the fuel-starvation theory
assumes the power-up was from engines flaming out and the cold SDU restarting sometime
 later – the extreme Hypothesis 1 scenario.

 Simply put, what we have demonstrated is that the Doppler Shifts observed at the 7th arc
 were not from implausible extreme combined vertical and horizontal motions, but were
 instead due to plausible horizontal veering of an aircraft travelling at high speed. Past analyses
 were hamstrung by wayward interpretations of complex analyses, by the south track fuel-
 starvation theory, and understandable lack of consideration of alternate scenarios which could
 have aided in optimizing the search strategy [13]. Still, given the uncertainties and
 disappointments to date in finding MH370, we caution that this and other predictions of the
 PL theory need to be subjected to further critical evaluation despite the theory being the only
 one that reconciles most if not all plausible evidence, which now includes the BFO changes
 at the 7th arc. This study should however be judged by its merits in explaining the BFO signals
 at the 7th arc.

 Conclusions

 The baffling BFO changes at the final two communications from MH370 at the 7th arc are
 more plausibly due to the aircraft veering eastward and in a controlled descent, as opposed to
 an uncontrolled high-speed vertical dive. These interpretations were predicted by the Penang
 Longitude theory which also predicts that MH370 proceeded to a precise piloted glide landing
 where the 33oS latitude intersects the longitude of Penang at an ultra-deep hole. These revised
 interpretations refute the high-speed descent demanded by the fuel-starvation southerly-track
 theory as that conclusion was based on incorrect interpretations of the BFO assumptions and
 analyses. We can state with greater certainty that MH370 veered eastward and was descending
 after its last known communication.

 Acknowledgements

 Many keen scientists indirectly contributed to this study which would not have been
 possible without their remarkable technical detective work on diverse aspects of finding
 MH370. We are all deeply indebted to all the brave folks who took part in the search for
 MH370 in one of the most inhospitable, but ecologically unique, ocean environments on the
 planet. Despite not finding MH370 your work has contributed to excluding vast areas of the
 ocean from further searches, and hopefully restored faith in humanity’s kindness to those who
 lost loved ones. I am particularly indebted to Larry Vance for his independent expert thorough
 investigations of debris damage; a quiet voice of reason lost in the cacophony of contrived
 misinformation.

1. ATSB. The Operational Search for MH370; Canberra. Australia., 2017; p. 440pp.
2. Ashton, C.; Shuster Bruce, A.; Colledge, G.; Dickinson, M. The Search for MH370.
 Journal of Navigation 2014, 68, 1-22, doi:10.1017/s037346331400068x.
3. Davey, S.; Gordon, N.; Holland, I.; Rutten, M.; Williams, J. Bayesian Methods in the
 Search for MH370; Springer Singapore: 2016.
4. Holland, I.D. MH370 burst frequency offset analysis and implications on descent rate
 at end of flight. IEEE Aerospace and Electronic Systems Magazine 2018, 33, 24-33,
 doi:10.1109/maes.2018.170048.
5. Griffin, D.A.; Oke, P.R.; Jones, E.M. The search for MH370 and ocean surface drift –
 Part II; CSIRO Oceans and Atmosphere: Hobart. Australia, 2017; p. 26pp.
6. Lyne, V.; Lyne, M. Unravelled cryptic pathways of MH370-goodbye and travel-path
 secrecy reveals landing details and precise location. Researchgate 2021, 36pp.,
 doi:10.13140/RG.2.2.12116.94084/1.
7. Butler, D. Sound clue in hunt for MH370. Nature 2014, 510, 199-200.
8. Kadri, U. Effect of sea-bottom elasticity on the propagation of acoustic-gravity waves
 from impacting objects. Sci Rep 2019, 9, 912, doi:10.1038/s41598-018-37626-z.
9. Vance, L. MH370 Mystery Solved; Group of Three Publishing: 2018.
10. Wikipedia. Jindalee Operational Radar Network. Available online:
 https://en.wikipedia.org/wiki/Jindalee_Operational_Radar_Network (accessed on
 March 2021).
11. MH370-Captio. MH370: Was Air Traffic Control deliberately misled? Available
 online: https://www.youtube.com/watch?v=Qk1CxO9XGyQ (accessed on
12. Gregersen, E. Malaysia Airlines flight 370 disappearance.
 https://www.britannica.com/event/Malaysia-Airlines-flight-370-disappearance 2021.
13. Wikipedia. Scenario optimization. Available online:
 https://en.wikipedia.org/wiki/Scenario_optimization (accessed on October 2021).
You can also read