Methodology for the 2023 Food and Agriculture Benchmark
←
→
Page content transcription
If your browser does not render page correctly, please read the page content below
Methodology for the
2023 Food and Agriculture
Benchmark

December 2022
Table of contents

Foreword                                                               4

Food and Agriculture Benchmark – the benchmark cycle                   5
          A systems approach                                            5

          Public consultation and feedback                              6
                     Feedback overview                                  6

          Stakeholder engagement                                        7
                     Input from farmers                                 7
                     Community of Practice sessions                     8
                     Expert Review Committee                            8

Outline of the methodology for the 2023 Food and Agriculture
Benchmark                                                              10
          Value chain approach – companies in scope of the benchmark   10
                     Ensuring a meaningful assessment                  11

          Approach to weighting                                        11

          Approach to scoring                                          12

          Draft assessment                                             13

          Presentation of results                                      13

          Food and Agriculture Benchmark and spotlight benchmarks      14
                     Access to Seeds Index                             14
                     Seafood Stewardship Index                         14

          Alignment with WBA’s Nature Benchmark                        15

          Timeline                                                     15

Indicators for the 2023 Food and Agriculture Benchmark                 17
          A. Governance and strategy                                   17
                     A1. Sustainability strategy                       17
                     A2. Accountability for sustainability strategy    18
                     A3. Stakeholder engagement                        19
                     A4. Lobbying and advocacy                         19

          B. Environment                                               20
                     B1. Scope 1 and 2 greenhouse gas emissions        20
                     B2. Scope 3 greenhouse gas emissions              20
                     B3. Ecosystem conversion                          21
                     B4. Sustainable fishing and aquaculture           22
                     B5. Protein diversification                       22
                     B6. Soil health and agrobiodiversity              23
                     B7. Fertiliser and pesticide use                  24

Methodology for the 2023 Food and Agriculture Benchmark                     2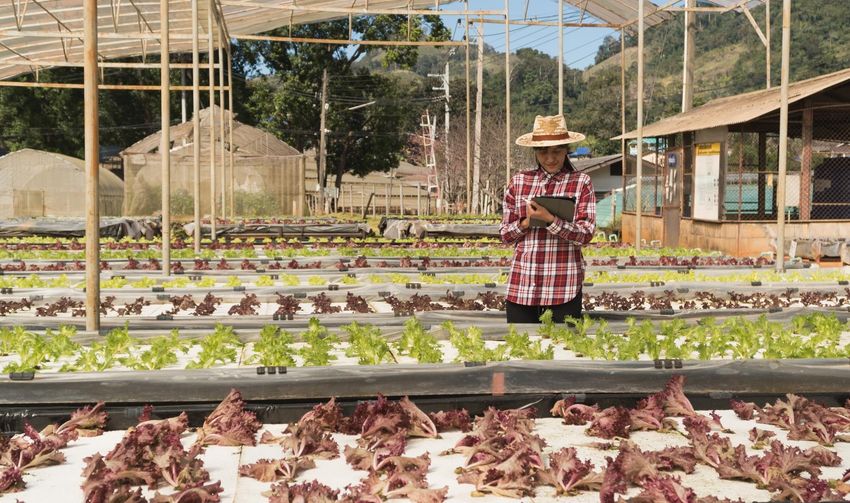
B8. Water withdrawal                                                24
                     B9. Food loss and waste                                             26
                     B10. Plastic use and packaging waste                                27
                     B11. Animal welfare                                                 28
                     B12. Antibiotic use and growth-promoting substances                 28

          C. Nutrition                                                                   30
                     C1. Availability of nutritious foods                                30
                     C2. Accessibility and affordability of nutritious foods             32
                     C3. Clear and transparent labelling                                 33
                     C4. Responsible marketing and promotion of nutritious foods         33
                     C5. Workforce nutrition                                             35
                     C6. Food safety                                                     35

          D. Social inclusion                                                            36

          Core social indicators                                                         36

          Respect human rights                                                           37
                     D1. Commitment to respect human rights                              37
                     D2. Commitment to respect the human rights of workers               37
                     D3. Identifying human rights risks and impacts                      37
                     D4. Assessing human rights risks and impacts                        37
                     D5. Integrating and acting on human rights risks and impacts        37
                     D6. Engaging with affected and potentially affected stakeholders    37
                     D7. Grievance mechanisms for workers                                37
                     D8. Grievance mechanisms for external individuals and communities   37

          Provide and promote decent work                                                37
                     D9. Health and safety fundamentals                                  37
                     D10. Living wage fundamentals                                       38
                     D11. Working hours fundamentals                                     38
                     D12. Collective bargaining fundamentals                             38
                     D13. Workforce diversity disclosure fundamentals                    38
                     D14. Gender equality and women’s empowerment fundamentals           38

          Act ethically                                                                  38
                     D15. Personal data protection fundamentals                          38
                     D16. Responsible tax fundamentals                                   38
                     D17. Anti-bribery and anti-corruption fundamentals                  38
                     D18. Responsible lobbying and political engagement fundamentals     38

          Food systems transformation-specific social inclusion indicators               38
                     D19. Child labour                                                   38
                     D20. Forced labour                                                  40
                     D21. Living wage                                                    41
                     D22. Health and safety of vulnerable groups                         41
                     D23. Farmer and fisher livelihoods                                  42
                     D24. Land rights                                                    43

Annexes                                                                                  45
          Annex 1: References                                                            45

          Annex 2: Definitions                                                           53

Methodology for the 2023 Food and Agriculture Benchmark                                       3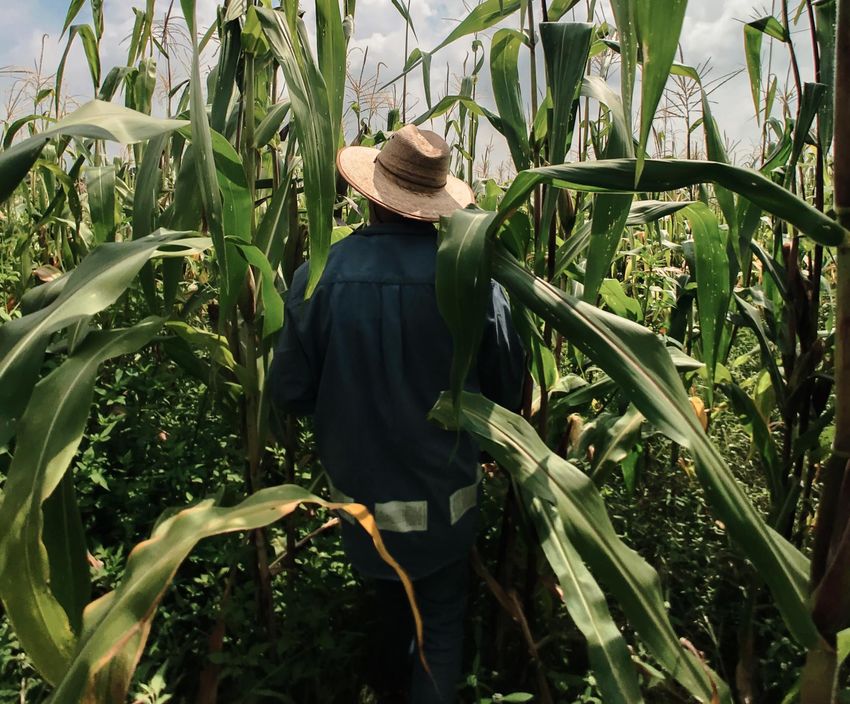
Foreword

This is the methodology for the 2023 Food and Agriculture Benchmark, the second time WBA will
assess the performance of 350 of the largest and most influential food and agriculture companies
along the food value chain. The first Food and Agriculture Benchmark was published in 2021. Its
results were shared alongside the 2021 UN Food Systems Summit (UNFSS). The 2023 iteration of the
benchmark will be published in the autumn of 2023 and show the progress made by the private
sector on key topics underpinning the food systems transformation agenda. Serving as an
accountability tool for the private sector, the benchmark will support and feed into the UNFSS
stocktaking event proposed in 2023.

Corporate accountability is a driver for change. In 2021, 22 companies pledged to improve the
environmental, social and nutritional impact of their business operations and supply chains, as
measured by WBA’s benchmark. Over three quarters made progress on at least one topic deemed
crucial for food systems transformation, as shown in the 2022 G7 Sustainable Supply Chain Initiative
(SSCI) publication. All companies improved their public disclosure by publishing relevant reports or
policies. The project findings, published in October 2022, provided ample reason to be optimistic
about companies’ ambitions to improve.

WBA is committed to continuing to work with our Allies across the stakeholder ecosystem to ensure
standards improve over time, align with the sustainable development goals (SDGs) and that corporate
sustainability data remains a public good. Our methodologies serve as road maps to set out what
good looks like based on societal expectations and the latest scientific research. It is therefore vital
that our methodologies are continuously updated to ensure they are relevant and to increase
alignment and coherence with other benchmarks and reporting frameworks – within WBA and
beyond – to ensure complementarity.

After three years spent developing the methodology from 2019-2021, the research process and
outcomes of the first benchmark in 2021 showed that the methodology had included the key topics
of food systems transformation. Seeing companies from five out of the six value chain segments
represented in the top ten confirmed the relevance and importance of a value chain approach and
indicated that leadership is necessary and possible for companies across the entire food and
agriculture system.

These learnings underline the robustness and completeness of the methodology. However, to further
sharpen indicators and better highlight corporate expectations and best practices, WBA has carefully
reviewed the methodology. This document reflects relevant updates to the methodology, which
incorporates both internal learnings and external feedback from companies and other stakeholders
following the first publication. Advice was sought from the Expert Review Committee (ERC), a group of
independent multi-stakeholder experts, through review sessions with specialists and companies and a
public consultation process. All updates have been made carefully and in line with WBA’s
methodology review principles to ensure maximum comparability with benchmark results from the
first iteration in 2021.

This document is a result of that process, highlighting changes at an indicator level and providing an
overview of the methodology that will be the basis for the second iteration of the benchmark in 2023.
It also outlines changes to the benchmark development process and a timeline.

Methodology for the 2023 Food and Agriculture Benchmark                                                    4

Food and Agriculture Benchmark – the
benchmark cycle

Following the publication of each benchmark, we carefully review our methodology. In doing so, we
aim to capture learnings, incorporate feedback and integrate new insights and scientific developments
while ensuring a meaningful comparison between the first and second iteration of the benchmark. As
such, the changes made focus largely on streamlining the benchmark development process. Small
changes at the indicator level were also made, without changing indicator rationale and goals.

Since the publication of the first iteration of the benchmark in September 2021, we have sought
feedback from stakeholders through multiple means, including company webinars, farmer
roundtables, discussions with the benchmark’s ERC and a public consultation. The 2021 benchmark
showed that the methodology had included the key topics of food systems transformation,
confirming the relevance and importance of our value chain approach and indicating that leadership
is necessary and possible for companies across the entire food and agriculture system. However,
changes have been made to the methodology in response to stakeholder needs and new insights.

A systems approach
Food systems have major impacts on our health, society and the environment, and private sector
action is crucially needed to address these challenges. Taking a holistic approach, companies in the
benchmark are assessed across the measurement areas of governance and strategy, environment,
nutrition and social inclusion. The methodology for WBA’s 2023 Food and Agriculture Benchmark
translates the food systems transformation agenda into 46 indicators. It builds on more than three
years of research and collaboration with a wide range of experts and stakeholders, including other
benchmarking and standard-setting organisations. The indicators and scoring guidelines serve as a
road map to guide companies through this transformation by identifying the areas of attention
alongside clear expectations for companies. An overview of the indicators is shown in Figure 1.

FIGURE 1: OVERVIEW OF INDICATORS IN THE FOUR MEASUREMENT AREAS

Methodology for the 2023 Food and Agriculture Benchmark                                                 5

Public consultation and feedback
We received feedback on the methodology from a range of stakeholders, including companies across
the value chain, civil society, financial institutions, multilateral organisations, governments and
independent experts. Stakeholders also shared how they are using the methodology. We welcome the
fact that companies are using the methodology and their scorecards as guidance and a road map to
improve their sustainability practices and reporting. Several companies are keen to learn more and
reached out to use the methodology as a tool for an internal gap analysis. Other stakeholders and
platforms leverage the methodology and specific topics or indicators to inform their own work and
engage with their stakeholders. To further help other organisations to align with global initiatives for
their own national benchmarking activities, WBA and The Food Foundation have developed a toolkit
based on the methodology for the Food and Agriculture Benchmark. The Food Future Foundation and
FACE, with support from ECube, have developed a national food systems benchmark to assess 50
Indian food and agriculture companies using the toolkit. We are also collaborating with GAIN to
support the development of a national benchmark in Bangladesh, with Solidaridad in South Africa and
other interested parties in Pakistan and Cameroon, based on the WBA methodology.

Feedback overview
All feedback was compiled and carefully considered to refine the methodology. The following section
provides an overview of the main input and how it was incorporated. Indicator-specific refinements
are outlined underneath the respective indicators further down in the draft indicator section of this
document. In general, these refinements have no impact on indicator rationale, ensuring
comparability of indicator outcomes between the 2021 and 2023 iterations of the benchmark.

TABLE 1: OVERVIEW OF KEY FEEDBACK RECEIVED

  Feedback                                                How it was incorporated

  Indicator on lobbying                                   Following feedback, recommendations by the
  Need to address corporate lobbying practices.           ERC and in alignment with other benchmarks
                                                          and initiatives, indicator A4 (lobbying and
                                                          advocacy) was added to the governance and
                                                          strategy measurement area. It is the only
                                                          indicator to be added to the methodology,
                                                          which now comprises 46 indicators.
  Transparency of scoring guidelines                      Building on the scoring guidelines of the 2021
  Need for more clarity on scoring criteria.              benchmark, as published on our website, and
                                                          incorporating learnings and feedback allows us
                                                          to share the elements for companies to meet for
                                                          each indicator in the indicator section of this
                                                          document (seeIndicators for the 2023 Food and
                                                          Agriculture Benchmark). These elements form
                                                          the basis for scoring each indicator.
  Extend differing responsibilities across the            An unconditional scoring approach will be
  value chain                                             applied. Companies receive a score for every
  Implement elemental scoring (i.e. per indicator         element they meet, irrespective of other
  element) to better acknowledge and differentiate        elements. A maximum score is achieved if a
  company approaches and responsibilities.                company meets all elements (see Approach to
                                                          scoring for more information).

  Reflect the fact that expectations for companies        The more indirect or even limited impact on
  further upstream in the food value chain                nutrition by a small subset of companies in the
                                                          upstream segments of the value chain led us to

Methodology for the 2023 Food and Agriculture Benchmark                                                     6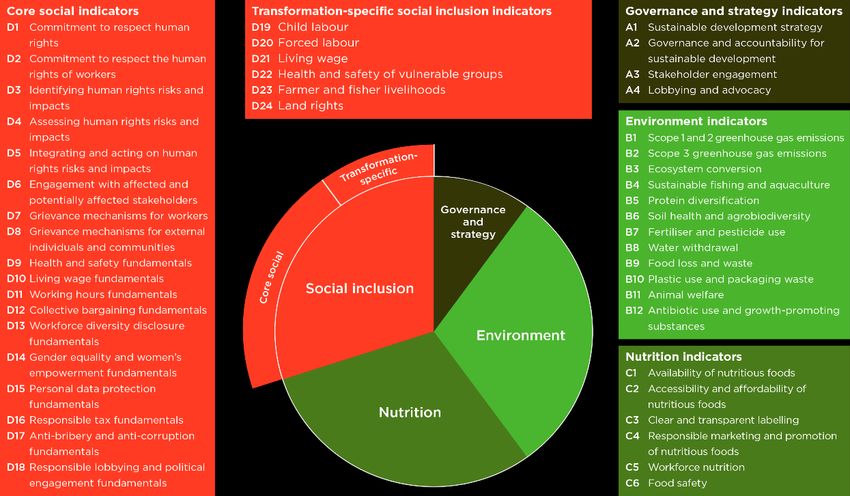
regarding nutrition topics differ from                  reconsider the weighting approach for this
  downstream companies.                                   subset (see Approach to weighting for further
                                                          details).
  Leading practices                                       The Insights Report, published on 15 March
  Interest in what good performance looks like.           2022, shines a light on leading practices across
                                                          the benchmark’s four measurement areas. It
                                                          provides a more practical understanding of
                                                          what ‘good’ performance looks like, across
                                                          topics as well as sectors and companies. The
                                                          respective leading practice webpages will be
                                                          updated and supplemented moving forward.
  Engagement through draft assessment                     For the next iteration of the benchmark, WBA
  Interest in including a best practice answer in         will not issue a questionnaire to companies to
  the questionnaire to guide companies.                   supplement data collection but will instead
                                                          share a draft assessment. Companies are invited
                                                          to review the draft assessment, which provides
                                                          an overview of the elements the company does
                                                          and does not meet, based on data and
                                                          information provided by the company in the
                                                          public domain.
  Targets                                                 Where a target universally agreed on by the
  The level of ambition of a target should be             global community exists, this target is referred
  reflected in the scoring guidelines, so that            to in the elements and used for scoring
  companies with ambitious targets get credit             purposes. For instance, while companies can
  over companies with any target.                         score for setting targets to reduce greenhouse
                                                          gas emissions (B1 and B2), companies with
                                                          ambitious targets, such as those that are in line
                                                          with the Paris Agreement, score higher.

Stakeholder engagement
Throughout the review process, WBA engaged with several stakeholders and experts to reflect on and
refine indicators, where needed. We focused on the nutrition dimension particularly, as this is the
most novel, and corporate expectations, especially for upstream companies, are less clearly defined.
WBA held three designated sessions, two with a select group of experts and one with companies in
scope of the benchmark. The aim of the first expert session was to clarify business asks for
downstream companies for a few specific indicators. The second expert session aimed to better
understand corporate contributions from upstream companies, diving into specific value chain
segments. The third session with companies discussed corporate contributions from several different
non-consumer-facing industries. The roundtables helped us to refine relevant indicators and sharpen
the methodology. Relevant changes are articulated in the nutrition indicator section with key changes
highlighted in the boxes below each respective indicator

Beyond the area of nutrition, several expert conversations on topics across all measurement areas
were held, including but not limited to indicators A4 (lobbying and advocacy), B5 (protein
diversification), B9 (food loss and waste), B10 (plastic use and packaging waste) and D23 (farmer and
fisher livelihoods).

Input from farmers
Additionally, we built on the series of farmer roundtables that took place in 2019, by conducting
interviews with farmers around our methodology and benchmark. While the focus in the past was on
hearing from smallholder farmers in developing countries, this year we spoke to farmers in developed

Methodology for the 2023 Food and Agriculture Benchmark                                                       7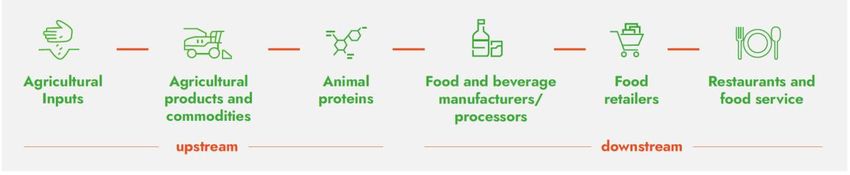
markets, with the aim of better understanding and discussing how companies in scope of the
benchmark can support farmers in their transition to sustainable agriculture practices and resilient
livelihoods. We made three farm visits and spoke to nine farmers in the Netherlands, encompassing
fruit and vegetables, dairy and livestock farmers. Some farmers had sustainable certifications, some
did not. It became clear that all farmers felt very strongly about the need for companies across the
value chain (especially agriculture input, animal feed and retail companies) to improve their
sustainability practices. Farmers often consider themselves the weakest actors in the value chain. It is
therefore paramount that farmers in developed as well as developing countries get sufficient support
to implement sustainable agriculture practices while maintaining or improving their livelihoods. The
outcomes of these interviews are reflected in this methodology, particularly in indicator D23. Going
forward, we will keep engaging with farmers, inviting farmer representatives to join our Alliance and
speak at events to ensure their input, concerns and ideas are heard and incorporated.

Community of Practice sessions
To facilitate peer-to-peer learning, incentivise improvement of performance and better understand
the process of change companies experience internally, WBA engages with companies between the
research cycles. In Community of Practice (CoP) sessions, we focus on a specific benchmark topic and
invite companies to share their learnings, challenges and journey towards realising impact. WBA
provides a neutral space for companies to have an open discussion and invites an organisation from
its Alliance with relevant topical expertise to set the scene and further disseminate the insights and
learnings from the benchmark results.

In the first half of 2022, we focused on regenerative agriculture and workforce nutrition, while in the
second half of the year, we will support dialogues on farmer and fisher livelihoods. Expert dialogues
informed the methodology review and continue to feed into the respective CoP sessions.

Expert Review Committee
The development of the methodology for the Food and Agriculture Benchmark is overseen by an
independent multi-stakeholder Expert Review Committee (ERC). The members of the ERC span
multiple backgrounds and geographies. The ERC reviewed and discussed the methodology and
proposed revisions during sessions in June and November 2022.

TABLE 2: MEMBERS OF THE EXPERT REVIEW COMMITTEE FOR THE FOOD AND AGRICULTURE BENCHMARK

  1         Ann Tutwiler (chair)            Senior Fellow at Meridian Institute, Professor at Davidson
                                            College. Former Director General, Bioversity International
  2         Chris Brett                     Lead Agribusiness Specialist, World Bank

  3         Danielle Carreira               Head of Finance Sector Engagement, Tropical Forest Alliance at
                                            World Economic Forum
  4         Tony Siantonas                  Director of Scaling Positive Agriculture, World Business Council
                                            for Sustainable Development
  5         Ignacio Gavilan                 Director of Sustainability, The Consumer Goods Forum

  6         Fabrice DeClerck                Science Director, EAT Foundation, and Senior Scientist, Bioversity
                                            International
  7         Elinor Newman-                  Associate, Systemiq
            Beckett
  8         Sara Golden                     Fair Value Chains Advisor, Oxfam Novib

Methodology for the 2023 Food and Agriculture Benchmark                                                          8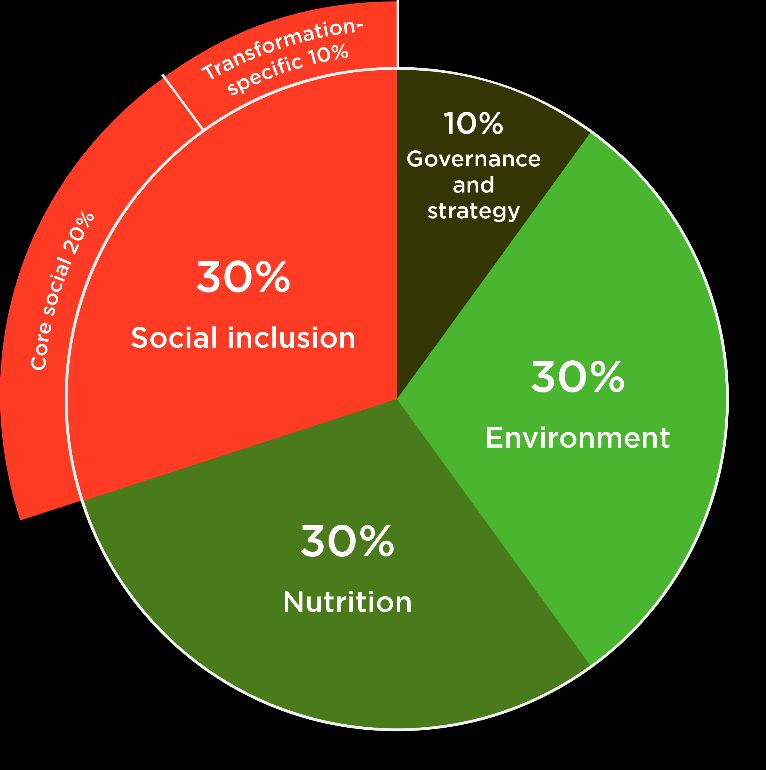
9         Jessica Fanzo                   Bloomberg Distinguished Professor of Food Policy and Ethics,
                                            Johns Hopkins University
  10        Michael Ojo                     Country Director Nigeria, Global Alliance for Improved Nutrition

  11        Pascal Murasira                 Independent agribusiness consultant, Wageningen University,
                                            and Special Advisor Youth Employment & Inclusion, Pan-African
                                            Farmers’ Organization
  12        Shachi D. Gurumayum             Director, AgriMayum
            Sharma
  13        Yewande Kazeem                  Journalist and founder of Wandieville Media

  14        Lesley Mitchell                 Associate Director, Sustainable Nutrition, Forum for the Future

  15        Yunike Phiri                    Partnerships Officer, World Food Programme, Zambia

Methodology for the 2023 Food and Agriculture Benchmark                                                        9
Outline of the methodology for the 2023 Food and Agriculture Benchmark The benchmark will continue to focus on the entire food value chain. With companies assuming differing roles and responsibilities across the multiple segments and industries that the benchmark covers, we want to ensure a meaningful assessment, evaluating companies on the issues that are most material to them. Value chain approach – companies in scope of the benchmark A transformation to healthy, sustainable and just food systems requires action from all actors across the value chain. Companies throughout the value chain, from farm to fork, have a role to play, both individually and collectively. The 350 companies assessed in the benchmark span the entirety of the food and agriculture value chain. The benchmark encompasses companies active in the agricultural inputs, agricultural products and commodities, animal proteins, manufacturing and processing, retail and food service segments. FIGURE 2: THE SIX VALUE CHAIN SEGMENTS Five of the six segments were represented in the top ten of the 2021 ranking, confirming that leadership and positive change can and must come from every part of the value chain. This supports WBA’s guiding principle that a company of a certain size and influence can and must contribute holistically across the food systems transformation agenda. Insights into the performance of all six value chain segments are outlined in the Insights Report published in March 2022. The 350 companies in the benchmark are part of WBA’s SDG2000, the 2,000 most influential companies from around the world that hold the power to shape our future. The SDG2000 list is updated once a year in January. Updates reflect revised methodologies and refined benchmark scopes, changes in keystone metrics such as revenue and number of employees, and mergers and acquisitions. Some changes have also been made to the list of the 350 companies in scope of the 2023 Food and Agriculture Benchmark. Please see the most recent list on our website. Food and agriculture companies have a vast collective supply chain presence – one which significantly exceeds their direct operational presence. However, the full extent of their supply chains is not well understood, hampered by a lack of transparency resulting from minimal corporate disclosure. We are gathering further insights into corporate supply chains through WBA’s supply chain and impact project funded by the IKEA Foundation. The project focuses on a select sample of companies from the Food and Agriculture Benchmark and how their performance in the benchmark on a set of indicators Methodology for the 2023 Food and Agriculture Benchmark 10
correlates with promoting sustainability in their supply chains. Outcomes of the project will be
published in December 2022 providing further learnings and insights into the methodology.

Ensuring a meaningful assessment
Given the role and influence of the 350 companies in global food systems, every company in the
benchmark has a role to play in all four measurement areas. As such, all 350 companies are assessed
on each measurement area. However, some topics are not applicable to certain companies along the
value chain, as their degree of influence and impact on certain topics varies. Non-applicability
assessments are based on the business activities and scope of operations for companies in each
segment of the value chain, including an industry-level analysis where necessary. There are, therefore,
a limited number of indicators in the environment and nutrition measurement areas that are not
applicable to some of the companies in scope.

For example, companies that do not rear animals or source animal products through their own
operations or supply chains are not assessed on indicators B11 (animal welfare) and B12 (antibiotic
use and growth-promoting substances). Similarly, companies that do not manufacture or sell
consumer-facing products are not assessed on indicators C3 (clear and transparent labelling) and C4
(responsible marketing). In addition, indicator C1 (availability of nutritious foods) has different scoring
guidelines to distinguish between consumer-facing and non-consumer-facing companies (e.g.
agricultural production or ingredient companies). Where indicators are deemed not applicable, the
weight is redistributed evenly among the remaining indicators in the respective measurement area.

Approach to weighting
The three main measurement areas of environment, nutrition and social inclusion are considered
equally important for the food systems transformation agenda. Therefore, these three measurement
areas carry an equal weighting of 30% each. Within the social inclusion measurement area, the core
social indicators account for 20% and the transformation-specific indicators a further 10%. Another
10% is given to the overarching governance and strategy measurement area. A company’s overall
score is equal to the weighted sum of the scores received for each measurement area.

As with the first iteration, the 18 core social indicators receive a weighting of 1% each. However,
indicators D4 (assessing human rights risks and impacts) and indicator D5 (integrating and acting on
human rights risks and impacts) will now receive a weighting of 2%, given the fundamental
importance of human rights due diligence. More on the core social indicators can be found in the
Social transformation framework.

Methodology for the 2023 Food and Agriculture Benchmark                                                       11
FIGURE 3: WEIGHTING DISTRIBUTION OF THE FOOD AND AGRICULTURE BENCHMARK

Based on the learnings from the first iteration of the benchmark as well as feedback from the ERC,
stakeholders and companies, WBA reconsidered the weighting approach for a small subset of
companies in the upstream segments of the food and agricultural value chain that have a more
indirect or even limited impact on nutrition. These companies, largely present in the agricultural
inputs segment, will only be assessed on two out of six indicators in that measurement area. As such,
and given their limited impact on nutrition, it was agreed that for those companies, the weighting of
the nutrition measurement area will be lowered to 20%. The remaining 10% will be allocated to the
environment and social inclusion measurement areas.

Approach to scoring
A set of guidelines for each indicator is used to score companies. Each indicator has a fixed scale by
which the company receives a score depending on the scoring criteria. WBA scores have a 0-2 range: a
score of 0 reflects no performance and a score of 2 reflects best performance. Each indicator is assessed
against a set of predefined criteria related to the ‘elements’ outlined in the section Indicators for the
2023 Food and Agriculture Benchmark below. To accommodate differences in the sphere and degree
of influence of corporate action across the value chain, the respective scoring guidelines may differ
depending on the value chain segment.

In contrast to the methodology for the 2021 iteration of the benchmark, scoring guidelines no longer
follow a strict cumulative scoring approach. Based on learnings from the first iteration and feedback
received, scoring guidelines have been adapted to an unconditional scoring approach. This means
that companies can receive a score for any element they meet, irrespective of whether they meet
previous elements.

In line with WBA’s other transformation benchmarks, the Food and Agriculture Benchmark will apply
this scoring approach for the following reasons:

           •    Simplicity: scoring guidelines are clear, straightforward and easy to understand,
                benefitting companies, stakeholders and researchers in the assessment process.

Methodology for the 2023 Food and Agriculture Benchmark                                                     12
• Capture corporate performance more accurately: companies will score on every
element they meet, irrespective of whether they meet other elements. This will allow us
to better capture corporate activities that do not clearly build upon one another.
• Flexibility: increased flexibility to remove, add or rescore elements over time, thereby
ensuring maximum consistency over time.
• Data analysis: data is available at an element level, increasing insights and analysis of
corporate performance.
The core social indicators are assessed differently as they were developed to apply to all industries
and focus on fundamentals. They represent expectations that all companies should be meeting but
are not necessarily 'leading practice' or proxies for good performance. As such, each indicator is
limited to 1 point and broken into the following levels:
• Met: the company met all the elements for a particular indicator (1 point)
• Partially met: the company met some elements for a particular indicator (0.5 points)
• Not met: the company did not meet any of the elements for a particular indicator (0 points).
Draft assessment
Companies will be assessed against all indicators of the methodology, based on relevant data from a
company’s and other third-party disclosure. To do this, WBA will work with a third-party research
provider. WBA will designate contacts for each company in scope, for engagement purposes,
throughout the benchmark development process.
Companies will receive a draft assessment, which provides an overview of the company’s performance
at an indicator level. Additional information provided by companies will be used to complete the
assessment. All data used for the benchmark is already public or could be made public. Only data at
the company parent/group level and provided to WBA in the English language will be considered. The
2023 Food and Agriculture Benchmark will include corporate data for 2021-22.
Presentation of results
Companies are individually assessed and ranked against all other companies in scope of the
benchmark as well as by measurement area and segment. Segment rankings allow a peer-to-peer
comparison and an understanding of the role of different segments in the food system. Rankings are
an absolute assessment of a sector’s performance against the expectations for the transformation,
presented as a relative comparison between the companies in the benchmark.
The performance of each company is summarised in a scorecard, which includes:
• a summary description and performance overview of the company
• the rank and total score in the benchmark
• rank by measurement area and segment
• segment ranking summary
• leading practices for topics in each measurement area
• risks and opportunities across each measurement area
• comparison of performance with the 2021 iteration.
Methodology for the 2023 Food and Agriculture Benchmark 13Food and Agriculture Benchmark and spotlight benchmarks The Food and Agriculture Benchmark takes a holistic approach to food systems transformation, assessing companies throughout the food value chain on a broad set of indicators in four measurement areas: governance and strategy, environment, nutrition and social inclusion. As such, it seeks to assess the role and performance of companies and industries and bring evidence to the table of companies showing leadership and stewardship and those that are lagging. The research further shows where each company in the food and agriculture value chain stands today versus what action is required for the transformation we need. Where the Food and Agriculture Benchmark focuses on breadth in terms of company scope and indicators, it also acknowledges the need for an in-depth understanding of the role of particular industries and the issues within the food value chain. This work is often undertaken by our Allies, including the Access to Nutrition Index and Global Canopy’s Forest 500. Additionally, WBA produces spotlight benchmarks, such as the Corporate Human Rights Benchmark (CHRB), the Access to Seeds Index and the Seafood Stewardship Index. The last two spotlight benchmarks are developed under the umbrella of food and agriculture transformation but operate in their respective industry and stakeholder ecosystems. Alignment of methodologies is sought where needed and possible, to accommodate comparisons between results and to ensure clarity for the companies in the benchmarks. WBA will publish the second Food and Agriculture Benchmark and the third Seafood Stewardship Index in the third quarter of 2023. It will also expedite the methodology for the Access to Seeds Index and work to integrate its goals into the Food and Agriculture Benchmark beyond 2023. Access to Seeds Index Hunger is a daily reality for almost one billion people around the world. Improving access to seeds for farmers in the regions that are considered food insecure is key for meeting future food demands. The Access to Seeds Index published three iterations in 2016, 2019 and 2021, and evaluated and compared seed companies on their efforts to improve access to quality seeds of improved varieties for smallholder farmers in South and South-East Asia, Western and Central Africa, and Eastern and Southern Africa. The index was well received in the industry and regarded as a useful resource for an evidence-based discussion among the corporate sector, research organisations, civil society, NGOs and governments. While we see that companies are making progress towards ensuring smallholder farmers’ access to seeds improves, access to finance, digital technologies, knowledge and other key agricultural inputs remains an ongoing challenge that needs urgent attention. In the coming months, WBA will be exploring ways to sustain the Access to Seeds Index methodology through, for example, self-assessment toolkits or partnership and collaboration with relevant stakeholders at a regional and global level. Smallholder agriculture will continue to be the focus of the food and agriculture transformation, and we will aim to understand the efforts of the 350 companies included in the scope of the Food and Agriculture Benchmark to contribute to the development of smallholder farmers. Seafood Stewardship Index Seafood plays a crucial role in feeding and employing people all around the world, especially in developing countries. Three billion people rely on seafood as an essential part of their diet. Seafood also makes an important contribution to healthy and sustainable food systems. However, the fisheries and aquaculture sectors face several social and environmental challenges. The Seafood Stewardship Index was developed to provide more clarity about the corporate performance of the largest global seafood companies on specific issues. These include the protection of human rights in fisheries, supply chain transparency, and illegal, unreported and unregulated fishing. The first Seafood Methodology for the 2023 Food and Agriculture Benchmark 14
Stewardship Index was published in 2019, with a second iteration following in 2021. A third iteration is
set to be published in the autumn of 2023. A revised methodology will be published in December
2022. Research teams behind both the Food and Agriculture Benchmark and the Seafood Stewardship
Index will be working alongside each other and ensuring synergies in the process, particularly
regarding engagement with companies in both benchmarks.

Alignment with WBA’s Nature Benchmark
We must transform the way we live and do business in a way that protects our shared natural
resources. Business leaders have a critical role to play in steering their organisations towards a future
where humanity and nature will thrive.

The urgent need for action on nature contrasts with the current landscape of corporate impacts. While
standards and disclosures are established for some topics, many areas remain uncovered and many
companies are just starting to capture and disclose relevant information. WBA’s Nature Benchmark
methodology was launched in April 2022. It sought to build on existing standards and best practice
while also recognising and trying to fill some of the gaps. WBA’s Nature Benchmark aims to guide
companies through that critical transformation, by assessing 1,000 of the companies with the greatest
impact on nature by 2023. It will examine how nature-positive business impacts contribute to stable
and resilient ecosystems which enable humanity and nature to co-exist within planetary boundaries
on biodiversity, climate, land, oceans and water.

The food and agriculture sector is one of the most critical sectors when it comes to nature
impacts. This is why the 350 keystone food and agriculture companies are in scope of WBA’s
Nature Benchmark. The sector relies heavily on ecosystems while at the same time our global food
system is the primary driver of biodiversity loss (UNEP, 2021). Food production is already a key
contributor to climate change, deforestation, biodiversity loss and freshwater depletion, with almost
half of global food production relying on exceeding the planet’s environmental boundaries (SRC,
2020). Without dedicated measures, these impacts could increase by 60-90% by 2050 (PIK, 2018).
Pressure is therefore mounting to ensure food systems are high on the agenda of COP27, held in
November 2022.

Due to the interlinkages between the two systems – food and agriculture and nature – for 2023, the
350 food and agriculture companies will be assessed both against the updated Food and Agriculture
Benchmark methodology and the Nature Benchmark methodology.1 The research processes for both
benchmarks will be aligned, to ensure a meaningful analysis and smooth engagement with the
companies.

Timeline
2021

Launch of the 2021 Food and Agriculture Benchmark.
First iteration of the benchmark, presenting key findings on main trends, leading approaches and
notable conclusions, tied to industry rankings and company scorecards.

2022

July-August
Public consultation for the draft methodology for the 2023 Food and Agriculture Benchmark.

1
  The only exceptions being BASF, Bayer and Evonik, which will be assessed as part of the Nature Benchmark in 2022 because of
their classification as pharmaceutical/chemical companies.

Methodology for the 2023 Food and Agriculture Benchmark                                                                         15
Outline of the revised indicators and scoring and weighting approaches. Stakeholders, including
companies, provide feedback through online webinars and in written form.

October
Publication of the G7 Sustainable Supply Chain Initiative (SSCI).
WBA assessment of progress made by food and agriculture companies that are part of G7 pledge to
improve on SDGs.

December
Publication of the methodology for the 2023 Food and Agriculture Benchmark.
Final overview of indicators, approach to scoring and weighting and timeline for the 2023 Food and
Agriculture Benchmark.

December
Publication of the methodology for the 2023 Seafood Stewardship Index.
Final overview of indicators, approach to scoring and weighting and timeline for the 2023 Seafood
Stewardship Index.

December
Publication of WBA’s report Driving impact in food and agriculture supply chains: the role of
benchmarking.
Shining a light on companies’ supply chain impact, revealing key findings and learnings for the
benchmark.

2023

February-May
Data collection for the 2023 Food and Agriculture Benchmark.
Data is collected for all benchmark indicators.

April-August
Data assessment and company engagement for the 2023 Food and Agriculture Benchmark.
Collected data is assessed against all indicators of the methodology. Based on this, companies are given
the opportunity to review a draft assessment at the indicator level.

September-October
Launch of the 2023 Food and Agriculture Benchmark.
The second iteration presents progress made by the industry and companies, key findings on main
trends and leading approaches, tied to industry segment rankings and company scorecards.

September-October
Launch of the 2023 Nature Benchmark.
This publication focuses on the role of food and agriculture companies and their performance toward a
nature-positive future. It presents insights into industry and company performance, key findings on main
trends and leading approaches, tied to industry segment rankings and company scorecards.

November
Start of the methodology review process.
Roundtables, consultations and expert sessions are organised to help review the methodology for the
next iteration of the benchmark.

Methodology for the 2023 Food and Agriculture Benchmark                                                    16
Indicators for the 2023 Food and Agriculture
Benchmark

The following sections describe each indicator within the four different measurement areas.

The indicators follow a standard format:

     •     Topic: a short descriptor of the issue.

     •     Indicator: sets out the topic-specific outcomes expected of the company.

     •     Rationale: sets out the reason why the topic is included in the benchmark and why it is
           crucial for food systems transformation and the SDGs.

     •     Elements: set out the indicative scoring guidelines against which companies will be assessed
           for the indicator.

     •     Sources: lists the key existing initiatives that the indicator aligns with or builds upon.

A. Governance and strategy

A1. Sustainability strategy
Indicator: The company has sustainability objectives and targets embedded in its strategy and
business model.

Rationale: A corporate sustainability strategy prioritises and embeds sustainability objectives and
targets and helps the company to deliver on key SDGs. It facilitates the company’s ability to adapt and
change through forward planning, increasing its resilience, managing risks and protecting workers, the
company and society at large.

Elements:

     a.    The company discloses its process for identifying and prioritising its most relevant
           sustainability impacts as well as the outcome of this process, in relation to its sustainability
           strategy.
     b. The company has a sustainability strategy covering its most significant impacts and
          sustainability topics in relation to both its own operations and its value chain.
     c.   The company has group-wide targets on key sustainability topics for the most material parts
          of its value chain.
     d. The company reports consistently on progress against all its targets.

Sources: Forum for the Future and WBSCD (2021), GRI 2-22, 2-23, 3-1, 3-2, 3-3 (2021), IFAC et al.
(2020), UNDP (2021), WEF (2020).

Methodology for the 2023 Food and Agriculture Benchmark                                                       17
Key changes:
Based on stakeholder feedback, and to ensure alignment with other initiatives and benchmarks,
indicators in the governance and strategy measurement area now focus on general company
sustainability objectives and targets instead of a narrower focus on the measurement area dimensions
of environment, nutrition and social inclusion.
A2. Accountability for sustainability strategy
Indicator: The company has a governance system that includes highest level responsibility and
accountability for its sustainability objectives and targets. Senior executive members have incentives
to reward the effective delivery of relevant company strategies and initiatives.
Rationale: Linking sustainable development objectives and targets to roles and remuneration is
important to ensure the accountability of the company in relation to its contribution to sustainable
development objectives and targets. Ensuring capability within decision-making bodies further
indicates a company’s commitment to transition to a sustainable future.
Elements:
a. The company discloses having persons, teams or committees within the company who are
responsible for the implementation of its sustainability strategy.
b. The company provides evidence of assigning decision-making and oversight responsibility for
its sustainability strategy to the highest governance body.2
c. The company provides evidence of linking performance criteria in senior executives’
remuneration policies to its sustainability targets and objectives.
d. The company provides evidence that its highest governance body has expertise with respect
to the company’s most material sustainability topics.
Sources: GRI 2-10, 2-12, 2-13, 2-14, 2-17 (2021), IFAC et al. (2020), UNDP (2021), WEF (2020).
Key changes:
Element d. has been added to identify responsible persons and their qualifications within the
organisation.
2
Highest governance body, as defined by GRI Standards: formalised group of individuals responsible for the strategic guidance
of an organisation, the effective monitoring of management and the accountability of management to the broader organisation
and its stakeholders with the highest authority in the organisation. In some jurisdictions, governance systems consist of two tiers,
where supervision and management are separated or where local law provides for a supervisory board drawn from non-
executives to oversee an executive management board. In such cases, both tiers are included under the definition of highest
governance body (GRI, 2021).
Methodology for the 2023 Food and Agriculture Benchmark 18A3. Stakeholder engagement
Indicator: The company engages with stakeholders3 on sustainable development issues and
incorporates the outcomes of these activities in its strategy and operations.
Rationale: Serving the interests of all stakeholders is key to businesses’ long-term success. Regular
engagement with stakeholders contributes to the company’s understanding of diverse and frequently
opposing perspectives, drives innovation and helps to shape robust and inclusive approaches.
Companies are expected to engage meaningfully with stakeholders.4 Engagement processes are
expected to produce a clear output or action and an acknowledgement of how stakeholder inputs are
used.
Elements:
a. The company discloses an overview of the issues raised during its stakeholder engagement
activities.
b. The company discloses its process for identifying relevant stakeholders across its value chain.
c. The company discloses its process for engaging with stakeholder groups, including frequency
and channels, beyond its materiality assessment or an equivalent.
d. The company discloses the outcomes of its stakeholder engagement activities and their
integration into its sustainability strategy.
e. The company’s stakeholder engagement covers its most material sustainability topics.
Sources: GRI 2-29 (2021), IFAC et al. (2020), SASB (n.d.), UNDP (2021), WEF (2020).
A4. Lobbying and advocacy
Indicator: The company advocates sustainable business policies and regulations and discloses any
misalignment with its lobbying activities as well as the measures it takes to address misalignment.
Rationale: Both individually and through trade associations, companies should advocate sustainable
business policies and regulations. A company that operates sustainably does not finance trade
associations that undermine sustainable business policies. It conducts regular due diligence on the
trade associations it supports, and fully discloses the names of the associations and alignment of their
lobbying activities with policies and regulations that support sustainable business outcomes. It
discloses its action plans to correct any misalignment.
Elements:
a. The company discloses a list of trade associations of which it is a member for all jurisdictions
in which it operates.
b. The company discloses a clear and detailed framework for assessing alignment of its trade
associations with its sustainability targets.
3
Stakeholders, as defined by GRI Standards: individuals or groups that have an interest that is affected or could be affected by
the organisation’s activities. This includes, but is not limited to, local communities, civil society, governments, workers and
employees (GRI 2021).
4
Meaningful stakeholder engagement is characterised by two-way communication and depends on the good faith of
participants on both sides. It is also responsive and ongoing and includes in many cases engaging with relevant stakeholders
before decisions are made.
Methodology for the 2023 Food and Agriculture Benchmark 19c. The company provides evidence of annually applying the framework across all trade
associations.
d. The company reports any misalignment between the lobbying activities of its trade
associations and its sustainability targets.
e. The company discloses an action plan to address misalignment which includes clear
escalation steps.
f. The company discloses clear deadlines for each of its escalation steps and consistently
reports on their application.
g. The company discloses an annual review of all the advocacy activities it has undertaken.
Sources: GRI 2-28, 11-22 (2021), UN PRI (2018), WBA (2021b), WEF (2020).
Key changes:
Indicator A4 (lobbying and advocacy) has been added based on stakeholder input and expert
conversations.
B. Environment
B1. Scope 1 and 2 greenhouse gas emissions
Indicator: The company is reducing its scope 1 and 2 GHG emissions in line with a 1.5°C trajectory.
Rationale: Around a quarter of global GHG emissions are caused by land clearing, crop production
and fertilisation, with animal-based foods contributing 75% to that figure (IPBES, 2019). Without
significant adjustments to agricultural practices, GHG emissions from agriculture are likely to increase
15-20% by 2050 (WEF, 2020). This indicator is aligned with the SBTi’s interim target to reduce value
chain GHG emissions by 50% by 2030 and by 90-95% by 2050, in accordance with sectoral ambitions
by 2030. (SDGs 7 and 13)
Elements:
a. The company discloses quantitative reductions for its scope 1 and 2 emissions.
b. The company has targets5 to reduce its scope 1 and 2 emissions.
c. The company reports progress against its scope 1 and 2 emissions reduction targets.
d. The company's scope 1 and 2 emissions reduction targets are aligned with a 1.5°C trajectory.
Sources: CDP Climate (2021), FAO (2021), GHG Protocol Agricultural Guidance (2014), GRI 13 (2022),
GRI 305 (2016), SASB (n.d.), SBTi (2022), SBTN (2020).
B2. Scope 3 greenhouse gas emissions
Indicator: The company is reducing its scope 3 GHG emissions in line with a 1.5°C trajectory.
5
Indicators B1 and B2 will accept net-zero targets. Please refer to the SBTi's Net-Zero Standard for guidance on and tools for
setting science-based net-zero targets.
Methodology for the 2023 Food and Agriculture Benchmark 20Rationale: Of the 2019 global anthropogenic emissions, approximately 31% came from agri-food
systems – with the majority of emissions from agricultural land, followed by pre- and post-production
processes and land-use change (FAO, 2021). It is estimated that about 40% of global GHG emissions
are driven, or influenced, by companies through their purchases and the products they sell (CDP,
2018). (SDGs 7 and 13)
Elements:
a. The company discloses only some categories of its scope 3 emissions.
b. The company discloses quantitative reductions for its scope 3 emissions.
c. The company has targets to reduce scope 3 emissions.
d. The company reports progress against its scope 3 emissions reduction targets.
e. The company's scope 3 emissions reduction targets are aligned with a 1.5°C trajectory.
Sources: CDP Climate (2021), FAO (2021), GHG Protocol Agricultural Guidance (2014), GRI 13 (2022),
GRI 305 (2021), SASB (n.d.), SBTi (2022), SBTN (2020).
B3. Ecosystem conversion
Indicator: The company demonstrates that it is achieving deforestation and conversion 6-free supply
chains for its high-risk commodities.
Rationale: Land use change through the conversion of natural habitats is among the most significant
drivers of biodiversity loss in terrestrial ecosystems. Agricultural production alone is responsible for
80% of global deforestation (WWF, 2020). Such commodity-driven tropical deforestation, where
forests are cleared to make way for land to grow crops or raise cattle, is responsible for approximately
5% of global greenhouse gas emissions (Ceres, 2020). (SDGs 12, 13 and 15)
Elements:
a. The company discloses qualitative evidence of working towards achieving deforestation and
conversion-free (DCF) supply chains for its relevant high-risk commodities.7
b. The company discloses the proportion of commodities that are DCF-free.
c. The company has a DCF target and reports progress against it.
d. The company's DCF target covers all its high-risk commodities.
e. The company discloses evidence that it has achieved 100% DCF supply chains for all its
relevant high-risk commodities.
Sources: AFi (n.d.), CDP Forests (2021), FAO (2021), Forest 500 (2021), GRI 13 (2022), SBTN (2020),
SPOTT (2021).
6
As defined by the Accountability Framework initiative, conversion is the change of a natural ecosystem to another land use or
profound change in a natural ecosystem's species composition, structure or function. Deforestation is one form of conversion.
7
Key high-risk commodities: beef, palm oil, soya, cocoa, coffee.
Methodology for the 2023 Food and Agriculture Benchmark 21B4. Sustainable fishing and aquaculture
Indicator: The company demonstrates sustainable fishing and aquaculture operations and/or the
sustainable sourcing of seafood and aquaculture feed ingredients.
Rationale: To safeguard fish populations and marine biodiversity, companies need to contribute to
sustainably managed marine aquatic resources. According to the FAO, in 2017 about a third of the
global fish stocks were overfished, while nearly 60% were fully exploited (FAO, 2020). (SDGs 12 and
14)
This indicator is applicable only to companies for which animal proteins are a part of their
operations and/or supply chain.
Elements:
a. The company provides qualitative evidence of a commitment to sustainable fishing and
aquaculture with reference to environmental sourcing criteria.
b. The company provides quantitative evidence of increasing the percentage of its sustainable
fisheries and aquaculture operations and sourcing.
c. The company has a target for sustainable fisheries and aquaculture for 100% of its portfolio
and reports progress against this target. In its progress reporting, the company discloses the
proportion of its portfolio covered by each certification scheme, improvement project or
other sustainability programme.
d. The company provides evidence that 100% of its portfolio comes from sustainable fisheries
and aquaculture.
Sources: CASS (2021), CEA Consulting (2022), FAIRR (2021), GRI 13 (2022), GSSI (2021), ISEAL (n.a.).
B5. Protein diversification
Indicator: The company is transitioning to a diversified protein portfolio.
Rationale: The animal protein sector is a significant contributor to climate change and deforestation
(WBCSD, 2020). Research has shown that simply improving meat and dairy production practices will
be insufficient to resolve these issues; a shift in consumption patterns will also be required (IPCC,
2019). (SDGs 2, 3 and 13)
This indicator is applicable only to companies for which animal proteins are a part of their
operations and/or supply chain.
Elements:
a. The company discloses qualitative evidence of protein diversification activities or
commitments.
b. The company discloses quantitative evidence of increasing alternative proteins8 within its
portfolio through, for example, an increase in the sales/products/menus that consist of
alternative proteins.
8
Alternative proteins are defined as plant-based proteins and other alternatives, such as cell-based meat analogues and plant-
based dairy alternatives (WBA definition).
Methodology for the 2023 Food and Agriculture Benchmark 22c. The company discloses the proportion of alternative proteins and animal proteins through,
for example, tonnes sold or volume sales in its portfolio, or through procurement/sourcing.
d. The company has a sales-based target to increase alternative proteins across its portfolio and
reports progress against it.
Sources: FAIRR (2021), The Food Foundation (2021), WWF (2022).
Key changes:
Element c. was added based on the latest reporting guidelines from WWF’s publication on The
Journey to Corporate Protein Disclosure.
B6. Soil health and agrobiodiversity
Indicator: The company adopts sustainable production and sourcing practices that improve soil
health and increase agrobiodiversity.
Rationale: According to the FAO (2021), approximately one third of the world’s soils are moderately
to highly degraded. Soil erosion causes significant negative impacts such as disrupting the soil’s
ability to store and cycle carbon, nutrients and water, and reducing crop yields – resulting in
production losses of around 7.6 million tonnes for cereals alone. Scaling up regenerative agricultural
practices can increase agrobiodiversity and resilience, boost total productivity and the nutritional
status of diets, while reducing the need for water and agricultural inputs (FOLU, 2019). (SDGs 2, 12, 13
and 15)
Elements:9
a. The company provides qualitative evidence of improving soil health and/or increasing
agrobiodiversity in its production and/or sourcing practices.
b. The company provides quantitative evidence of improving soil health and/or increasing
agrobiodiversity in its production and/or sourcing practices.
c. The company has a target to improve soil health in its production and/or sourcing practices
and reports progress against it.
d. The company has a target to increase agrobiodiversity in its production and/or sourcing
practices and reports progress against it.
e. The company discloses quantifiable data on its impact on soil health and/or agrobiodiversity
in its production and/or sourcing practices.
Sources: Bioversity International (2020), FAO (2020), FAO (2021), GRI 13 (2022), OP2B (2021),
Rainforest Alliance (2022).
9
Companies in the upstream segments are expected to report on their production practices, while those in the downstream
segment are expected to report on their sourcing practices. Vertically integrated companies need to meet elements across both
their production and sourcing practices.
Methodology for the 2023 Food and Agriculture Benchmark 23You can also read